. 2016 Sep;90(3):580-97.
doi: 10.1016/j.kint.2016.04.028. Epub 2016 Jul 27.

Cardiac dysfunction in Pkd1-deficient mice with phenotype rescue by galectin-3 knockout

Affiliations

Cardiac dysfunction in Pkd1-deficient mice with phenotype rescue by galectin-3 knockout

Bruno E Balbo et al. Kidney Int. 2016 Sep.

Erratum in

Abstract

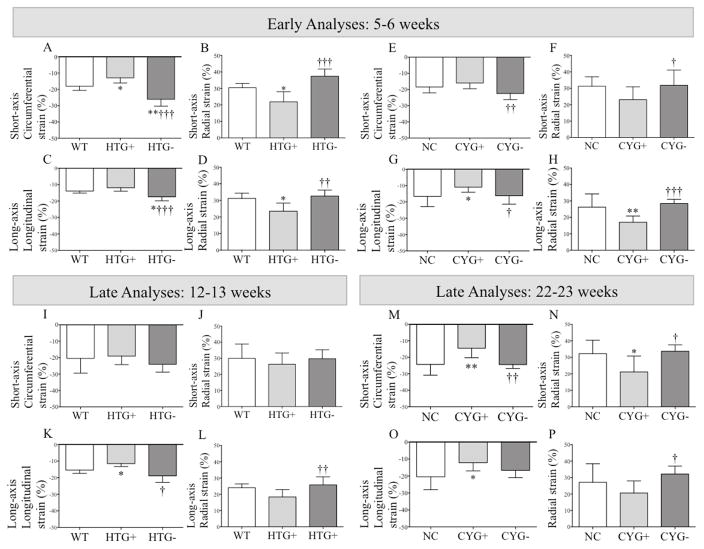
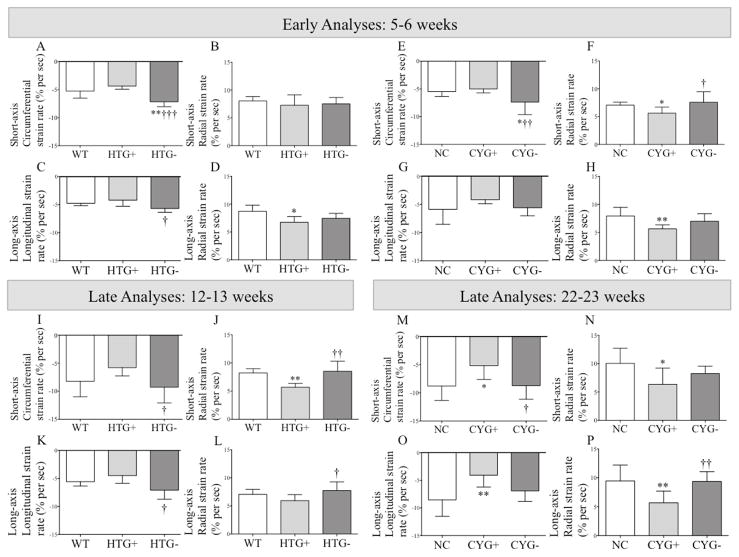
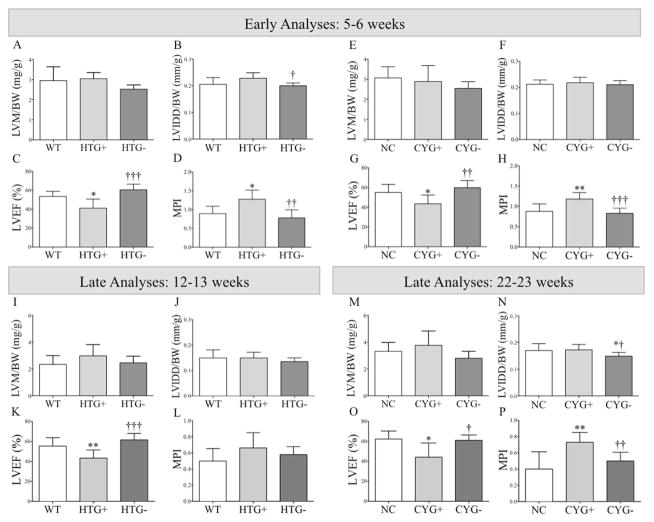
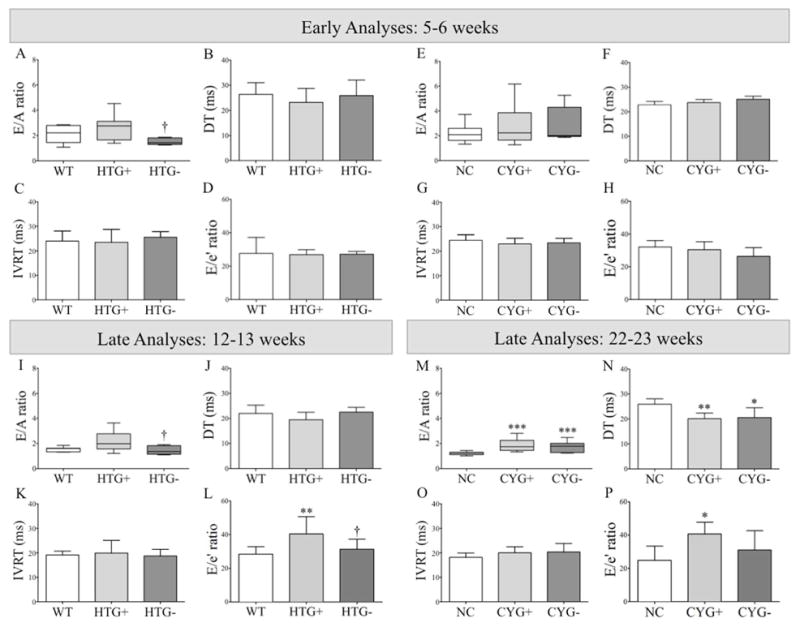
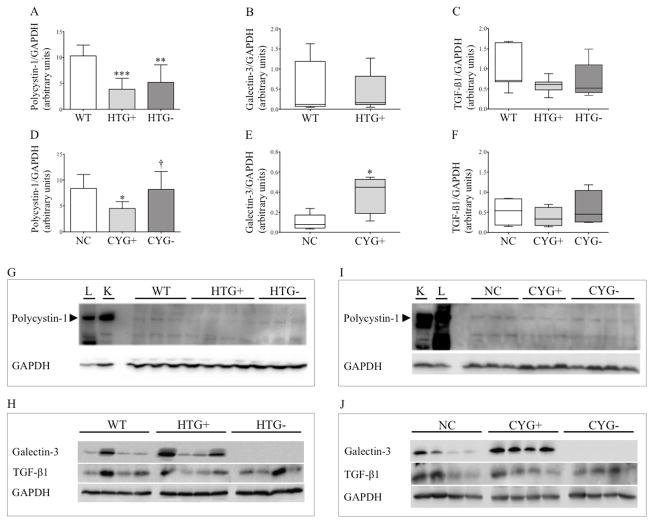
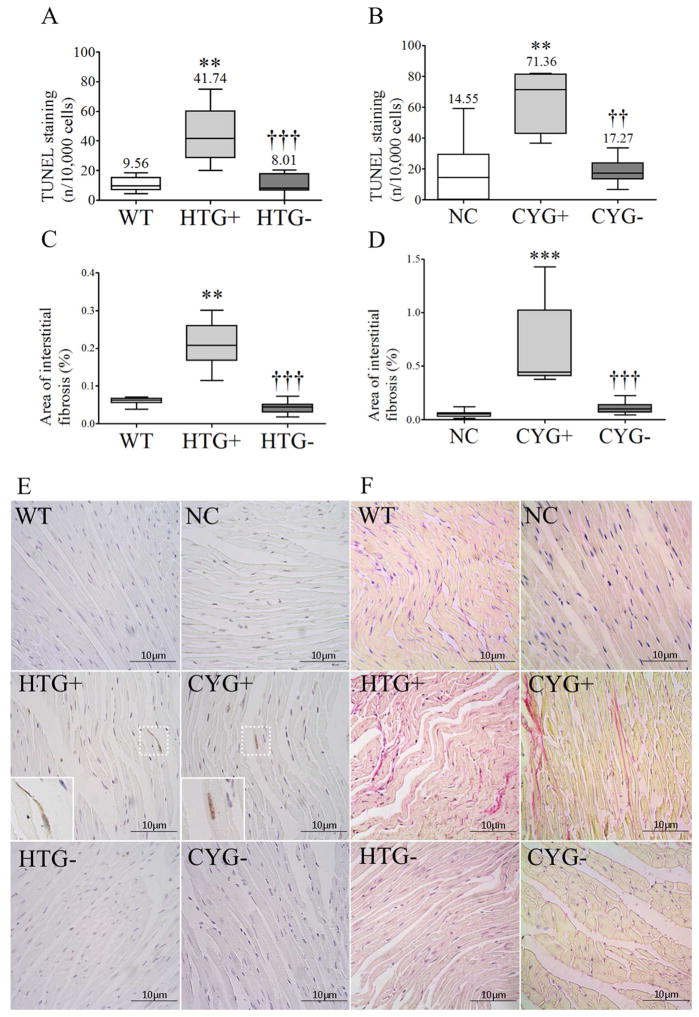
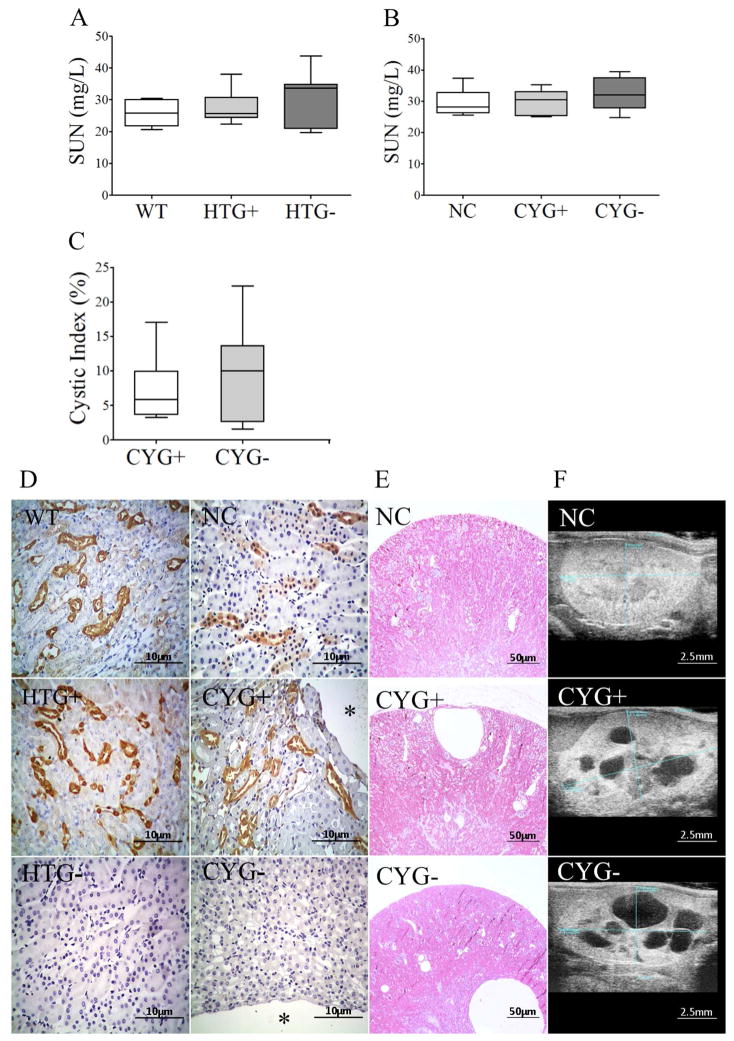
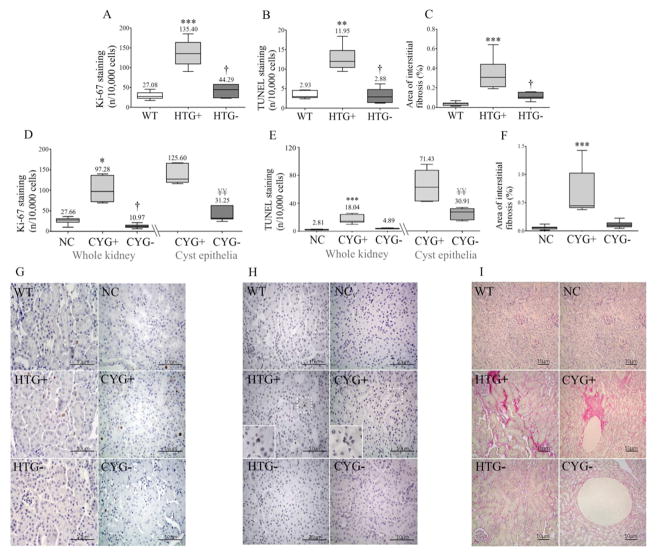
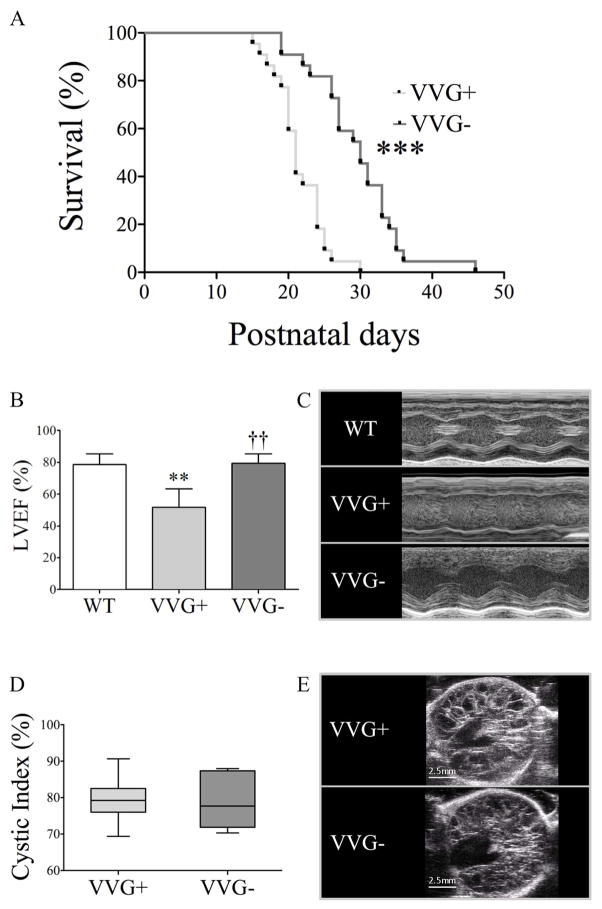
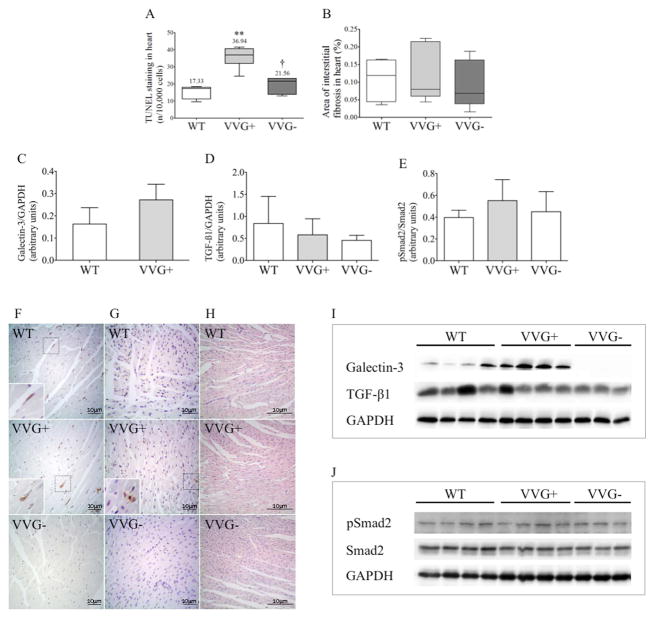
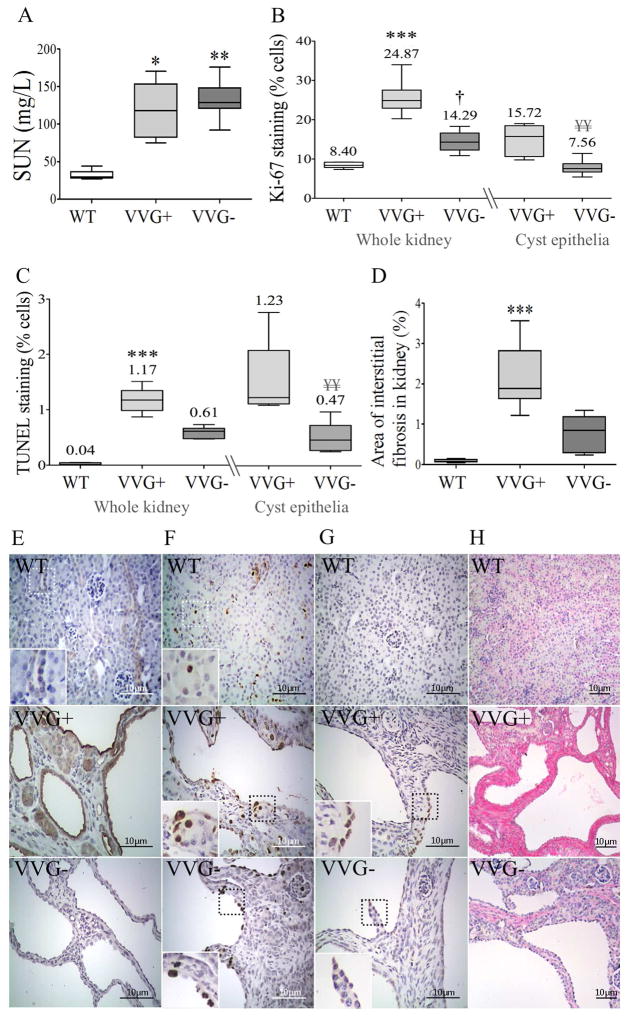
Alterations in myocardial wall texture stand out among ADPKD cardiovascular manifestations in hypertensive and normotensive patients. To elucidate their pathogenesis, we analyzed the cardiac phenotype in Pkd1(cond/cond)Nestin(cre) (CYG+) cystic mice exposed to increased blood pressure, at 5 to 6 and 20 to 24 weeks of age, and Pkd1(+/-) (HTG+) noncystic mice at 5-6 and 10-13 weeks. Echocardiographic analyses revealed decreased myocardial deformation and systolic function in CYG+ and HTG+ mice, as well as diastolic dysfunction in older CYG+ mice, compared to their Pkd1(cond/cond) and Pkd1(+/+) controls. Hearts from CYG+ and HTG+ mice presented reduced polycystin-1 expression, increased apoptosis, and mild fibrosis. Since galectin-3 has been associated with heart dysfunction, we studied it as a potential modifier of the ADPKD cardiac phenotype. Double-mutant Pkd1(cond/cond):Nestin(cre);Lgals3(-/-) (CYG-) and Pkd1(+/-);Lgals3(-/-) (HTG-) mice displayed improved cardiac deformability and systolic parameters compared to single-mutants, not differing from the controls. CYG- and HTG- showed decreased apoptosis and fibrosis. Analysis of a severe cystic model (Pkd1(V/V); VVG+) showed that Pkd1(V/V);Lgals3(-/-) (VVG-) mice have longer survival, decreased cardiac apoptosis and improved heart function compared to VVG+. CYG- and VVG- animals showed no difference in renal cystic burden compared to CYG+ and VVG+ mice. Thus, myocardial dysfunction occurs in different Pkd1-deficient models and suppression of galectin-3 expression rescues this phenotype.

Keywords: ADPKD; Pkd1-deficiency; apoptosis; cardiac dysfunction; cardiomyopathy; galectin-3.


Figures

Figure 1
Figure 1
Strain analyses in Pkd1-deficient mice. Comparative analyses of (A, E, I and M) short-axis circumferential strain; (B, F, J and N) short-axis radial strain; (C, G, K and O) long-axis longitudinal strain; and (D, H, L and P) long-axis radial strain among (A–D) WT, HTG+ and HTG− mice at 5–6 wk of age; (I–L) WT, HTG+ and HTG− animals at 12–13 wk; (E–H) NC, CYG+ and CYG− mice at 5–6 wk; and (M–P) NC, CYG+ and CYG− animals at 22–23 wk. Parametric data were compared using one-way ANOVA, with results presented as mean±SD. A–D and I–L: *p<0.05 vs WT; †p<0.05 vs HTG+; ††p<0.01 vs HTG+; †††p<0.01 vs HTG+. EH and M–P: *p<0.05 vs NC; **p<0.01 vs NC; †p<0.05 vs CYG+; ††p<0.01 vs CYG+; †††p<0.01 vs CYG+.
Figure 2
Figure 2
Strain rate analyses in Pkd1-deficient mice. Comparative analyses of (A, E, I and M) short-axis circumferential strain rate; (B, F, J and N) short-axis radial strain rate; (C, G, K and O) long-axis longitudinal strain rate; and (D, H, L and P) long-axis radial strain rate among (AD) WT, HTG+ and HTG− mice at 5–6 wk of age; (I–L) WT, HTG+ and HTG− animals at 12–13 wk; (E–H) NC, CYG+ and CYG− mice at 5–6 wk; and (M–P) NC, CYG+ and CYG− animals at 22–23 wk. Parametric data were compared using one-way ANOVA, with results presented as mean±SD. A–D and I–L: *p<0.05 vs WT; †p<0.05 vs HTG+; †††p<0.01 vs HTG+. E–H and M–P: *p<0.05 vs NC; **p<0.01 vs NC; †p<0.05 vs CYG+; ††p<0.01 vs CYG+.
Figure 3
Figure 3
Structural and systolic function analyses in Pkd1-deficient mice. Comparative analyses of (A, E, I and M) left ventricular mass normalized to body weight (LVM/BW); (B, F, J and N) left ventricular internal diameter in diastole normalized to body weight (LVIDD/BW); (C, G, K and O) left ventricular ejection fraction (LVEF); and (D, H, L and P) myocardial performance index (MPI) among (A–D) WT, HTG+ and HTG− mice at 5–6 wk of age; (I–L) WT, HTG+ and HTG− animals at 12–13 wk; (E–H) NC, CYG+ and CTG− mice at 5–6 wk; and (M–P) NC, CYG+ and CYG− animals at 22–23 wk. Parametric data were compared using one-way ANOVA, with results presented as mean±SD. A–D and I–L: *p<0.05 vs WT; **p<0.01 vs WT; †p<0.05 vs HTG+; ††p<0.01 vs HTG+; and †††p<0.001 vs HTG+. E–H and M–P: *p<0.05 vs NC; **p<0.01 vs NC; †p<0.05 vs CYG+; ††p<0.01 vs CYG+; and †††p<0.001 vs CYG+.
Figure 4
Figure 4
Analyses of diastolic function in Pkd1-deficient mice. Comparative analyses of (A, E, I and M) E/A ratio; (B, F, J and N) deceleration time (DT); (C, G, K and O) isovolumetric relaxation time (IVRT); and (D, H, L and P) E/e′ ratio among (A–D) WT, HTG+ and HTG− mice at 5–6 wk of age; (I–L) WT, HTG+ and HTG− animals at 12–13 wk; (E–H) NC, CYG+ and CYG− mice at 5–6 wk; and (M–P) NC, CYG+ and CYG− animals at 22–23 wk. Parametric data were compared using one-way ANOVA, with results presented as mean±SD. Non-parametric data were compared by the Kruskal-Wallis test, with results expressed as median (lower to upper quartile). A–D and I–L: **p<0.01 vs WT; and †p<0.05 vs HTG+. E–H and M–P: **p<0.01 vs NC; and ***p<0.001 vs NC.
Figure 5
Figure 5
Polycystin-1, galectin-3 and TGF-β1 expression in heart tissue. Comparative western blot analyses of polycystin-1 expression among (A) WT (n=6), HTG+ (n=6) and HTG− (n=8) mice; and (D) NC (n=7), CYG+ (n=7) and CYG− (n=6) animals. Comparative analyses of galectin-3 expression between (B) WT (n=7) and HTG+ (n=9) mice; and (E) NC (n=5) and CYG+ (n=5) animals. Comparative analyses of TGF-β1 expression among (C) WT (n=7), HTG+ (n=9) and HTG− (n=5) mice; and (F) NC (n=4), CYG+ (n=4) and CYG− (n=4) animals. A, D: 6 wk; B, C: 13 wk; E, F: 23 wk. Immunoblots showing polycystin-1/GAPDH expression ratio in (G) WT, HTG+ and HTG− mice; and (I) NC, CYG+ and CYG− animals. L: lung tissue; K: medullary kidney tissue. Immunoblots showing galectin-3/GAPDH and TGF-β1/GAPDH expression ratios in (H) WT, HTG+ and HTG− mice; and (J) NC, CYG+ and CYG− animals. Parametric data were compared by one-way ANOVA in A and D, with results presented as mean±SD. Non-parametric data were compared by the Mann-Whitney test in B, C, E and F, with results presented as median (lower to upper quartile). A–C: **p<0,01 vs WT; and ***p<0,001 vs WT. D–F: *p<0,05 vs NC; and †p<0,05 vs CYG+.
Figure 6
Figure 6
Apoptosis and fibrosis in heart tissue. Comparative analyses of (A) TUNEL staining among WT (n=7), HTG+ (n=9) and HTG− (n=7) mice; (B) TUNEL staining among NC (n=9), CYG+ (n=7) and CYG− animals (n=8); (C) Sirius red staining among WT (n=8), HTG+ (n=11) and HTG− (n=8) mice; and (D) Sirius red staining among NC (n=9), CYG+ (n=7) and CYG− (n=6) animals. A, C: 13 wk; B, D: 23 wk. (E) Representative images of TUNEL staining in cardiac tissue. Original magnification, x400; inserts x800. Scale bars, 10 μm. (F) Representative images of Sirius red staining in heart tissue. Original magnification, x400; scale bars, 10 μm. Non-parametric data were compared by Kruskal-Wallis test, with results expressed as median (lower to upper quartile). A, C: **p<0.01 vs WT; †††p<0.001 vs HTG+. B, D: **p<0.01 vs NC; ***p<0.001 vs NC; ††p<0.01 vs CYG+; †††p<0.001 vs CYG+.
Figure 7
Figure 7
Renal phenotype in Pkd1-deficient mice. Comparative analyses of SUN among (A) WT, HTG+ and HTG− mice at 10–11 wk of age, and among (B) NC, CYG+ and CYG− animals at 20–21 wk; and comparative analyses of renal cystic index between (C) CYG+ and CYG− mice at 22–23 wk. (D) Representative images of galectin-3 staining in WT, HTG+, HTG−, NC, CYG+ and CYG− kidneys. Original magnification, x400; scale bar, 10 μm. The * symbol indicates a cyst. (E) H&E representative images of kidney cysts in CYG+ and CYG− mice, and absence of cysts in NC mice. Original magnification, x40; scale bar, 50 μm. (F) Representative ultrasound images in longitudinal axis of NC, CYG+ and CYG− kidneys; scale bar, 2.5 mm. Non-parametric data were compared by Kruskal-Wallis test (A, B) and Mann-Whitney test (C), with results expressed as median (lower to upper quartile).
Figure 8
Figure 8
Cell proliferation, apoptosis and fibrosis in renal tissue. Comparative analyses of renal cell Ki-67 staining among (A) WT (n=6), HTG+ (n=10) and HTG− (n=6) organs, and (D) NC (n=7), CYG+ (n=5) and CYG− (n=7) in whole kidney, and in CYG+ and CYG− in cyst epithelia; comparative analyses of renal TUNEL staining among (B) WT (n=5), HTG+ (n=6) and HTG− (n=5) mice in whole kidney, and in CYG+ and CYG− cyst epithelia, and (E) NC (n=7), CYG+ (n=6) and CYG− (n=6) animals; and comparative analyses of area of interstitial fibrosis among (C) WT (n=8), HTG+ (n=11) and HTG− (n=7) kidneys, and (F) NC (n=9), CYG+ (n=7) and CYG− (n=7) organs. (G) Representative images of Ki-67 staining. (H) Representative images of TUNEL staining. (I) Representative images of Sirius red staining. G–H: Original magnification, x400; inserts x800; scale bar, 10 μm. I: Original magnification, x200; scale bar, 10 μm. Non-parametric data were compared by Kruskal-Wallis or Mann-Whitney test, with results expressed as median (lower to upper quartile). A–C: **p<0.01 vs WT; ***p<0.001 vs WT; †p<0.05 vs HTG+. D–F: *p<0.05 vs NC; ***p<0.001 vs NC. †p<0.05 vs CYG+. D, E: ¥¥p<0.01 vs CYG+ in cyst epithelia.
Figure 9
Figure 9
Effects of Lgals3 knockout in survival, cardiac and renal phenotypes in Pkd1+/+, Pkd1V/V and Pkd1V/V;Lgals3−/− mice. (A) Survival of VVG+ and VVG− mice. The median age of survival was 21 days [20–24] for VVG+ mice (n=22) mice and 30 days [26–33] for VVG− animals (n=22). (B) Left ventricular ejection fraction in WT, VVG+ and VVG− mice at P18. (C) M-mode images used for LVEF calculation in (B). (D) Comparative analyses of renal cystic index between VVG+ and VVG− mice at P18. (E) Representative ultrasound images in transversal axis of VVG+ and VVG− kidneys; scale bar, 2.5 mm. In (A), data were compared with the Log-rank test. ***p<0.001 vs VVG+. In (B), parametric data were compared using one-way ANOVA, with results presented as mean±SD. In (D), non-parametric data were compared using the Kruskal-Wallis test, with results expressed as median (lower to upper quartile). **p<0.01 vs WT; ††p<0.01 vs VVG+.
Figure 10
Figure 10
Cardiac phenotype in Pkd1+/+, Pkd1V/V and Pkd1V/V;Lgals3−/− mice at P18. (A) TUNEL staining in WT (n=5), VVG+ (n=6) and VVG− (n=7) hearts; (B) area of cardiac interstitial fibrosis in WT (n=5), VVG+ (n=6) and VVG− (n=7) mice. (C) Comparative western blot analysis of galectin-3 expression in heart tissue in WT (n=6) and VVG+ (n=6) animals; (D) comparative analysis of TGF-β1 expression in WT (n=6), VVG+ (n=6) and VVG− (n=5) hearts; (E) comparative analysis of pSmad2/Smad2 ratio in WT (n=6), VVG+ (n=6) and VVG− (n=6) hearts. Representative images in heart tissue of (F) galectin-3 expression; (G) TUNEL staining; and (H) Sirius red staining. In (F–H), original magnification, x400; inserts x800; scale bar, 10 μm. In (H), original magnification, x200; scale bar, 10 μm. Immunoblots showing galectin-3 (I) and TGF-β1 (J) expression relative to GAPDH in WT, VVG+ and VVG− hearts. Parametric data were compared using one-way ANOVA, with results presented as mean±SD. Non-parametric data were compared by Kruskal-Wallis test, with results expressed as median (lower to upper quartile). **p<0.01 vs WT; †p<0.05 vs VVG+.
Figure 11
Figure 11
Renal phenotype in Pkd1+/+, Pkd1V/V and Pkd1V/V;Lgals3−/− mice at P18. Comparative analyses of (A) SUN among WT (n=5), VVG+ (n=6) and VVG− (n=8) mice; (B) Ki-67 staining in renal tissue among WT (n=5), VVG+ (n=6) and VVG− (n=8) animals; (C) TUNEL staining in renal tissue among WT (n=5), VVG+ (n=5) and VVG− (n=6) mice; and (D) area of interstitial fibrosis in renal tissue among WT (n=5), VVG+ (n=6) and VVG− (n=8) animals. Representative images in kidney tissue of (E) galectin-3 expression; (F) Ki-67 staining; (G) TUNEL staining; and (H) Sirius red staining. In (E–G), original magnification, x400; inserts x800; scale bar, 10 μm. In (H), original magnification, x200; scale bar, 10 μm. Non-parametric data were compared by Kruskal-Wallis test, with results expressed as median (lower to upper quartile). *p<0.05 vs WT; **p<0.01 vs WT; ***p<0.001 vs WT; †p<0.05 vs VVG+. ¥¥p<0.01 vs VVG+ in cyst epithelia.

Similar articles

Cited by

References

    1. Perrone RD, Ruthazer R, Terrin NC. Survival after end-stage renal disease in autosomal dominant polycystic kidney disease: Contribution of extrarenal complications to mortality. Am J Kidney Dis. 2001;38(4):777–84. - PubMed
    1. Ecder T, Schrier RW. Cardiovascular abnormalities in autosomal dominant polycystic kidney disease. Nat Rev Nephrol. 2009;5(4):221–28. - PMC - PubMed
    1. Rahbari-Oskoui F, Williams O, Chapman A. Mechanisms and management of hypertension in autosomal dominant polycystic kidney disease. Nephrol Dial Transplant. 2014;29(12):2194–201. - PubMed
    1. Chapman AB, Johnson AM, Rainguet S, et al. Left ventricular hypertrophy in autosomal dominant polycystic kidney disease. J Am Soc Nephrol. 1997;8(8):1292–7. - PubMed
    1. Bardají A, Vea AM, Gutierrez C, et al. Left ventricular mass and diastolic function in normotensive young adults with autosomal dominant polycystic kidney disease. Am J Kidney Dis. 1998;32(6):970–5. - PubMed

Publication types

MeSH terms

LinkOut - more resources