

Non-invasive assessment of portal hypertension using quantitative magnetic resonance imaging
- PMID: 27475617
- PMCID: PMC5123896
- DOI: 10.1016/j.jhep.2016.07.021
Non-invasive assessment of portal hypertension using quantitative magnetic resonance imaging
Abstract
Background & aims: Hepatic venous pressure gradient (HVPG) measurement is currently the only validated technique to accurately evaluate changes in portal pressure. In this study, we evaluate the use of non-contrast quantitative magnetic resonance imaging (MRI) as a surrogate measure of portal pressure.
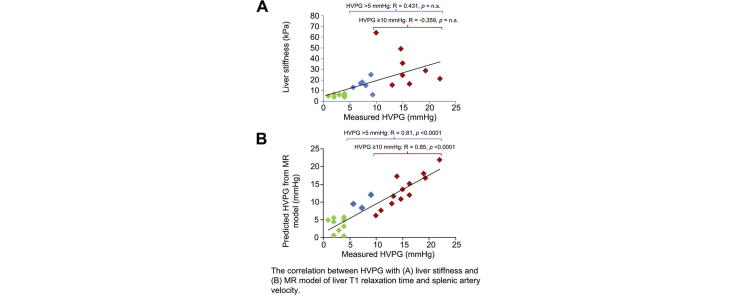
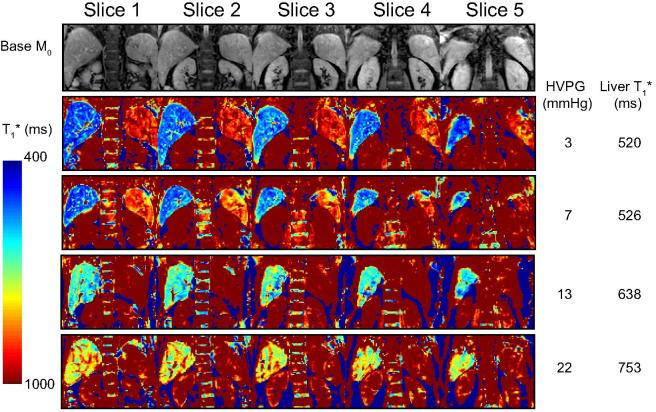
Methods: Thirty patients undergoing HVPG measurement were prospectively recruited. MR parameters of longitudinal relaxation time (T1), perfusion of the liver and spleen (by arterial spin labelling), and blood flow in the portal, splanchnic and collateral circulation (by phase contrast MRI) were assessed. We estimated the liver stiffness measurement (LSM) and enhanced liver fibrosis (ELF) score. The correlation of all non-invasive parameters with HVPG was evaluated.
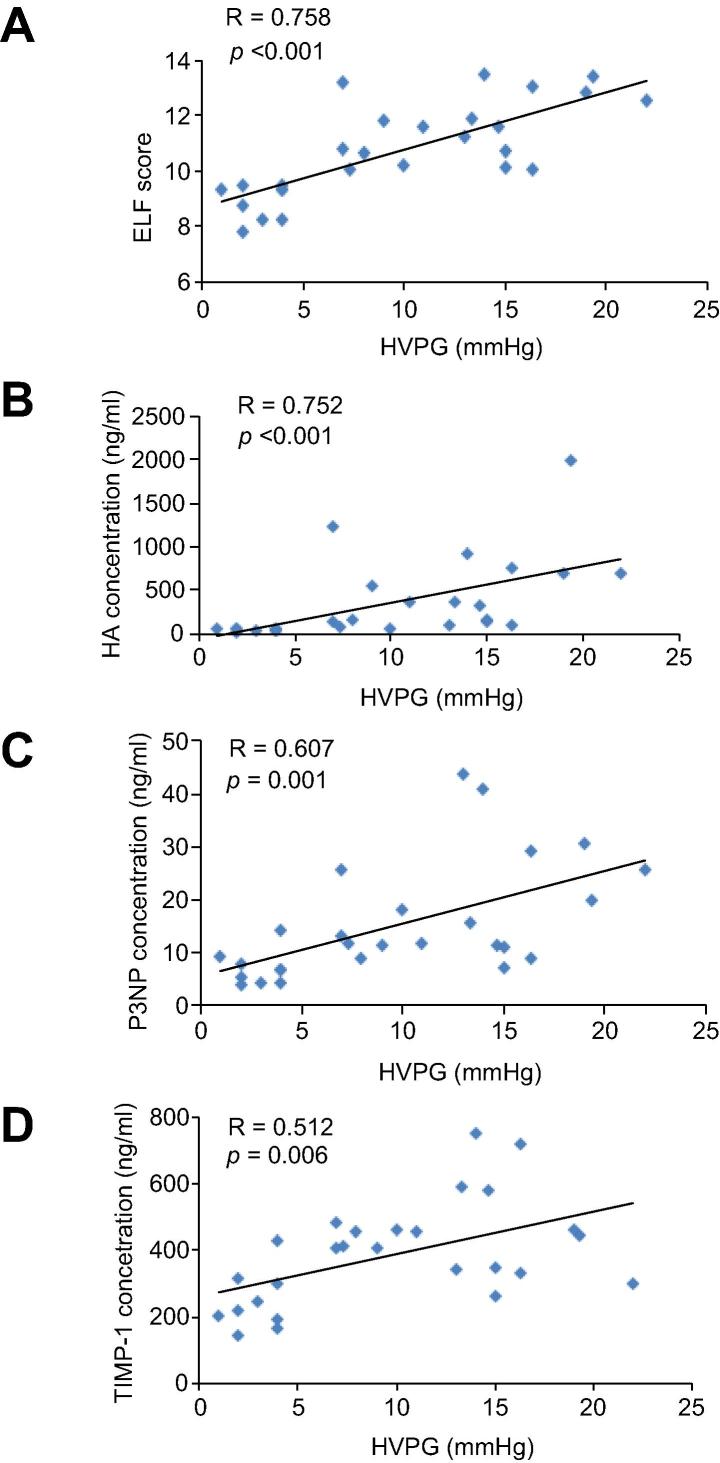
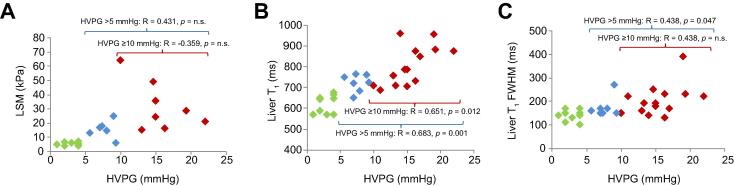
Results: The mean (range) HVPG of the patients was 9.8 (1-22) mmHg, and 14 patients (48%) had clinically significant portal hypertension (CSPH, HVPG ⩾10mmHg). Liver T1 relaxation time, splenic artery and superior mesenteric artery velocity correlated significantly with HVPG. Using multiple linear regression, liver T1 and splenic artery velocity remained as the two parameters in the multivariate model significantly associated with HVPG (R=0.90, p<0.001). This correlation was maintained in patients with CSPH (R=0.85, p<0.001). A validation cohort (n=10) showed this linear model provided a good prediction of HVPG. LSM and ELF score correlated significantly with HVPG in the whole population but the correlation was absent in CSPH.
Conclusions: MR parameters related to both hepatic architecture and splanchnic haemodynamics correlate significantly with HVPG. This proposed model, confirmed in a validation cohort, could replace the invasive HVPG measurement.
Lay summary: In patients with cirrhosis, the development and progression of portal hypertension is related to worse outcomes. However, the standard technique of assessing portal pressure is invasive and not widely used in clinical practice. Here, we have studied the use of non-invasive MRI in evaluating portal pressure. The MRI measures of liver architecture and blood flow in the splenic artery correlated well with portal pressure. Therefore, this non-invasive method can potentially be used to assess portal pressure in clinical trials and monitoring treatment in practice.
Keywords: Hepatic venous pressure gradient; Longitudinal T(1) relaxation time; Magnetic resonance imaging; Portal hypertension.
Copyright © 2016 European Association for the Study of the Liver. Published by Elsevier B.V. All rights reserved.
Figures


Comment in
-
Non-invasive estimation of HVPG by combined structural and hemodynamic evaluation of portal hypertension using quantitative magnetic resonance imaging.J Hepatol. 2016 Dec;65(6):1079-1080. doi: 10.1016/j.jhep.2016.09.007. Epub 2016 Sep 20. J Hepatol. 2016. PMID: 27663418 No abstract available.
References
-
- Groszmann R.J., Wongcharatrawee S. The hepatic venous pressure gradient: Anything worth doing should be done right. Hepatology. 2004;39:280–282. - PubMed
-
- Groszmann R.J., Garcia-Tsao G., Bosch J., Grace N.D., Burroughs A.K., Planas R. Beta-blockers to prevent gastroesophageal varices in patients with cirrhosis. N Engl J Med. 2005;353:2254–2261. - PubMed
-
- Ripoll C., Groszmann R., Garcia-Tsao G., Grace N., Burroughs A., Planas R. Hepatic venous pressure gradient predicts clinical decompensation in patients with compensated cirrhosis. Gastroenterology. 2007;133:481–488. - PubMed
MeSH terms
Grants and funding
LinkOut - more resources
Full Text Sources
Other Literature Sources
Molecular Biology Databases
