. 2017 Jan:35:250-269.
doi: 10.1016/j.media.2016.07.009. Epub 2016 Jul 21.

ISLES 2015 - A public evaluation benchmark for ischemic stroke lesion segmentation from multispectral MRI

Affiliations

ISLES 2015 - A public evaluation benchmark for ischemic stroke lesion segmentation from multispectral MRI

Oskar Maier et al. Med Image Anal. 2017 Jan.

Abstract

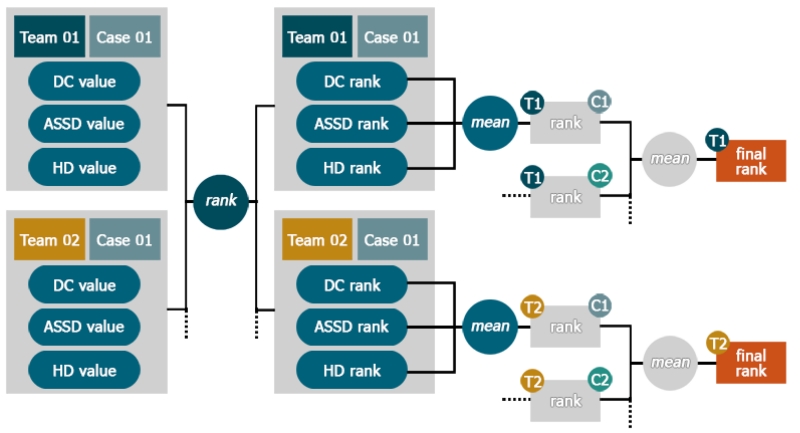
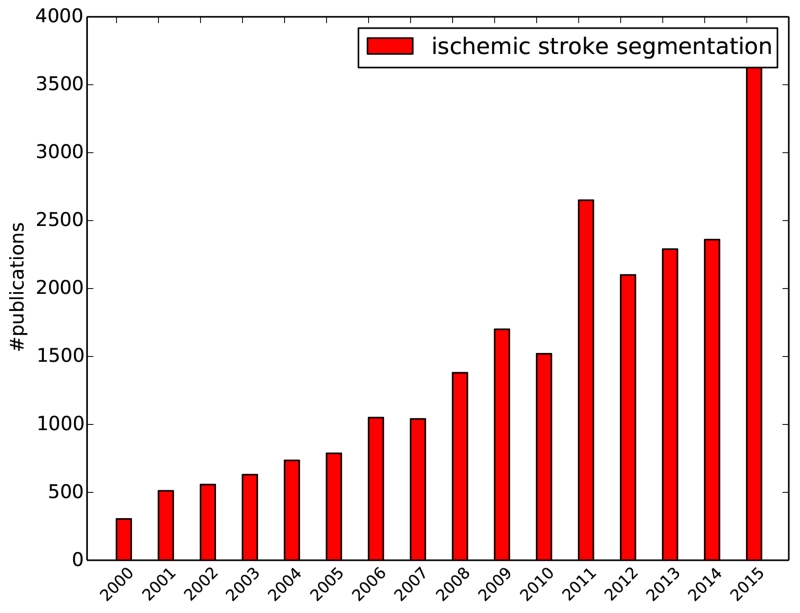
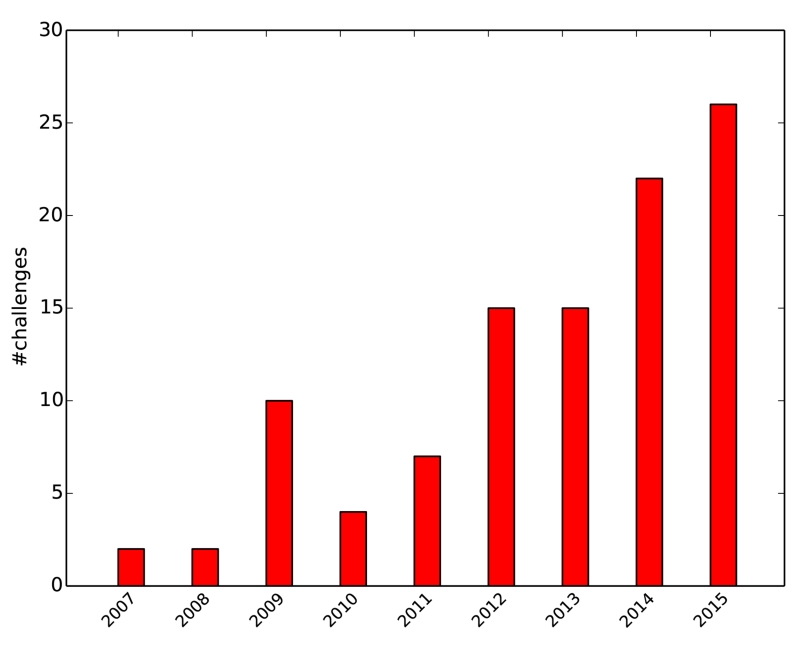
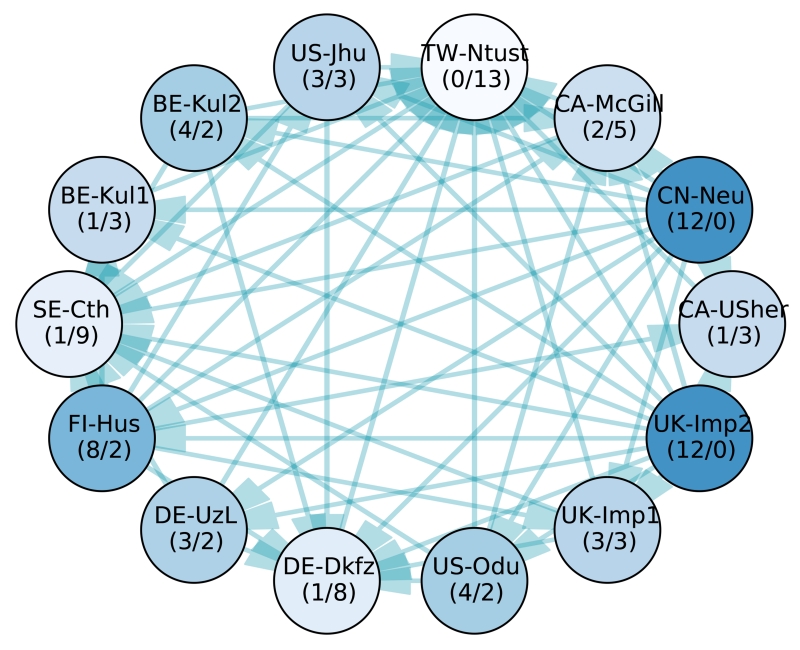
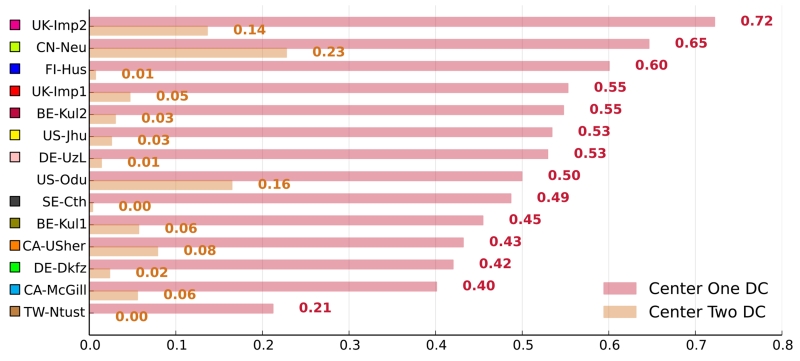
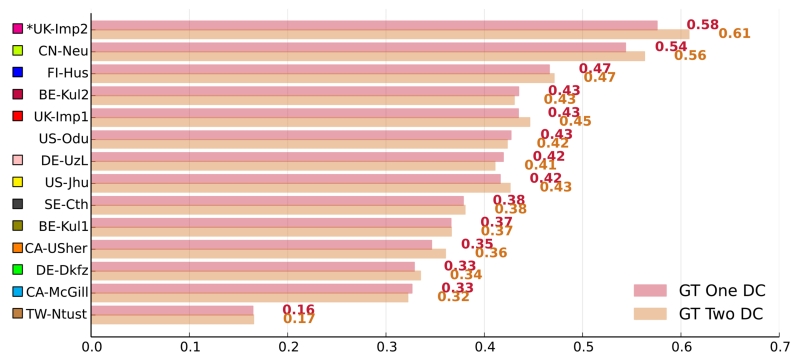
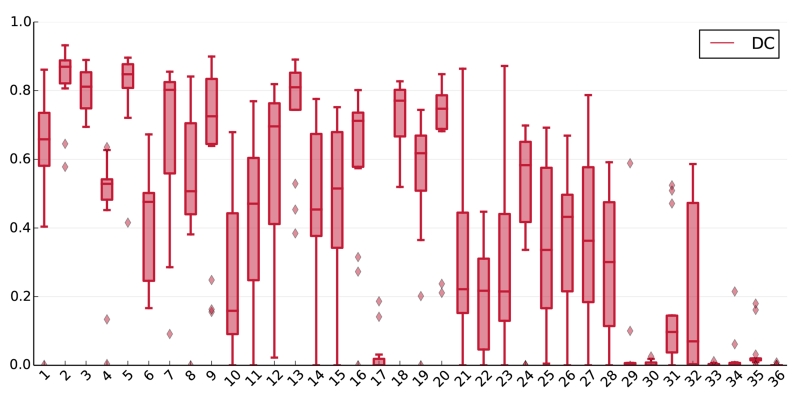
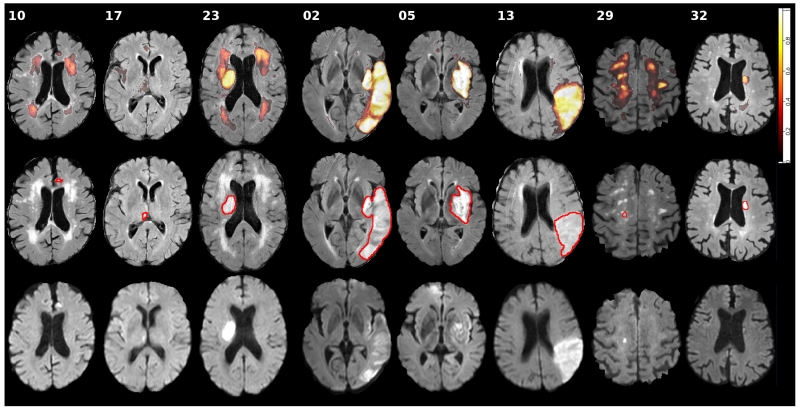
Ischemic stroke is the most common cerebrovascular disease, and its diagnosis, treatment, and study relies on non-invasive imaging. Algorithms for stroke lesion segmentation from magnetic resonance imaging (MRI) volumes are intensely researched, but the reported results are largely incomparable due to different datasets and evaluation schemes. We approached this urgent problem of comparability with the Ischemic Stroke Lesion Segmentation (ISLES) challenge organized in conjunction with the MICCAI 2015 conference. In this paper we propose a common evaluation framework, describe the publicly available datasets, and present the results of the two sub-challenges: Sub-Acute Stroke Lesion Segmentation (SISS) and Stroke Perfusion Estimation (SPES). A total of 16 research groups participated with a wide range of state-of-the-art automatic segmentation algorithms. A thorough analysis of the obtained data enables a critical evaluation of the current state-of-the-art, recommendations for further developments, and the identification of remaining challenges. The segmentation of acute perfusion lesions addressed in SPES was found to be feasible. However, algorithms applied to sub-acute lesion segmentation in SISS still lack accuracy. Overall, no algorithmic characteristic of any method was found to perform superior to the others. Instead, the characteristics of stroke lesion appearances, their evolution, and the observed challenges should be studied in detail. The annotated ISLES image datasets continue to be publicly available through an online evaluation system to serve as an ongoing benchmarking resource (www.isles-challenge.org).

Keywords: Benchmark; Challenge; Comparison; Ischemic stroke; MRI; Segmentation.


Figures

Figure B.11
Figure B.11
Ranking schema as employed in the ISLES challenge.
Figure 1
Figure 1
Increasing count of publications over the years as returned by Google scholar for the search terms ischemic stroke segmentation on 2016-05-17.
Figure 2
Figure 2
Increasing count of challenges over the years as collected on http://grand-challenge.org on 2016-05-17.
Figure 3
Figure 3
Significant differences between the 14 participating methods’ case ranks according to a two-sided Wilcoxon signed-rank test (p < 0.025). Each node represents a team, each edge a significant difference of the tail side team over the head side team. Therefore, the less outgoing and the more incoming edges a team has (denoted by numbers in brackets (#out/#in) for easier interpretation), the weaker its method compared to the others. The saturation of the node colors indicates the strength of a method, where better methods are highlighted with more saturated colors. Note that all teams with the same number of incoming and outgoing edges perform, statistically spoken, equally well. A higher importance of incoming over outgoing edges or vice-versa cannot be readily established.
Figure 4
Figure 4
Adaptation to the data from the second medical center. The graph shows each method’s average DC scores on the 28 cases from the first and the eight cases from the second medical center. The methods are color coded.
Figure 5
Figure 5
Differences in performance on the two ground truth sets. The graph shows each methods average DC scores on the 36 testing dataset cases broken down by ground truth set. A star (*) before a team’s name denotes statistical significant difference according to a paired Student’s t-test with p < 0.05. The methods are color coded.
Figure 6
Figure 6
Box plots of the 14 teams’ DC results on all testing dataset cases, i.e., the first box was computed from all teams’ results on the first case. The band in the box denotes the median, the upper and lower limits the first and third quartile. Outliers are plotted as diamonds.
Figure 7
Figure 7
Visual results for selected difficult (10, 17, 23), easy (2, 5, 13), and second center (29, 32) cases from the SISS testing dataset. The first row shows the distribution of all 14 submitted results on a slice of the FLAIR volume. The second row shows the same image with the ground truth (GT01) outlined in red. And the third row shows the corresponding DWI sequence. Please refer to the online version for colors.
Figure 8
Figure 8
Visualization of significant differences between the 7 participating methods’ case ranks. Each node represents a team, each edge a significant difference of the tail side team over the head side team according to a two-sided Wilcoxon signed-rank test (p < 0.025). Therefore, the less outgoing and the more incoming edges a team has (denoted by numbers in brackets (#out/#in) for easier interpretation), the weaker its method compared to the others. The saturation of the node colors roughly denotes the strength of a method, where better methods are depicted with stronger colors. Note that all teams with the same number of incoming and outgoing edges perform, statistically spoken, equally well.
Figure 9
Figure 9
DC score result of all 7 SPES teams for each of the testing dataset cases. Most methods show a similar pattern. Please refer to the online version for color.
Figure 10
Figure 10
Sequences of some cases with a low (05 and 11) and high (15) average DC score over all 7 teams participating in SPES. The ground truth is painted red into the DWI sequence slices in the first column. The last column shows the distribution of the resulting segmentations on the gray-scale version of the TTP. All perfusion maps are windowed equally for direct comparison. Please refer to the online version for colors.

References

    1. Albers GW, Thijs VN, Wechsler LR, et al. Magnetic resonance imaging profiles predict clinical response to early reperfusion: the diffusion and perfusion imaging evaluation for understanding stroke evolution (DEFUSE) study. Ann. Neurol. 2006;60:508–17. - PubMed
    1. Artzi M, Aizenstein O, Jonas-Kimchi T, et al. FLAIR lesion segmentation: application in patients with brain tumors and acute ischemic stroke. Eur. J. Radiol. 2013;82:1512–8. - PubMed
    1. Avants BB, Epstein C, Grossman M, Gee J. Symmetric diffeomorphic image registration with cross-correlation: Evaluating automated labeling of elderly and neurodegenerative brain. Med. Image Anal. 2008;12:26–41. - PMC - PubMed
    1. Bauer S, Fejes T, Reyes M. A Skull-Stripping Filter for ITK. Insight J. 2013
    1. Breiman L. Random Forests. Mach. Learn. 2001;45:5–32.