. 2016 Aug 10;20(2):202-14.
doi: 10.1016/j.chom.2016.07.001. Epub 2016 Jul 28.

Gut Microbial Metabolites Fuel Host Antibody Responses

Affiliations

Gut Microbial Metabolites Fuel Host Antibody Responses

Myunghoo Kim et al. Cell Host Microbe. .

Abstract

Antibody production is a metabolically demanding process that is regulated by gut microbiota, but the microbial products supporting B cell responses remain incompletely identified. We report that short-chain fatty acids (SCFAs), produced by gut microbiota as fermentation products of dietary fiber, support host antibody responses. In B cells, SCFAs increase acetyl-CoA and regulate metabolic sensors to increase oxidative phosphorylation, glycolysis, and fatty acid synthesis, which produce energy and building blocks supporting antibody production. In parallel, SCFAs control gene expression to express molecules necessary for plasma B cell differentiation. Mice with low SCFA production due to reduced dietary fiber consumption or microbial insufficiency are defective in homeostatic and pathogen-specific antibody responses, resulting in greater pathogen susceptibility. However, SCFA or dietary fiber intake restores this immune deficiency. This B cell-helping function of SCFAs is detected from the intestines to systemic tissues and conserved among mouse and human B cells, highlighting its importance.

Keywords: B cells; antibody; metabolism; short-chain fatty acids.


Figures

Figure 1
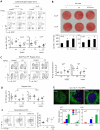
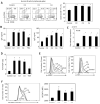
Figure 1. Dietary Fiber Increased IgA and IgG Production
(A) DF increased numbers of IgA+ PCs in the intestinal LP. (B) DF increased numbers of IgA+ GC B cells (B220+GL-7+Fas+) in PP. (C) DF increased numbers of IgA+ cells (B220+IgA+) in MLN and spleen. Mice were fed different levels of DF with or without oral administration with a minimally effective dose of antibiotics (meAbx) for 4-6 weeks. (D) DF increased Ig levels in the serum and cecal contents. (E) DF increased the frequency of IgA-coated bacteria in the colon. The data were from three independent experiments (n=6–11). Error bars indicate SEM. Significant differences from control or LFD* or MFD** groups. See also Figures S1A–G.
Figure 2
Figure 2. SCFAs Increase Intestinal Antibody Responses
(A) C3 increased the frequencies of IgA+ PCs in intestinal LP of regular chow-fed mice. (B) C3 alone (80mM) or a SCFA mixture (C2: 70mM; C3: 30mM; and C4: 20mM) increased IgA-secreting intestinal LP cells (ASCs) in LFD-fed mice. ASCs were identified with an ELISPOT assay. (C) C3 increased numbers of IgA+ GC B cells in PP. (D) C3 increased numbers of Tfh cells (CD4+CXCR5+PD-1+) in PP and MLN. (E) C3 or HFD treatment promoted AID expression and Ig clsass switch in PP. AID expression in PP was examined by immunohistochemistry. Expressions of Aicda and αCT mRNA in cells of indicated organs were examined by qRT-PCR. (F) C3 or SCFA feeding increased the frequency of IgA-coated fecal bacteria in the colon of LFD mice. The average frequency of isotype antibody-coated bacteria in SCFA-fed mice was ~2%. Mice were fed with indicated diet or water for 5–6 weeks. The data were from 2-3 experiments (n=6–13). Error bars indicate SEM. *Significant differences from control or LFD groups. See also Figures S2A–F.
Figure 3
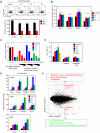
Figure 3. Effects of SCFAs on in vitro B cell Differentiation, HDAC Activity, and Gene Expression
(A) SCFAs increased B cell differentiation to IgA-expressing cells. (B) SCFAs increased B cell differentiation to IgG-expressing cells. B cells were cultured for 6 days in Ig isotype-specific conditions: LPS and IL-4 for IgG1; LPS and IFN-γ for IgG2a; LPS and TGFβ1 for IgG2b; LPS alone for IgG3; LPS, TGFβ1, IL-5, IL-6 and RA for IgA-inducing conditions. (C) SCFAs inhibit HDAC activity in B cells. B cells were examined for HDAC activity after a 2-day culture with SCFAs (long term suppression) or first cultured for 2 days without SCFAs but measured after 2 h incubation with SCFAs. (D) HDAC or HAT inhibitors (TSA as an HDAC inhibitor; garcinol and anacardic acid for HAT inhibitors) reciprocally regulate IgA responses. (E) SCFAs induced histone acetylation on the Aicda gene and the switch regions of the Ig heavy chain genes. A ChIP assay to assess H3 acetylation was performed for the conserved regulatory sequences of the Aicda gene and the switch regions of Ig genes. (F) C2 regulates gene expression in B cells. A microarray study was performed for B cells cultured in the presence and absence of C2 for 5 days. The functional gene groups regulated by C2 were identified with the Database for Annotation, Visualization and Integrated Discovery (DAVID) v6.7. Average data from two array experiments are shown. Spleen CD19+ IgA IgG (A, B, D) or total (C, E, F) B cells were used. The data were from 3–4 experiments and combined data with SEM (n=3-6) are shown. *Significant differences from control groups. See also Figures S3 and S4.
Figure 4
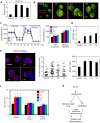
Figure 4. SCFAs Increase Mitochondrial Energy Production and Fatty Acid Content in B cells
(A) SCFAs increased cellular acetyl-CoA levels in B cells. (B) SCFAs increased mitochondrial mass in B cells. B cells were stained with MitoTracker Green. (C) SCFAs increased mitochondrial respiration in B cells. Mitochondrial activity based on oxygen consumption rate (OCR) was measured with a Seahorse real-time metabolic analyzer (Oligo: Oligomycin; RO/AA: rotenone/antimycin A). (D) SCFAs increased cellular ATP/ADP ratio. (E) SCFAs increased lipid droplets in B cells. Shown are confoal images of lipid droplets stained with BODIPY and numbers of lipid droplets along with BODIPY fluorescent intensity (MFI) in SCFA-treated B cells. (F) Effects of fatty acid synthesis inhibitors (C75 for fatty acid synthase and TOFA for Acetyl-CoA carboxylase) on SCFA-induced IgA expression. (G) A summary diagram for the observed function of SCFAs in regulation of acetyl-CoA metabolism in B cells. Spleen total CD19+ (A–D) or IgA IgG (E, F) B cells were cultured for 2-3 (A–E) or 6 (F) days in an IgA-inducing condition (LPS, TGFβ1, IL-5, IL-6 and RA) for all experiments. The data were from 3–5 in vitro experiments, and combined data with SEM (n=3-6) are shown. Error bars indicate SEM. *Significant differences (P < 0.05) from control groups. See also Figures S5A–D.
Figure 5
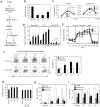
Figure 5. SCFAs Increase mTOR Activiation and Glycolysis to Support Antibody Production
(A) A potential impact of SCFAs on AMP levels, mTOR activation, and glycolysis in B cells. (B) SCFAs decreased cellular AMP levels in B cells. (C) Changes of mTOR (p-rS6 protein) and AMPK (p-AMPK) activity in SCFA-treated B cells. (D) SCFA increased [3-3H]-glucose uptake. (E) SCFAs increased glycolysis in B cells undergoing activation. Extracellular acidification rate (ECAR) was measured with a Seahorse real-time metabolic analyzer. (F) Forced oxidative phosphorylation with galactose abolished the SCFA effect on B cells. B cells were cultured with indicated SCFAs in glucose-free medium in the presence of glucose or galactose (10 mM). (G) AMPK activation abolished the SCFA effect on mTOR activation. (H) Rapamycin and metformin abolished the SCFA effect on IgA production. (I) Rapamycin and metformin decreased SCFA-induced B cell proliferation. Unless indicated otherwise, B cells were cultured for 2-3 days in panel B, D, E, G and I, and 5–7 days in panel F and H in an IgA-inducing condition (LPS, TGFβ1, IL-5, IL-6 and RA). Glu: glucose; Oligo:oligomycin; 2-DG: 2-deoxy-D-glucose. Spleen CD19+ IgA IgG (B, G) or total (C–F, H, I) B cells were used. The data were from 4-6 in vitro experiments and combined data with SEM (n=4-6) are shown. Error bars indicate SEM. *Significant differences (P < 0.05) from control groups. See also Figures S5E–G.
Figure 6
Figure 6. SCFAs Increase Ig Production by Human B cells
(A) SCFAs increased the numbers of CD20CD38+ human plasma B cells. (B) SCFAs increased IgA and IgG production. (C) SCFAs induced the expression of the human Aicda gene. (D) SCFAs increased the cellular ATP/ADP ratio. (E) SCFAs suppressed AMPK and enhanced mTOR activation in B cells. (F) SCFAs increased lipid content in B cells. B cells were cultured for 3 (C–F) or 6-7 (A, B) days with anti-CD40 and the cytokines described in the supplemental information. Tonsil naïve (A, F) or total (B–E) B cells were used. The data were from 3-6 in vitro experiments and combined data with SEM (n=3-6) are shown. *Significant differences (P < 0.05) from control groups.
Figure 7
Figure 7. SCFAs Increase Antibody Responses During Infection
(A) DF enhanced the clearance of C. rodentium. (B) DF enhanced GC formation in PP following infection. (C) DF increased IgA+ B cells in intestinal LP. A total lymphocyte gate was used for flow cytometry. (D) DF increased OVA-specific Ig responses to C. rodentium-OVA. Luminal and serum OVA-specific IgG and IgA levels were measured by ELISA. (E) C3 administration enhanced anti-C. rodentium immunity in LFD, but not HFD, mice. C3 effects on weight change and stool consistency score were measured. (F) Impact of C3 and/or DF on C. rodentium burden. Mice on LFD or HFD diet were fed regular or C3 drinking water (80 mM) for 4 weeks and infected with C. rodentium-OVA. The data were from 2–4 in vivo experiments (n=7–13). Significant differences from LFD* or MFD** groups. See also Figure S7.

Comment in

Similar articles

Cited by

References

    1. Abreu MT. Toll-like receptor signalling in the intestinal epithelium: how bacterial recognition shapes intestinal function. Nature reviews Immunology. 2010;10:131–144. - PubMed
    1. Aldrich MB, Chen W, Blackburn MR, Martinez-Valdez H, Datta SK, Kellems RE. Impaired germinal center maturation in adenosine deaminase deficiency. Journal of immunology. 2003;171:5562–5570. - PubMed
    1. Alexander KL, Targan SR, Elson CO., 3rd Microbiota activation and regulation of innate and adaptive immunity. Immunological reviews. 2014;260:206–220. - PMC - PubMed
    1. Arpaia N, Campbell C, Fan X, Dikiy S, van der Veeken J, deRoos P, Liu H, Cross JR, Pfeffer K, Coffer PJ, et al. Metabolites produced by commensal bacteria promote peripheral regulatory T-cell generation. Nature. 2013;504:451–455. - PMC - PubMed
    1. Belkaid Y, Hand TW. Role of the microbiota in immunity and inflammation. Cell. 2014;157:121–141. - PMC - PubMed

MeSH terms