

The Environmental Legacy of Modern Tropical Deforestation
- PMID: 27476593
- PMCID: PMC5004800
- DOI: 10.1016/j.cub.2016.06.013
The Environmental Legacy of Modern Tropical Deforestation
Abstract
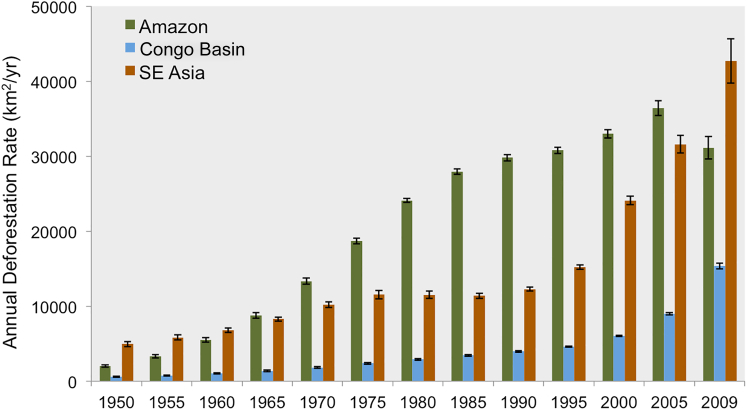
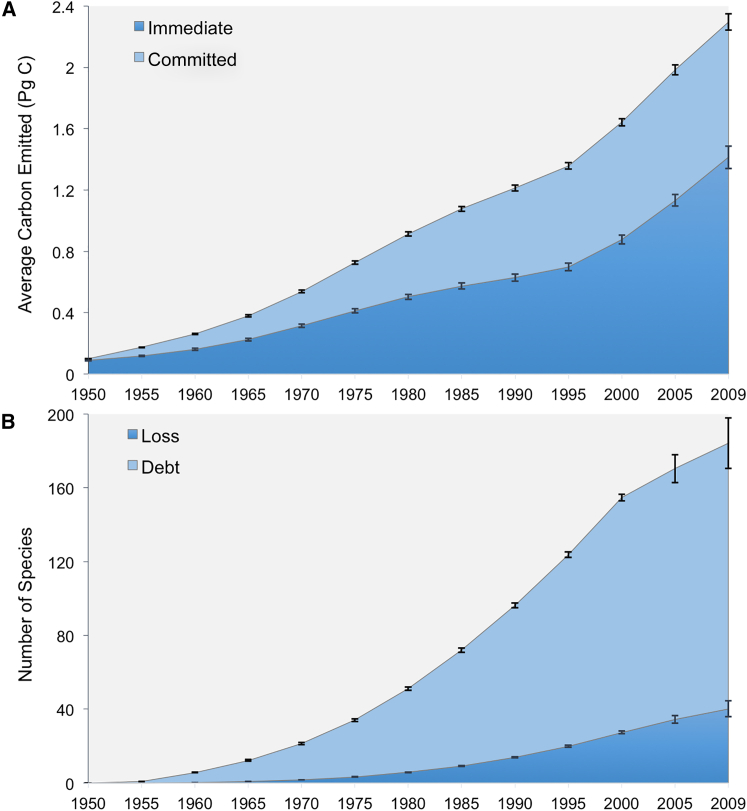
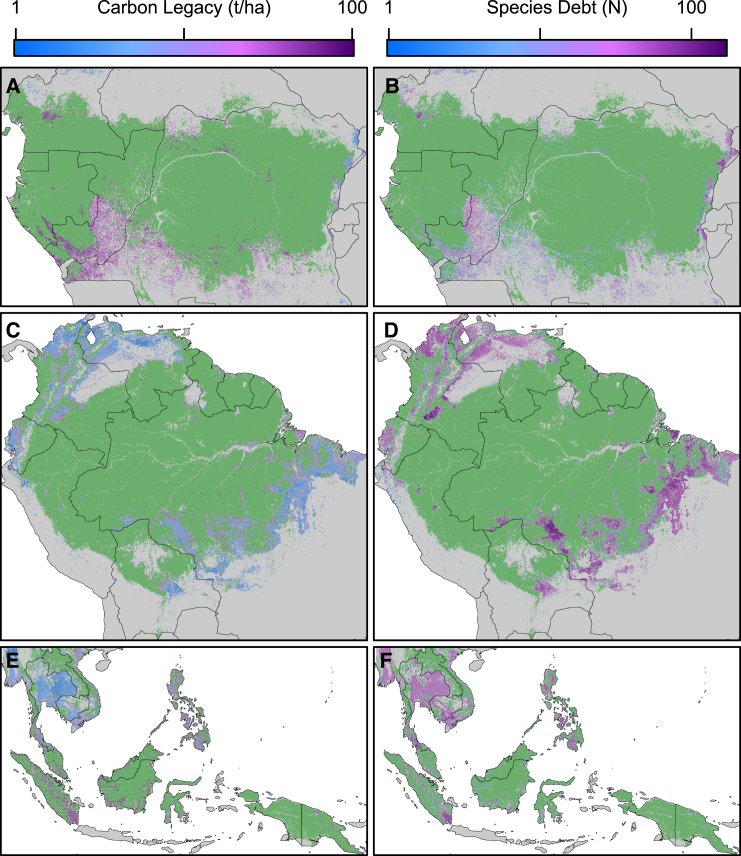
Tropical deforestation has caused a significant share of carbon emissions and species losses, but historical patterns have rarely been explicitly considered when estimating these impacts [1]. A deforestation event today leads to a time-delayed future release of carbon, from the eventual decay either of forest products or of slash left at the site [2]. Similarly, deforestation often does not result in the immediate loss of species, and communities may exhibit a process of "relaxation" to their new equilibrium over time [3]. We used a spatially explicit land cover change model [4] to reconstruct the annual rates and spatial patterns of tropical deforestation that occurred between 1950 and 2009 in the Amazon, in the Congo Basin, and across Southeast Asia. Using these patterns, we estimated the resulting gross vegetation carbon emissions [2, 5] and species losses over time [6]. Importantly, we accounted for the time lags inherent in both the release of carbon and the extinction of species. We show that even if deforestation had completely halted in 2010, time lags ensured there would still be a carbon emissions debt of at least 8.6 petagrams, equivalent to 5-10 years of global deforestation, and an extinction debt of more than 140 bird, mammal, and amphibian forest-specific species, which if paid, would increase the number of 20(th)-century extinctions in these groups by 120%. Given the magnitude of these debts, commitments to reduce emissions and biodiversity loss are unlikely to be realized without specific actions that directly address this damaging environmental legacy.
Keywords: carbon debt; species extinction debt; time lags; tropical deforestation.
Copyright © 2016 The Authors. Published by Elsevier Ltd.. All rights reserved.
Figures

Comment in
-
Ecology: The Tropical Deforestation Debt.Curr Biol. 2016 Aug 22;26(16):R770-2. doi: 10.1016/j.cub.2016.06.039. Curr Biol. 2016. PMID: 27554658
Similar articles
-
Ecology: The Tropical Deforestation Debt.Curr Biol. 2016 Aug 22;26(16):R770-2. doi: 10.1016/j.cub.2016.06.039. Curr Biol. 2016. PMID: 27554658
-
Determination of tropical deforestation rates and related carbon losses from 1990 to 2010.Glob Chang Biol. 2014 Aug;20(8):2540-54. doi: 10.1111/gcb.12605. Epub 2014 May 30. Glob Chang Biol. 2014. PMID: 24753029 Free PMC article.
-
Tropical forests and the changing earth system.Philos Trans R Soc Lond B Biol Sci. 2006 Jan 29;361(1465):195-210. doi: 10.1098/rstb.2005.1711. Philos Trans R Soc Lond B Biol Sci. 2006. PMID: 16553317 Free PMC article. Review.
-
Annual Carbon Emissions from Deforestation in the Amazon Basin between 2000 and 2010.PLoS One. 2015 May 7;10(5):e0126754. doi: 10.1371/journal.pone.0126754. eCollection 2015. PLoS One. 2015. PMID: 25951328 Free PMC article.
-
Agricultural expansion and its impacts on tropical nature.Trends Ecol Evol. 2014 Feb;29(2):107-16. doi: 10.1016/j.tree.2013.12.001. Epub 2013 Dec 30. Trends Ecol Evol. 2014. PMID: 24388286 Review.
Cited by
-
Oil palm cultivation critically affects sociality in a threatened Malaysian primate.Sci Rep. 2021 May 14;11(1):10353. doi: 10.1038/s41598-021-89783-3. Sci Rep. 2021. PMID: 33990658 Free PMC article.
-
Scale and context dependency of deforestation drivers: Insights from spatial econometrics in the tropics.PLoS One. 2020 Jan 29;15(1):e0226830. doi: 10.1371/journal.pone.0226830. eCollection 2020. PLoS One. 2020. PMID: 31995574 Free PMC article.
-
Regional scalable priorities for national biodiversity and carbon conservation planning in Asia.Sci Adv. 2021 Aug 26;7(35):eabe4261. doi: 10.1126/sciadv.abe4261. Print 2021 Aug. Sci Adv. 2021. PMID: 34446433 Free PMC article.
-
Land-use trajectories for sustainable land system transformations: Identifying leverage points in a global biodiversity hotspot.Proc Natl Acad Sci U S A. 2022 Feb 15;119(7):e2107747119. doi: 10.1073/pnas.2107747119. Proc Natl Acad Sci U S A. 2022. PMID: 35165148 Free PMC article.
-
Is the EU shirking responsibility for its deforestation footprint in tropical countries? Power, material, and epistemic inequalities in the EU's global environmental governance.Sustain Sci. 2023;18(2):599-616. doi: 10.1007/s11625-023-01302-7. Epub 2023 Feb 18. Sustain Sci. 2023. PMID: 36845358 Free PMC article.
References
-
- Ramankutty N., Gibbs H.K., Achard F., Defries R., Foley J.A., Houghton R.A. Challenges to estimating carbon emissions from tropical deforestation. Glob. Change Biol. 2007;13:51–66.
-
- Houghton R.A., Skole D.L., Nobre C.A., Hackler J.L., Lawrence K.T., Chomentowski W.H. Annual fluxes of carbon from deforestation and regrowth in the Brazilian Amazon. Nature. 2000;403:301–304. - PubMed
-
- Smith M.J., Vanderwel M.C., Lyutsarev V., Emmott S., Purves D. The climate dependence of the terrestrial carbon cycle; including parameter and structural uncertainties. Biogeosciences. 2013;10:583–606.
Publication types
MeSH terms
Substances
LinkOut - more resources
Full Text Sources
Other Literature Sources
Molecular Biology Databases
