. 2016 Aug 4;99(2):299-317.
doi: 10.1016/j.ajhg.2016.06.008. Epub 2016 Jul 28.

Loss-of-Function Mutations in ELMO2 Cause Intraosseous Vascular Malformation by Impeding RAC1 Signaling

Affiliations

Loss-of-Function Mutations in ELMO2 Cause Intraosseous Vascular Malformation by Impeding RAC1 Signaling

Arda Cetinkaya et al. Am J Hum Genet. .

Abstract

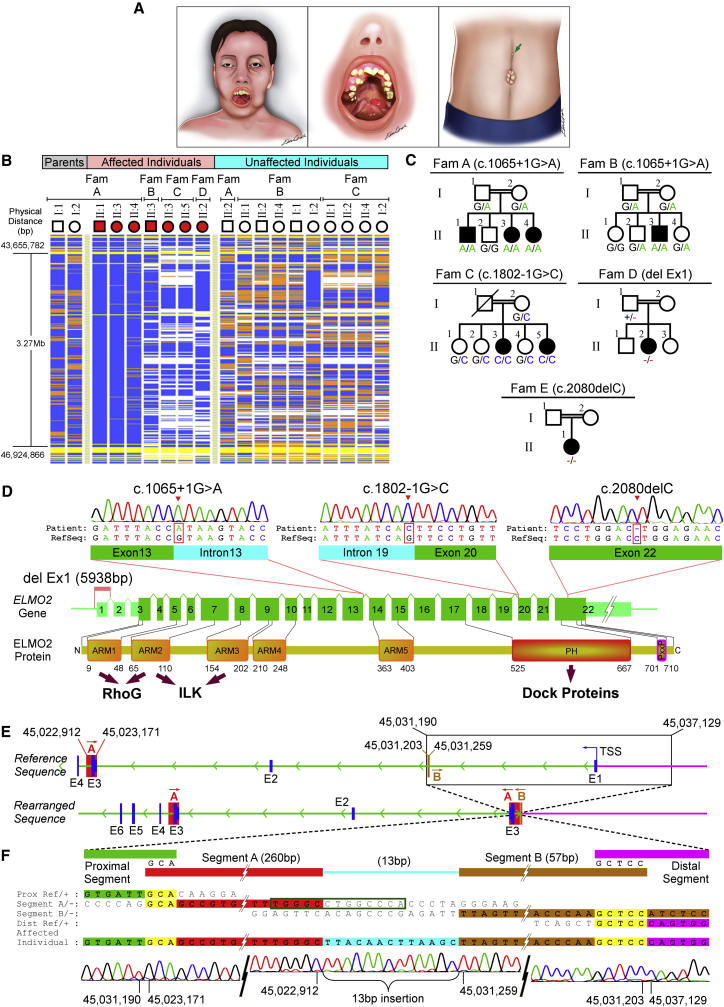
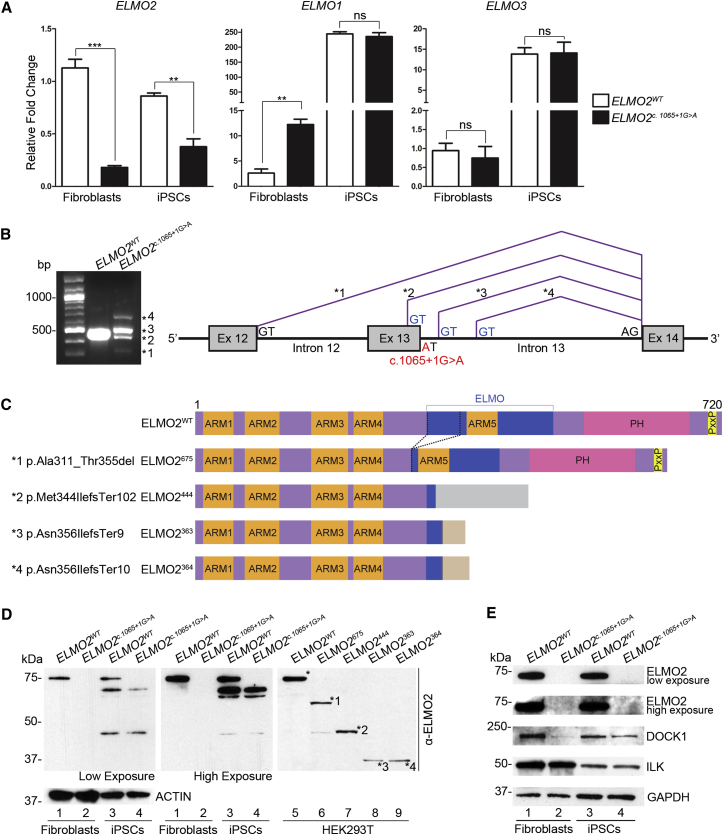
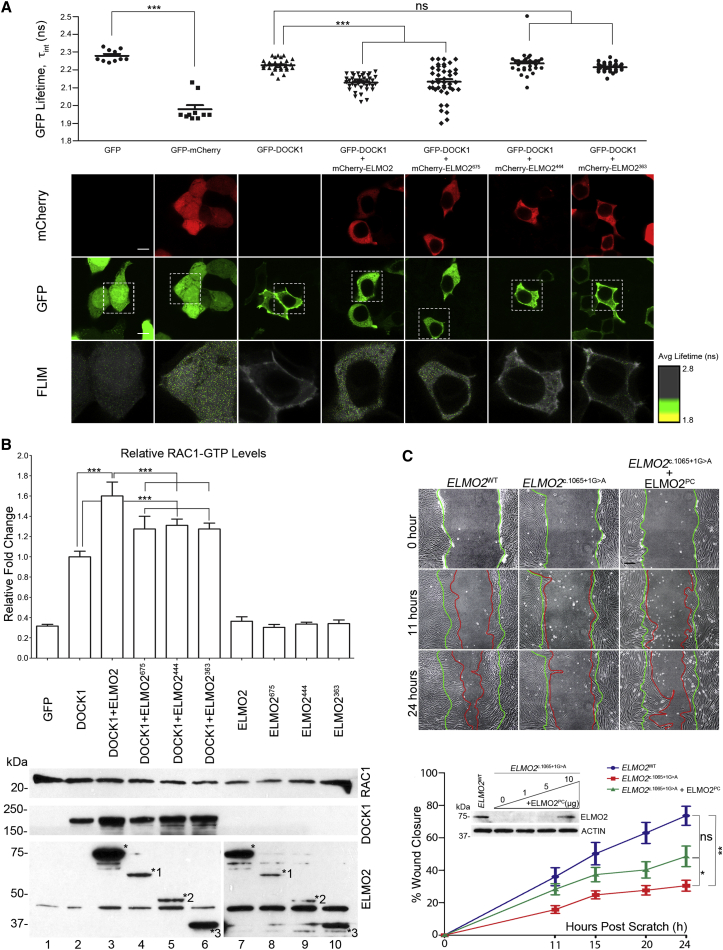
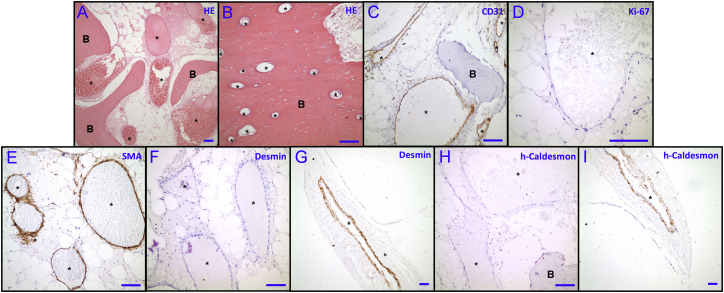
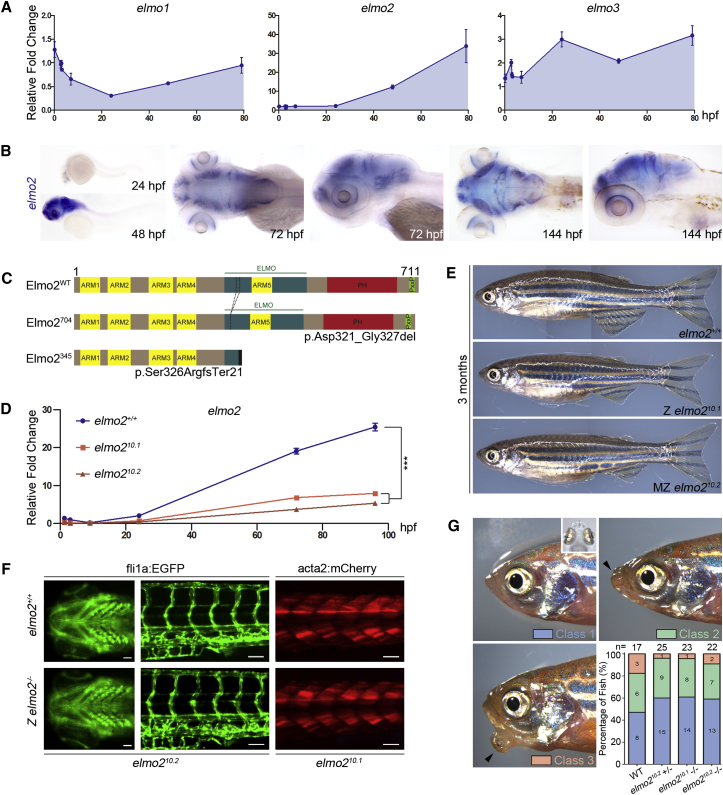
Vascular malformations are non-neoplastic expansions of blood vessels that arise due to errors during angiogenesis. They are a heterogeneous group of sporadic or inherited vascular disorders characterized by localized lesions of arteriovenous, capillary, or lymphatic origin. Vascular malformations that occur inside bone tissue are rare. Herein, we report loss-of-function mutations in ELMO2 (which translates extracellular signals into cellular movements) that are causative for autosomal-recessive intraosseous vascular malformation (VMOS) in five different families. Individuals with VMOS suffer from life-threatening progressive expansion of the jaw, craniofacial, and other intramembranous bones caused by malformed blood vessels that lack a mature vascular smooth muscle layer. Analysis of primary fibroblasts from an affected individual showed that absence of ELMO2 correlated with a significant downregulation of binding partner DOCK1, resulting in deficient RAC1-dependent cell migration. Unexpectedly, elmo2-knockout zebrafish appeared phenotypically normal, suggesting that there might be human-specific ELMO2 requirements in bone vasculature homeostasis or genetic compensation by related genes. Comparative phylogenetic analysis indicated that elmo2 originated upon the appearance of intramembranous bones and the jaw in ancestral vertebrates, implying that elmo2 might have been involved in the evolution of these novel traits. The present findings highlight the necessity of ELMO2 for maintaining vascular integrity, specifically in intramembranous bones.


Figures

Figure 1
Figure 1
Identification of the ELMO2 Mutations that Cause VMOS (A) Illustration of the morphological VMOS findings. Maxillomandibular enlargement is evident, both extraorally and intraorally. Facial asymmetry due to bone enlargement is shown on the left. Exophthalmos and loss of vision usually accompany the disease in later stages. Ectopic eruption, impaction, and displacement of the teeth, as well as severe alveolar bone expansion are common findings in intraoral examination (middle). Supraumbilical raphe (green arrow) and umbilical hernia are the primary extraosseous findings in VMOS (right). (B) Homozygosity mapping via VIGENOS showed a 3.27 Mbp candidate region in chromosome 20q13. Homozygous genotypes identical to the genotype data obtained from the affected individual A-II:1 are shown in blue. Contrasting homozygote genotypes are shown in white, whereas heterozygous genotypes appear in orange. Non-informative genotypes resulting from heterozygous SNPs in parent-child trios are shown in yellow. Note that all affected individuals are homozygous for the candidate region; however, each of the four families have a different haplotype for this interval. (C) Pedigrees of families A–E. Mutations found in ELMO2 are shown for each family and the genotypes for the corresponding mutation are indicated below each individual whose DNA samples were available. (D) Schematic representation of homozygous ELMO2 mutations co-segregating with VMOS in the five families. ELMO2 contains a total of 22 exons (green boxes). The untranslated regions of the exons are denoted with smaller light green boxes. In families A and B, the c.1065+1G>A mutation substitutes the first nucleotide of the 13th intron in the splice donor site. In family C, the c.1802−1G>C mutation substitutes the last nucleotide of the 19th intron in the splice acceptor site. In family D, a complex rearrangement involving a 5,938 bp deletion removes the first exon of ELMO2. In family E, the c.2080delC mutation deletes one cytosine, which leads to a frameshift predicted to produce a longer protein. Below is a schematic representation of the ELMO2. ELMO2 protein domains are linked by arrows to their interacting proteins. Abbreviations are as follows: ARM, Armadillo repeat; PH, pleckstrin homology domain; PxxP, proline-rich motif. (E) Complex rearrangement schematized on the genomic sequence. The upper line illustrates the 5′ end of wild-type ELMO2. The exons are shown as blue boxes, and segments A and B, which represent inserted segments in the complex rearrangement (see Figure S1A), are shown as red and light brown boxes, respectively. The green arrowheads indicate the direction of transcription. The black rectangle shows the deleted portion of the genome. Abbreviation: TSS, transcription start site. The bottom line shows the rearranged sequence. Note that inserted sequences A and B are in reverse orientation (inverted). Genomic positions are indicated where applicable. (F) Enlarged view of the complex rearrangement region. The upper part represents the sequence alignment of the breakpoint junctions, showing the homology with four genomic regions, namely proximal segment (green) (centromeric end of the breakpoint), inverted segment A (red), inverted segment B (light brown), and distal segment (purple) (telomeric end of the breakpoint). Two of the breakpoint junctions share 3-bp- and 5-bp-long microhomology sequences (shown in yellow), whereas a 13-bp-long joining segment shown in blue joins segments A and B. Nucleotide sequences homologous to RefSeq are depicted in bold. The green box is a 13-bp-long inverted repeat sequence at the breakpoint junction of segment A. The lower part shows the corresponding Sanger sequences for the three breakpoint junctions. The genomic positions of the nucleotides in RefSeq are indicated below the electropherogram. Also see Figure S2 for details.
Figure 2
Figure 2
The ELMO2 c.1065+1G>A Splice Mutation Behaves as a Loss-of-Function Allele (A) By quantitative PCR, total ELMO2 transcript levels were significantly lower in the fibroblasts and iPSCs of affected individual A-II:3 than in those of control subject A-II:2. ELMO1 transcript levels were significantly upregulated in the affected individual’s fibroblasts, as compared to control subject, but not in iPSCs. ELMO3 transcript levels were the same in fibroblasts and iPSCs of affected and control subjects. Data are shown as mean ± SEM, unpaired two-tailed t test. ∗∗p ≤ 0.01; ∗∗∗p ≤ 0.001; ns: p ≥ 0.05. (B) RT-PCR analysis of ELMO2 cDNA flanking the splice mutation site shows the presence of at least four alternatively spliced transcripts in affected individual A-II:3’s fibroblasts, as compared to control subject A-II:2 (left). Schematic diagram of corresponding activated cryptic splice donor sites deduced via cloning and sequencing of ELMO2 ORF from affected individual’s cDNA (right). (C) Schematic diagram of mutant ELMO2 proteins derived from affected individual A-II:3’s alternatively spliced transcripts, as compared to full-length wild-type ELMO2 (720 amino acids). Abbreviations are as follows: ARM, Armadillo repeat; ELMO, ELMO domain; PH, pleckstrin homology domain; PxxP, proline-rich motif. (D) Western blot analysis shows that affected individual A-II:3’s fibroblasts and iPSCs do not express wild-type ELMO2 (75 kDa), as compared to control cells. Mutant ELMO2 proteins are not detected, either. Lanes 1 to 4: endogenous protein from affected and control fibroblasts and iPSCs were probed using a mouse monoclonal antibody against ELMO2, with high and low exposures shown. Lanes 3 and 4: multiple smaller bands in iPSC lysates are probably non-specific proteins. Lanes 6 to 9: cloned affected individual’s transcripts were overexpressed in HEK293T cells to show the size of the mutant ELMO2 in comparison to wild-type ELMO2 (lane 5). Asterisks () on the western blot indicate wild-type and mutant ELMO2 (numbered asterisks). The same α-ELMO2 antibody was used for detection. (E) Endogenous protein (ELMO2, DOCK1, and ILK) levels in affected individual A-II:3’s and control subject A-II:2’s fibroblasts and iPSCs. The DOCK1 level was significantly reduced in affected fibroblasts and to a lesser extent in iPSCs. ILK levels were the same between affected and control subjects. GAPDH was used as the loading control.
Figure 3
Figure 3
Functional Analysis of ELMO2 Mutant Proteins (A) FLIM analysis shows that wild-type ELMO2 interacts stably with DOCK1, but the mutants ELMO2444 and ELMO2363 do not. The mutant ELMO2675 can also interact with DOCK1, but does so in an unstable fashion. The GFP-mCherry fusion protein served as a positive control. Data represented as a scatter dot plot, with mean ± SEM, one-way ANOVA with Bonferroni’s multiple comparison test, ∗∗∗p ≤ 0.001. Dotted white box in each GFP image represents an enlarged version of the corresponding FLIM image. Scale bar represents 10 μm. Bottom: Representative immunofluorescence images show co-localization of DOCK1 and ELMO2 proteins at the plasma membrane and in the cytoplasm. (B) G-LISA RAC1 activation assay showed that wild-type ELMO2 significantly enhanced RAC1 activation in the presence of DOCK1. Muteins ELMO2675, ELMO2444, and ELMO2363 significantly decreased this activation but did not abrogate it. Data are shown as mean ± SD, one-way ANOVA with Bonferroni’s multiple comparison test. ∗∗∗p ≤ 0.001. Asterisks () on the western blot indicate wild-type and mutant ELMO2 (numbered asterisks). (C) Affected individual A-II:3’s fibroblasts migrated significantly slower than control fibroblasts in scratch wound assays. This defect was partially rescued by re-expressing exogenous ELMO2 at a level equal to that in control A-II:2’s fibroblasts (western blot inset). Green lines on brightfield images represent wound edge at T0. Red lines represent new wound edge over time. Data are shown as mean ± SEM, two-way ANOVA with Bonferroni post-test. p ≤ 0.05; ∗∗p ≤ 0.01. Scale bar represents 200 μm.
Figure 4
Figure 4
Histopathological and Immunohistochemical Examination of Affected Tissues (A and B) Cross-section H&E staining of (A) diseased mandible and (B) normal fibula tissue obtained from affected individual A-II:3. (C–I) Cross-section of diseased mandible stained from same individual by (C) anti-CD31, (D) anti-Ki-67, (E) anti-SMA, (F, G) anti-desmin, and (H, I) anti-h-caldesmon. (G and I) Cross-sections from the neighboring tissue with normal blood vessels and serve as positive controls for the immunohistochemistry in (F) and (H). Symbols: B, bone; , blood vessel lumens. Scale bars in each panel represent 100 μm.
Figure 5
Figure 5
elmo2 Knockout Zebrafish Develop Normally to Adulthood (A) By quantitative PCR, elmo2 is expressed 24 hpf and onward, whereas elmo1 and elmo3 appear to be both maternally and zygotically expressed. Data are shown as mean ± SEM. (B) By WISH, elmo2 is expressed predominantly in the brain and craniofacial structures, including the upper and lower rhombic lips of the hindbrain, the mid-cerebral vein, optic tectum, olfactory bulbs, and the retinal ganglion layer. (C) Schematic diagram of zebrafish wild-type Elmo2 and mutants derived from allelic series of elmo2 knockouts. Elmo2704 (p.Asp321_Gly327del) corresponds to the elmo221 (c.961_981del) allele, and Elmo2345 (p.Ser326Argfs21) corresponds to both the elmo210.1 (c.975_984del) and elmo210.2 (c.969_978del) alleles. Abbreviations are as follows: ARM, Armadillo repeat; ELMO, ELMO domain; PH, pleckstrin homology domain; PxxP, proline-rich motif. (D) Quantitative PCR shows significantly lower levels of elmo2 transcripts in MZ homozygous elmo210.1 and elmo210.2 fish, as compared to matched elmo2+/+ controls from 0 to 96 hpf. Data are shown as mean ± SEM, two-way ANOVA with Bonferroni posttest. ∗∗∗p ≤ 0.001. (E) Both zygotic elmo210.1 and maternal-zygotic elmo210.2 homozygous fish develop normally to fertile adults, without a gross discernible phenotype. (F) Normal blood vessel development in the pharyngeal arches and trunk at 5 dpf in elmo210.2 homozygous fish carrying the fli1a:EGFP transgene is shown. Fish homozygous for elmo210.1 carrying the acta2:mCherry transgene show normal visceral smooth muscle cells at 6 dpf. Scale bars represent 0.1 μm. (G) Based on evaluation of jaw morphology in a jaw injury assay, elmo2 is not required for proper jaw healing in adult zebrafish. Class 1 is defined by complete jaw healing. Class 2 fish have slight jaw defects marked by small gaps (black arrowhead). Class 3 fish have gross jaw deformities and protrusions (black arrowhead). Top right-side inset on class 1 indicates axis of injury.

Similar articles

Cited by

References

    1. Helker C.S., Schuermann A., Pollmann C., Chng S.C., Kiefer F., Reversade B., Herzog W. The hormonal peptide Elabela guides angioblasts to the midline during vasculogenesis. eLife. 2015;4:e06726. - PMC - PubMed
    1. Conway E.M., Collen D., Carmeliet P. Molecular mechanisms of blood vessel growth. Cardiovasc. Res. 2001;49:507–521. - PubMed
    1. Mulliken J.B., Glowacki J. Hemangiomas and vascular malformations in infants and children: a classification based on endothelial characteristics. Plast. Reconstr. Surg. 1982;69:412–422. - PubMed
    1. Bruder E., Perez-Atayde A.R., Jundt G., Alomari A.I., Rischewski J., Fishman S.J., Mulliken J.B., Kozakewich H.P. Vascular lesions of bone in children, adolescents, and young adults. A clinicopathologic reappraisal and application of the ISSVA classification. Virchows Arch. 2009;454:161–179. - PubMed
    1. Wassef M., Blei F., Adams D., Alomari A., Baselga E., Berenstein A., Burrows P., Frieden I.J., Garzon M.C., Lopez-Gutierrez J.C., ISSVA Board and Scientific Committee Vascular anomalies classification: recommendations from the International Society for the Study of Vascular Anomalies. Pediatrics. 2015;136:e203–e214. - PubMed

Publication types

MeSH terms