. 2016 Jul 20;91(2):453-66.
doi: 10.1016/j.neuron.2016.06.005.

The Rhesus Monkey Connectome Predicts Disrupted Functional Networks Resulting from Pharmacogenetic Inactivation of the Amygdala

Affiliations

The Rhesus Monkey Connectome Predicts Disrupted Functional Networks Resulting from Pharmacogenetic Inactivation of the Amygdala

David S Grayson et al. Neuron. .

Abstract

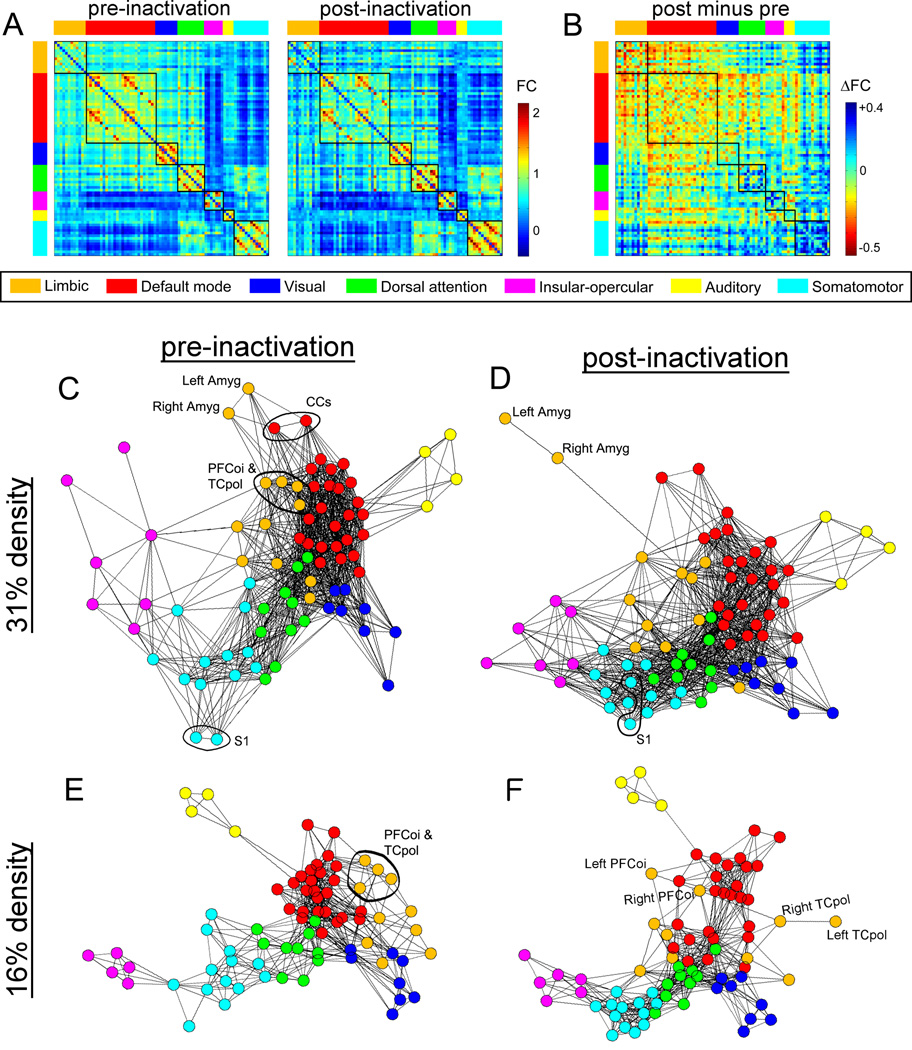
Contemporary research suggests that the mammalian brain is a complex system, implying that damage to even a single functional area could have widespread consequences across the system. To test this hypothesis, we pharmacogenetically inactivated the rhesus monkey amygdala, a subcortical region with distributed and well-defined cortical connectivity. We then examined the impact of that perturbation on global network organization using resting-state functional connectivity MRI. Amygdala inactivation disrupted amygdalocortical communication and distributed corticocortical coupling across multiple functional brain systems. Altered coupling was explained using a graph-based analysis of experimentally established structural connectivity to simulate disconnection of the amygdala. Communication capacity via monosynaptic and polysynaptic pathways, in aggregate, largely accounted for the correlational structure of endogenous brain activity and many of the non-local changes that resulted from amygdala inactivation. These results highlight the structural basis of distributed neural activity and suggest a strategy for linking focal neuropathology to remote neurophysiological changes.


Figures

Figure 1
Figure 1. Overview of experimental procedures and network analyses
A–C) Procedures for experimentally inactivating the amygdala and assessing functional changes across the brain. A) First, the amygdala (labeled in red) was transfected with a viral vector construct containing the inhibitory DREADD gene hM4Di. The DREADD ligand, CNO, selectively deactivates DREADD-transfected cells when administered peripherally. B) Second, rs-fcMRI scans were acquired on each animal six to twelve months later. One scan was acquired using CNO injection i.v. and the other with saline i.v. Scans are divided into 5 consecutive 12-minute blocks with injections performed between the first and second block. C) Third, functional connectomes are built for each block using the RM parcellation scheme. Connectomes comprise pairwise Pearson correlations (z-transformed) between timeseries of all region pairs, illustrated as a whole-brain network. This allows assessment of baseline functional connectivity (FC) or FC change due to CNO injection relative to saline (ΔFC). D–E) Procedures for predicting ΔFC across the brain. D) SC connectome is obtained from the CoCoMac database of tract-tracer data. Communicability across all node pairs of the SC connectome is used as a predictor for baseline FC. E) Simulated lesion (disconnection) of the amygdala generates changes in communicability across all node pairs of the connectome. Change in communicability is used as a predictor of ΔFC.
Figure 2
Figure 2. Histological evaluation of DREADD expression
Photomicrographs of representative coronal sections through the amygdala in cases M2 (A–E) which had the lowest level of neuronal transfection within the amygdala and M1 (F–J) which had the highest level of transfection in the amygdala illustrating the overall distribution of hM4Di-mCherry immunoreactivity. Sections are ordered from most rostral (A and F) to most caudal (E and J). Each immunohistochemically stained section (A–J) is displayed next to an adjacent section stained by the Nissl method (A’-J’). The location of the amygdala (A), caudate nucleus (Cd) enothrinal cortex (EC), claustrum (Cl) and anterior commissure (ac) are indicated in some of the sections. The syringe needle track is indicated for case M2 by arrows. Slight leakage and cellular labeling is indicated in the caudate nucleus of both cases (asterisks). In panel J, the entorhinal cortex is indicated (--> *). Anterograde labeling was observed in the superficial layers and retrograde labeling was observed in layer V. This is consistent with the known monosynaptic connections between the amygdala and the entorhinal cortex. Scale bar = 5mm. See also Figure S1 and Tables S1–S2.
Figure 3
Figure 3. Changes in amygdala FC following DREADD activation, across time
A) Significant baseline FC is shown using the amygdala as the seed ROI. Images show Z-scores. Widespread positive FC, and no significantly negative FC, was found. Images oriented using radiological convention. B) CNO-induced transient inactivation in the first 12-minute, post-injection block (i.e. block 2) results in widespread reduction of amygdala FC. The effect of CNO was computed relative to the effect of saline and converted to Z-scores. Warm and cool colors show significant FC reductions and increases, respectively. C–E) Same as B, for blocks 3–5, respectively.
Figure 4
Figure 4. Changes in amygdala FC are correlated with DREADD transfection
A) Amygdalocortical SC, as catalogued in the TTu connectome. B) Scatterplots showing amygdala ΔFC as a function of stereologically estimated populations of DREADD-transfected cells in the amygdala. Left and right amygdala are included separately for each case. Amygdala ΔFC was averaged across regions with known amygdala SC. Trend lines are shown for CNO (dark line) and saline (lighter line) conditions. C) Same as B, averaging ΔFC across regions without amygdala SC.
Figure 5
Figure 5. Corticocortical networks are negatively and positively altered by amygdala inactivation
A) Seven color-coded functional brain modules, i.e. subsets of regions with high intra-modular FC, identified at baseline. B) Average amygdala FC of nodes within each module, sorted high to low. Limbic and default mode nodes have the highest amygdala FC; somatomotor nodes have the lowest. C) FC changes due to amygdala inactivation between limbic and default mode nodes. Red lines indicate reduced FC (Z < 2.6 per edge, corrected p=0.031, edge width denotes Z score magnitude, node size denotes sum of edges incident to node). D) FC changes due to amygdala inactivation between somatomotor nodes. Blue lines indicate increased FC (Z > 2.6 per edge, corrected p=0.011). See also Figures S2 and S3.
Figure 6
Figure 6. Whole-brain network visualizations highlight changes to nodes that are topologically near vs distant from the amygdala
A) Baseline FC matrix and post-inactivation matrix; nodes ordered by module assignments shown in vertical and horizontal colored bars. Square areas inside the matrix indicate within-module connectivity. Connectivity of the limbic module (top left; orange bar) is strongest with itself and the default mode (red bar) modules, and weakest with the somatomotor module (cyan bar). B) CNO-induced FC changes. Reduced FC (warmer colors) is most apparent within the limbic module, within the default mode module, and between the limbic and default mode modules. Increased FC (cooler colors) is most apparent within the somatomotor module. C) Force-directed graph layout of the baseline FC network at 31% density. The left and right amygdala are attached to both the default mode and limbic modules. CCs, PFCoi, and TCpol are functionally closest to the amygdala, whereas the somatomotor module is most distant. D) Graph layout of the post-inactivation network at 31% density. The left and right amygdala are decoupled from the rest of the network, attached only via the right TCpol. E) Baseline FC network at 16% density, excluding the left and right amygdala. F) Post-inactivation network at 16% density. Disruption of connectivity within the limbic and default mode modules and increased connection density in the somatomotor module are visible. See also Figure S2.
Figure 7
Figure 7. Correspondence of amygdala inactivation and simulated structural lesions
Scatterplots show ΔFC due to CNO versus ΔSC-communicability (ΔG, log-transformed) due to simulated disconnection lesion of the amygdala in the TTx connectome. Results are for within-hemisphere amygdalocortical ROI pairs (A) and all within-hemisphere corticocortical ROI pairs (B). Each dot represents mean ΔFC across subjects. C) Line graphs show the dependence of amygdalocortical ΔG-ΔFC correlations and D) corticocortical ΔG-ΔFC correlations upon different walk lengths. Different colored lines represent different subsets of region pairs, such as those with at least a disynaptic connection that traverses the amygdala, or those with either a disynaptic or trisynaptic connection that traverses the amygdala. All corticocortical pairs have at least a tetrasynaptic connection via the amygdala. E) ΔFC of amygdalocortical ROI pairs. ROIs are ordered by functional modules (see Figure 5) shown in color bars on top. E’) ΔG using the same ordering of regions. F) ΔFC matrix of corticocortical ROI pairs. ROIs are ordered by functional modules. F’) ΔG matrix, showing correspondence with ΔFC (note that due to the exponential distribution of SC weights in the TTx connectome, ΔG of the TCpol scales differently from other regions, resulting in the appearance of the dark red line in the matrix). G) Correlations between ΔFC and ΔG using simulated lesions of each ROI. Results are shown for primary region pairs (those including the lesioned region). Color blocks next to ROI names illustrate the strength of amygdala SC as defined in the TTx (for display purposes, SC values were log-transformed, inverted, and normalized to a max value of 1). The top 3 strongest predictors were the amygdala, TCpol, and superior temporal sulcus (TCc). H) Uses the same simulated lesions as in G, showing correlations for secondary region pairs (non-incident to the lesioned region). Top 3 predictors were the CCs, amygdala, and TCpol. See also Figure S6 and Table S4.
Figure 8
Figure 8. Changes in regional signal variance and pairwise covariance are explained by simulated lesion
A) Raw changes in the variance of regional timecourses (Δvariance) as a function of changes in input (ΔGinput) due to simulated amygdala lesion in the TTx connectome. Left and right hemisphere Δvariances were averaged. Each dot represents mean across subjects. The magenta line shows the amygdala. B) Same as A, except Δvariances were normalized against the baseline variance to yield %Δvariance. C) %Δvariances plotted on the brain. Changes in pairwise covariance (Δcovariance) as a function of ΔG, for within-hemisphere amygdalocortical ROI pairs (D) and all within-hemisphere corticocortical ROI pairs (E). D, E, F, and G are analogous to graphs shown in Figure 7, using covariance here as the empirical measure of coupling instead of FC. F and G) Δcovariance-ΔG correlations using simulated lesions of each ROI, assessed across primary region pairs (F) and secondary region pairs (G). See also Figure S6.

Comment in

References

    1. Adachi Y, Osada T, Sporns O, Watanabe T, Matsui T, Miyamoto K, Miyashita Y. Functional connectivity between anatomically unconnected areas is shaped by collective network-level effects in the macaque cortex. Cereb Cortex. 2012;22:1586–1592. - PubMed
    1. Aggleton JP, Burton MJ, Passingham RE. Cortical and subcortical afferents to the amygdala of the rhesus monkey (Macaca mulatta) Brain Res. 1980;190:347–368. - PubMed
    1. Aggleton JP, Wright NF, Vann SD, Saunders RC. Medial temporal lobe projections to the retrosplenial cortex of the macaque monkey. Hippocampus. 2012;22:1883–1900. - PMC - PubMed
    1. Alstott J, Breakspear M, Hagmann P, Cammoun L, Sporns O. Modeling the impact of lesions in the human brain. PLoS Comput Biol. 2009;5:e1000408. - PMC - PubMed
    1. Amaral DG, Price JL. Amygdalo-cortical projections in the monkey (Macaca fascicularis) J Comp Neurol. 1984;230:465–496. - PubMed

Publication types

LinkOut - more resources