Review
. 2016 Sep 20;111(6):1119-1131.
doi: 10.1016/j.bpj.2016.04.054. Epub 2016 Jul 29.

Genetically Encoded Fluorescent Indicators for Organellar Calcium Imaging

Affiliations
Review

Genetically Encoded Fluorescent Indicators for Organellar Calcium Imaging

Junji Suzuki et al. Biophys J. .

Abstract

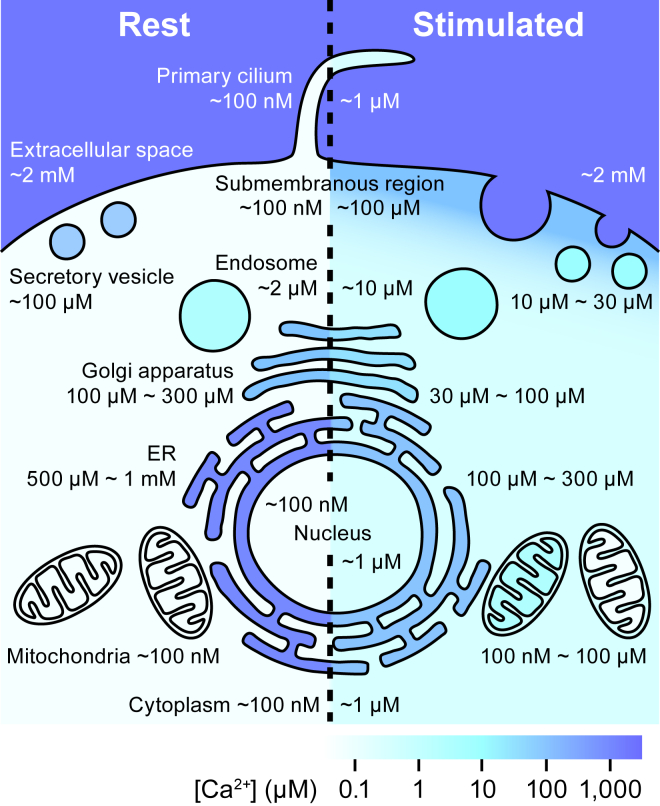
Optical Ca(2+) indicators are powerful tools for investigating intracellular Ca(2+) signals in living cells. Although a variety of Ca(2+) indicators have been developed, deciphering the physiological functions and spatiotemporal dynamics of Ca(2+) in intracellular organelles remains challenging. Genetically encoded Ca(2+) indicators (GECIs) using fluorescent proteins are promising tools for organellar Ca(2+) imaging, and much effort has been devoted to their development. In this review, we first discuss the key points of organellar Ca(2+) imaging and summarize the requirements for optimal organellar Ca(2+) indicators. Then, we highlight some of the recent advances in the engineering of fluorescent GECIs targeted to specific organelles. Finally, we discuss the limitations of currently available GECIs and the requirements for advancing the research on intraorganellar Ca(2+) signaling.


Figures

Figure 1
Figure 1
Ca2+ concentrations in subcellular compartments. Ca2+ concentrations in the intracellular organelles and subcellular compartments in the resting state (left) and after stimulation (right). This represents a summary of the results obtained to date using the organellar genetically encoded Ca2+ indicators reviewed here. To see this figure in color, go online.
Figure 2
Figure 2
High spatiotemporal resolution of ER Ca2+ release using CEPIA. (A) Time-lapse images of a wavelike decrease in the ER Ca2+ concentration in a HeLa cell visualized with G-CEPIA1er. Perfusion of 10 μM histamine is started at 0 s. (B) Time-course of ER Ca2+ dynamics along the white line indicated in (A). (C) Comparison of ER Ca2+ dynamics in the two regions of interest indicated in (A). The fluorescence intensity is normalized by the initial intensity. These results show that Ca2+ release from the ER initiates at the tips of cells, and then it propagates to the perinuclear region. (Black line) Region 1; (green line) region 2. This figure is adapted from Suzuki et al. (24). To see this figure in color, go online.
Figure 3
Figure 3
Simultaneous imaging of Ca2+ signal in three subcellular compartments. (A) Ca2+ response of a HeLa cell in the resting state (upper) and after 10 μM histamine application (lower) in the mitochondria (left), ER (middle), and cytosol (right) visualized with R-GECO1mt, G-CEPIA1er, and GEM-GECO1, respectively. (B) Time-courses of Ca2+ signal in the mitochondria (magenta), ER (green), and cytosol (blue) within or surrounding the two regions of interest indicated in (A). These results show that there is a considerable intracellular inhomogeneity in mitochondrial Ca2+ signals after agonist-induced Ca2+ release from the ER, while homogeneous responses are observed in the cytosol and the ER. This figure is adapted from Suzuki et al. (24). To see this figure in color, go online.
Figure 4
Figure 4
Ca2+ imaging in the primary cilia upon chemical or mechanical stimulation. (A) Ca2+ signals in a NIH-3T3 cell in the resting state (left), after 10 μM ATP application (middle) and after 2 μM ionomycin application (right), visualized with 5-HT6-G-GECO1.0 and R-GECO1 in the primary cilium (upper) and the cytosol (lower), respectively. (B) Time-courses of Ca2+ signals in the primary cilium (cyan) and cytosol (magenta) within the cell indicated in (A). (C) Schematic of flow-induced movement of a primary cilium. A primary cilium in an upright position bends in response to laminar flow. Images of the primary cilium were generated by z-projections of consecutive xy-plane images. (D) Time-lapse images of a primary cilium subjected to laminar flow (1 dyne/cm2 shear, blue bar) in a mouse inner medullary collecting duct cell expressing 5HT6-mCherry-G-GECO1.0 (left and middle). mCherry is expressed as a marker to track the spatial movement of the cilium. Time-dependent changes in G-GECO1.0/mCherry fluorescence intensities are shown in pseudo-color (right). (E) Time-courses of 5HT6-mCherry-G-GECO1.0 (black) and 5HT6-mCherry-GFP (gray, as a control). This figure is adapted from Su et al. (28). To see this figure in color, go online.

Comment in

References

    1. Berridge M.J., Lipp P., Bootman M.D. The versatility and universality of calcium signalling. Nat. Rev. Mol. Cell Biol. 2000;1:11–21. - PubMed
    1. Berridge M.J., Bootman M.D., Roderick H.L. Calcium signalling: dynamics, homeostasis and remodelling. Nat. Rev. Mol. Cell Biol. 2003;4:517–529. - PubMed
    1. Mekahli D., Bultynck G., Missiaen L. Endoplasmic-reticulum calcium depletion and disease. Cold Spring Harb. Perspect. Biol. 2011;3:3. - PMC - PubMed
    1. Rizzuto R., De Stefani D., Mammucari C. Mitochondria as sensors and regulators of calcium signalling. Nat. Rev. Mol. Cell Biol. 2012;13:566–578. - PubMed
    1. Takahashi A., Camacho P., Herman B. Measurement of intracellular calcium. Physiol. Rev. 1999;79:1089–1125. - PubMed

LinkOut - more resources