. 2016 Aug 16;16(7):1891-902.
doi: 10.1016/j.celrep.2016.07.006. Epub 2016 Jul 28.

A Transcript-Specific eIF3 Complex Mediates Global Translational Control of Energy Metabolism

Affiliations

A Transcript-Specific eIF3 Complex Mediates Global Translational Control of Energy Metabolism

Meera Shah et al. Cell Rep. .

Abstract

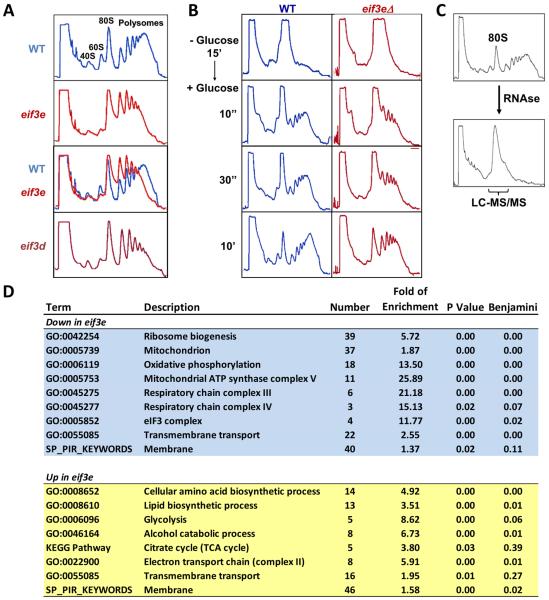
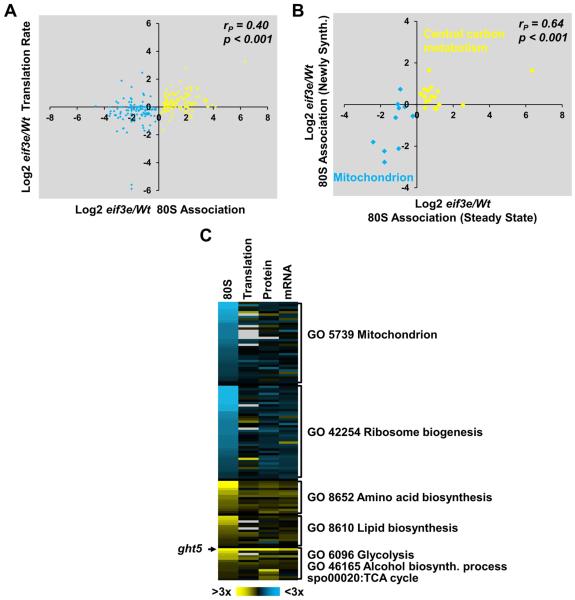
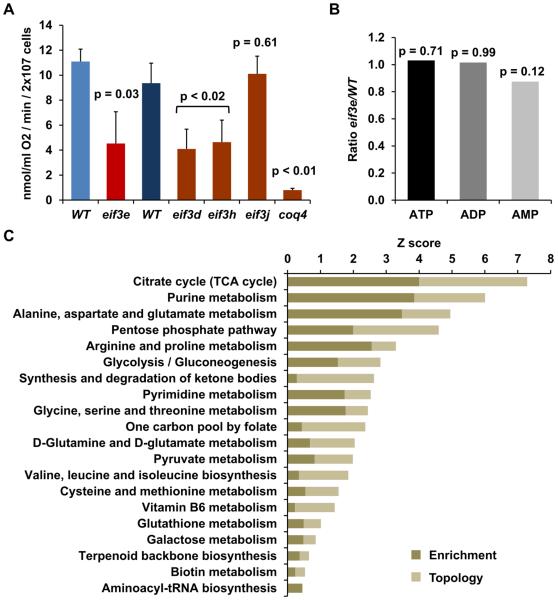
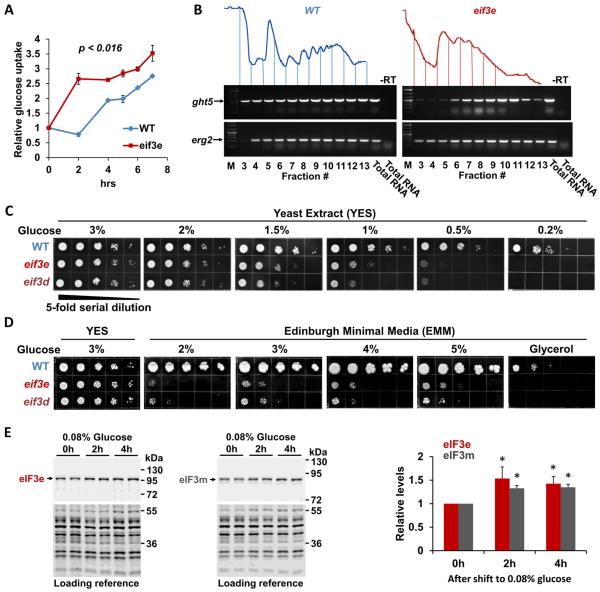
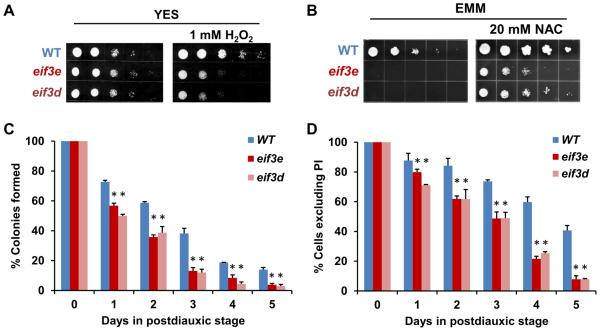
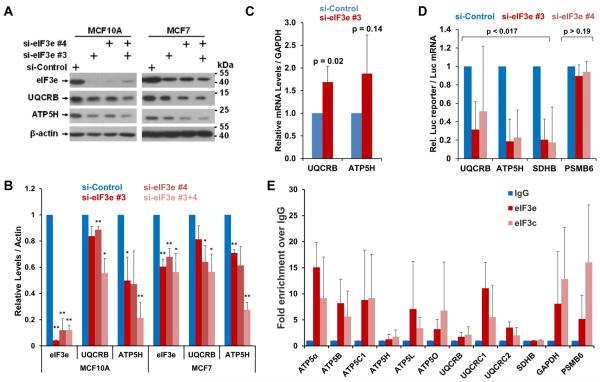
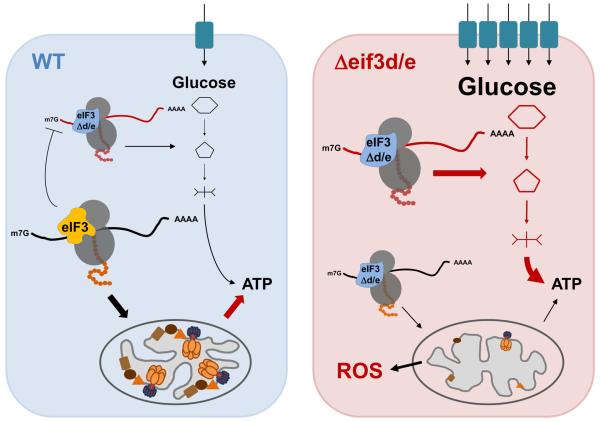
The multi-subunit eukaryotic translation initiation factor eIF3 is thought to assist in the recruitment of ribosomes to mRNA. The expression of eIF3 subunits is frequently disrupted in human cancers, but the specific roles of individual subunits in mRNA translation and cancer remain elusive. Using global transcriptomic, proteomic, and metabolomic profiling, we found a striking failure of Schizosaccharomyces pombe cells lacking eIF3e and eIF3d to synthesize components of the mitochondrial electron transport chain, leading to a defect in respiration, endogenous oxidative stress, and premature aging. Energy balance was maintained, however, by a switch to glycolysis with increased glucose uptake, upregulation of glycolytic enzymes, and strict dependence on a fermentable carbon source. This metabolic regulatory function appears to be conserved in human cells where eIF3e binds metabolic mRNAs and promotes their translation. Thus, via its eIF3d-eIF3e module, eIF3 orchestrates an mRNA-specific translational mechanism controlling energy metabolism that may be disrupted in cancer.


Figures

Figure 1
Figure 1. Effect of deletion of eif3e and eif3d on protein synthesis
A) Sucrose density gradient profile of the indicated wild-type (blue) and eif3 mutant (red) strains. B) Polysome run-off was induced by glucose withdrawal for 15 minutes, and translation initiation was assesses by sucrose density gradient centrifugation upon re-addition of glucose for the indicated times. Glucose-induced protein synthesis was stopped at the indicated time points by the addition of 100 ug/ml cycloheximide. C) Strategy for 80S proteomics. Cell lysate was digested with RNAse 1 and separated by sucrose density gradient centrifugation. Fractions containing 80S ribosomes were analyzed by liquid chromatography and tandem mass spectrometry (LC-MS/MS). D) Gene ontology terms enriched in the list of proteins that were significantly up- (yellow) or down-regulated (blue) in 80S complexes isolated from eif3e mutant cells. Data are from a total of five repeat experiments.
Figure 2
Figure 2. Effect of deletion of eif3e on the synthesis of metabolism-related proteins
A) Correlation between changes in the association of a protein with 80S complexes and its translation rate as determined by pulsed SILAC in the absence of eif3e. Translation rates are averages of two replicates. Pearson coefficient and p value of an ANOVA regression analysis are indicated. B) 80S complexes were isolated from cells pulse-labeled with 15N-NH4Cl to profile changes in the 80S association of newly synthesized metabolism-related proteins in eif3e mutant cells relative to wild-type (WT) cells. The resulting eif3e/WT log2 ratios were plotted on the vertical axis. Data are averages of two independent experiments. Corresponding steady-state 80S association ratios were plotted on the horizontal axis. Pearson coefficient and p value of an ANOVA regression analysis are indicated. C) Intensity map of changes (log2) in 80S association, translation (pulsed SILAC), and steady-state protein and mRNA levels eif3e deleted cells /WT ratios. Proteins are sorted according to gene ontology terms. Missing values are in light grey.
Figure 3
Figure 3. Metabolic re-programming in eif3 deficient cells
A) Oxygen consumption rate was determined in the indicated wild-type (WT) and eif3 mutant strains. Two different WT strains were used that are syngeneic with the eif3 deleted strains to their right. Error bars represent standard deviations of 3 (WT, eif3e, eif3d, eif3h, eif3j) or 4 (WT, coq4) independent measurements. P values correspond to the results of a t-test with two-tailed distribution and unequal variance. B) eif3e/WT ratios of the indicated metabolites as determined by LC-MS/MS in triplicates and statistical analysis in MetaboAnalyst. P values are results of a t-test. C) Kyoto Encyclopedia of Genes and Genomes (KEGG) pathways enriched in the sets of 90 metabolites and 521 proteins that significantly differed between wild-type and eif3e mutant cells. Plotted are the Z scores for pathway enrichment and pathway topology analysis derived from the MetaboAnalyst 3.0 tool suite (Xia et al., 2015). Since this type of integrated metabolite and protein expression analysis is only available for mammalian data, the putative human orthologues of the significantly changed S. pombe proteins were used for the analysis.
Figure 4
Figure 4. Effect of eIF3 deficiency on glucose uptake
A) Glucose uptake was measured by determining the depletion of glucose from the media during the growth of wild-type (WT) and eif3e deleted cells using a YSI 2950 metabolite analyzer. Glucose concentration in the media was normalized to cell growth (i.e. OD600) to account for the slower growth rate of eif3e deleted cells. Data are averages of three biological replicates with error bars indicating standard deviations. Statistical significance was assessed with a t-test assuming two-tailed distribution and unequal variance. B) RNA was purified from sucrose density gradient fractions prepared from WT and eif3e mutant cells and employed in RT-PCR reactions with primers specifically amplifying the mRNA encoding the hexose transporter ght5 and erg2 as a reference. Only fractions containing mRNA (3 – 12) were used for RT-PCR. Total RNA was used as reference. Reactions excluding reverse transcriptase are shown to prove that the band shown is derived from RNA not DNA. C) Growth of eif3e and eif3d deleted cells under limiting glucose conditions. 5-fold serial dilutions of the indicated strains were plated onto rich yeast extract (YES) media containing decreasing glucose concentrations and growth was scored after 2 – 4 days. D) Growth of eif3e and eif3d deleted cells on minimal media (EMM) containing increasing concentrations of glucose or on glycerol as the sole carbon source. E) Effect of glucose restriction on the levels of eIF3e and eIF3m proteins. Strains harboring alleles of eif3e and eif3m modified with protein A epitope tags (Zhou et al., 2005) were shifted from media containing 3% glucose to medium containing 0.08% glucose for the indicated times. Cell lysates were loaded in duplicates and blotted with anti-protein A antibodies to detect eIF3e and eIF3m, respectively. Bands obtained with anti-PSTAIR antibodies were used as loading reference (bottom panels). Blots from biological replicates were quantified with the Licor Image Studio Lite package and results corrected for the loading reference were plotted. Statistical significance was assessed with a t-test assuming two-tailed distribution and unequal variance. Asterisks indicate p < 0.05.
Fig. 5
Fig. 5. Stress sensitivity and premature aging of eif3e and eif3d deleted cells
A) Sensitivity of eif3 deleted cells to H2O2 was assessed by spotting 5-fold serial dilutions on plates containing 1 mM H2O2. B) Effect of the anti-oxidant N-acetyl cysteine on the growth of eif3 deleted strains in minimal media (EMM with 2% glucose). C) Viability of wild-type (WT) and eif3 deleted strains in stationary phase as determined by colony formation. Data represent averages of biological replicates, and error bars indicate standard deviations. Statistical significance of the difference between WT and eif3 deleted cells at each time point was assessed with a t-test assuming two-tailed distribution and unequal variance. The asterisks indicate p < 0.05. D) Viability of wild-type (WT) and eif3 deleted strains in stationary phase as determined by exclusion of propidium iodide. Data represent averages of biological replicates, and error bars indicate standard deviations. Statistical significance of the difference between WT and eif3 deleted cells at each time point was assessed with a t-test assuming two-tailed distribution and unequal variance. The asterisks indicate p < 0.05.
Fig. 6
Fig. 6. Effect of knockdown of eIF3e on the synthesis of ETC proteins in mammalian cells
A) eIF3e was knocked down in non-tumorigenic MCF10A and tumorigenic MCF7 cells, followed by determination of the levels of the indicated ETC proteins by immunoblotting. B) Blots in A) derived from biological replicates were quantified with the Licor Image Studio Lite package and results corrected for the loading reference were plotted in a bar graph (bottom panel). Statistical significance was assessed with a t-test assuming two-tailed distribution and unequal variance. Two asterisks indicate p < 0.05, one asterisk indicates p < 0.1. Error bars represent standard deviations. C) eIF3e was knocked down in MCF7 cells, followed by determination of the levels of the indicated mRNA by quantitative RT-PCR relative to GAPDH mRNA as a reference. Averaged data from four biological replicates were plotted in a bar graph. Error bars indicate standard deviations. Statistical significance was assessed with a t-test assuming two-tailed distribution and unequal variance. P values for differences to the si-Control values are indicated. The corresponding mRNA data for MCF10A cells is shown in Fig. S4C. D) Reporter constructs fusing the 5’-UTRs of the indicated ETC encoding mRNAs were fused to luciferase and transfected into MCF10A cells upon knockdown of eIF3e. Luciferase activity was normalized to luciferase mRNA measured by q-PCR. The graph shows averages of 3 independent experiments (Fig. S5B). Error bars indicate standard deviations. Statistical significance was assessed with a t-test assuming two-tailed distribution and unequal variance. P values for differences to the si-Control values are indicated. eIF3e knockdown efficiency is documented in Fig. S5C. E) eIF3 complexes were immunopurified from MCF7 cells using antibodies against eIF3e and eIF3c as indicated. eIF3-associated mRNA was extracted and quantified by q-PCR. The graph shows fold change in the enrichment relative to the IgG control. Data represent averages of at least 3 independent experiments, and error bars indicate standard deviations.
Fig. 7
Fig. 7. Model for the role of eIF3 complexes in the translational control of energy metabolism
An eIF3 complex containing all subunits including eIF3d and eIF3e directs the synthesis of mitochondrial ETC components and other mitochondrial proteins leading to efficient respiration and ATP production (left panel). In cells missing eif3e and eif3d, the synthesis of ETC components is diminished, leading to decreased respiration (right panel). As a result of inefficient electron transport, mitochondrial ROS production increases, resulting in endogenous oxidative stress and reduced life span. In an apparent attempt to balance the mitochondrial deficit, a retrograde mitochondria-to-nucleus signaling loop in eIF3d/e depleted cells leads to the induction of a transcriptional program upregulating the mRNAs encoding the high affinity glucose transporter Ght5p as well as glycolytic enzymes. These mRNAs appear preferentially translated by the eIF3 complex lacking subunits “d” and “e” (eIF3Δd/e), since their ribosomal occupancy is greatly increased in eif3e deleted cells. This suggests in inhibitory activity of the eIF3 holo-complex on the translation of mRNAs encoding glucose utilization components in wild-type cells whose biochemical mechanism - which our data suggest involves direct mRNA binding - remains subject to further investigations.

Comment in

Similar articles

Cited by

References

    1. Asano K, Merrick WC, Hershey JWB. The Translation Initiation Factor eIF3-p48 Subunit Is Encoded by int-6, a Site of Frequent Integration by the Mouse Mammary Tumor Virus Genome. J. Biol. Chem. 1997;272:23477–23480. - PubMed
    1. Bandyopadhyay A, Matsumoto T, Maitra U. Fission Yeast Int6 Is Not Essential for Global Translation Initiation, but Deletion of int6 + Causes Hypersensitivity to Caffeine and Affects Spore Formation. Mol. Biol. Cell. 2000;11:4005–4018. - PMC - PubMed
    1. Bandyopadhyay A, Lakshmanan V, Matsumoto T, Chang EC, Maitra U. Moe1 and spInt6, the Fission Yeast Homologues of Mammalian Translation Initiation Factor 3 Subunits p66 (eIF3d) and p48 (eIF3e), Respectively, Are Required for Stable Association of eIF3 Subunits. J. Biol. Chem. 2002;277:2360–2367. - PubMed
    1. Birsoy K, Wang T, Chen WW, Freinkman E, Abu-Remaileh M, Sabatini DM. An Essential Role of the Mitochondrial Electron Transport Chain in Cell Proliferation Is to Enable Aspartate Synthesis. Cell. 2015;162:540–551. - PMC - PubMed
    1. Brill LM, Motamedchaboki K, Wu S, Wolf DA. Comprehensive proteomic analysis of Schizosaccharomyces pombe by two-dimensional HPLC-tandem mass spectrometry. Methods. 2009;48:311–319. - PMC - PubMed

MeSH terms

Substances