. 2017 Feb;139(2):607-620.e15.
doi: 10.1016/j.jaci.2016.03.059. Epub 2016 Jun 18.

Immune dysregulation in patients with PTEN hamartoma tumor syndrome: Analysis of FOXP3 regulatory T cells

Affiliations

Immune dysregulation in patients with PTEN hamartoma tumor syndrome: Analysis of FOXP3 regulatory T cells

Hannah H Chen et al. J Allergy Clin Immunol. 2017 Feb.

Abstract

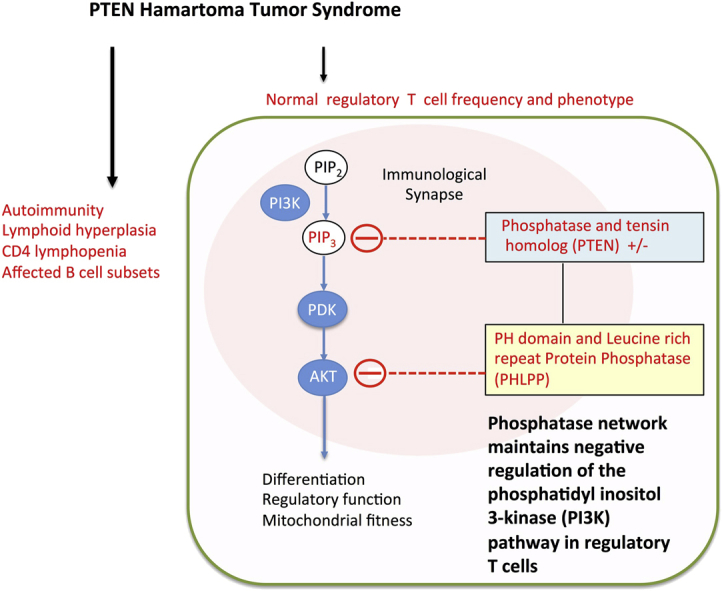
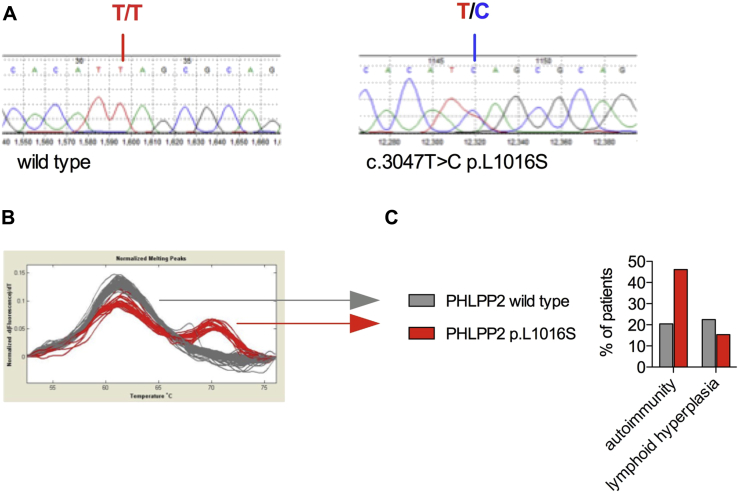
Background: Patients with heterozygous germline mutations in phosphatase and tensin homolog deleted on chromosome 10 (PTEN) experience autoimmunity and lymphoid hyperplasia.

Objectives: Because regulation of the phosphoinositide 3-kinase (PI3K) pathway is critical for maintaining regulatory T (Treg) cell functions, we investigate Treg cells in patients with heterozygous germline PTEN mutations (PTEN hamartoma tumor syndrome [PHTS]).

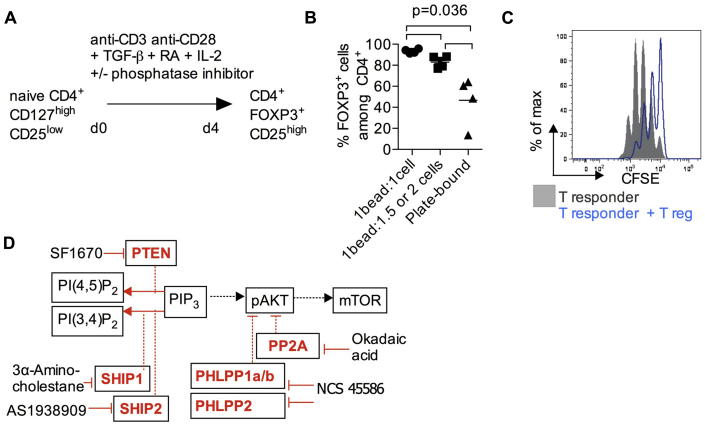
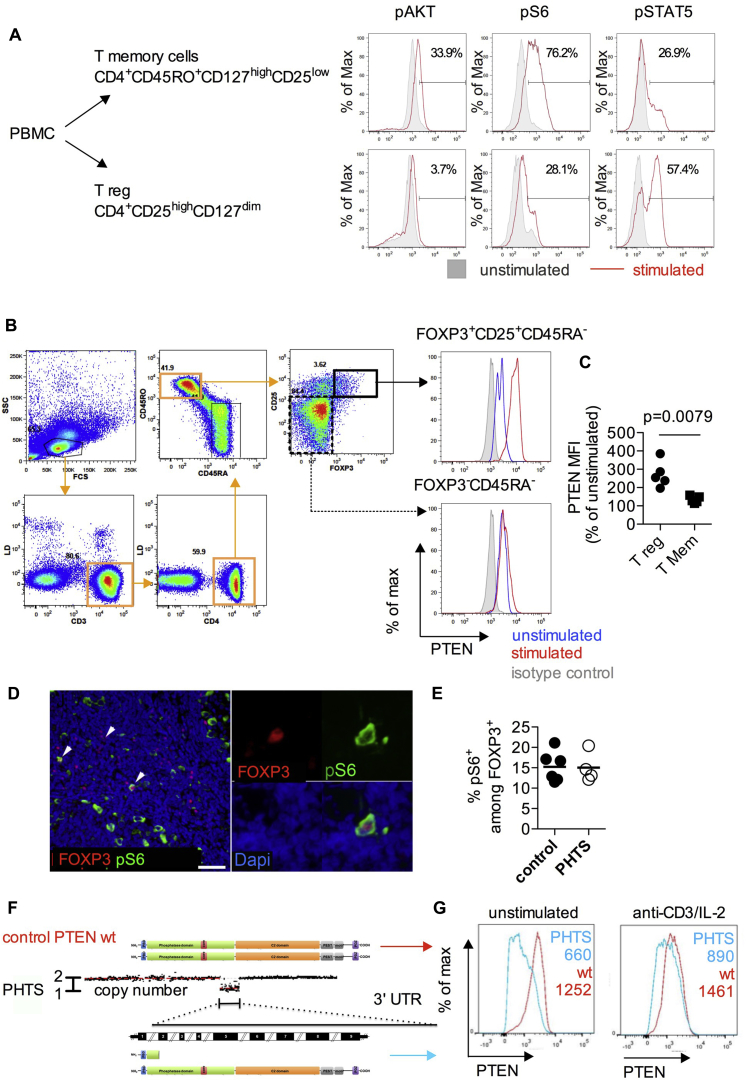
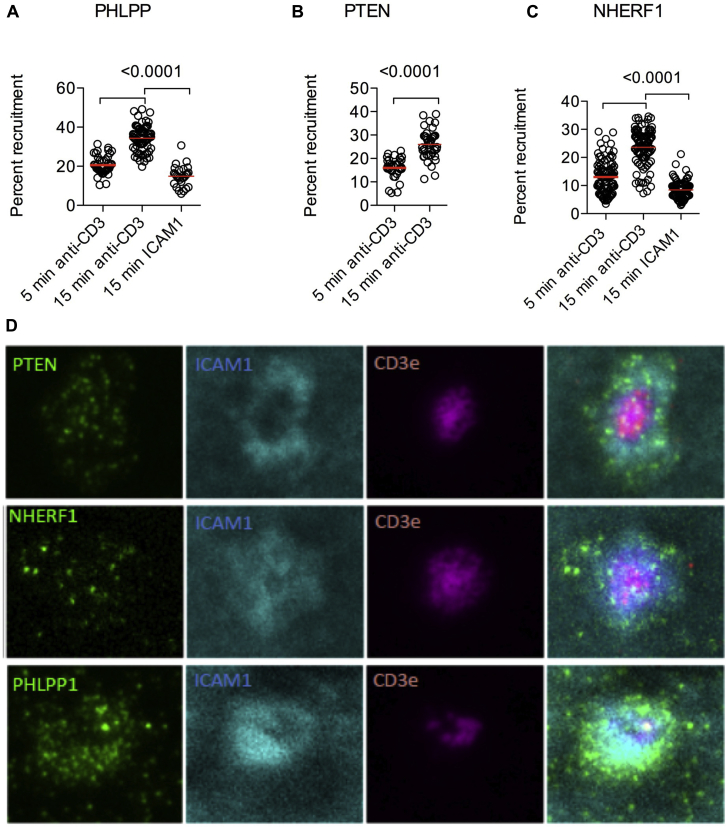
Methods: Patients with PHTS were assessed for immunologic conditions, lymphocyte subsets, forkhead box P3 (FOXP3)+ Treg cell levels, and phenotype. To determine the functional importance of phosphatases that control the PI3K pathway, we assessed Treg cell induction in vitro, mitochondrial depolarization, and recruitment of PTEN to the immunologic synapse.

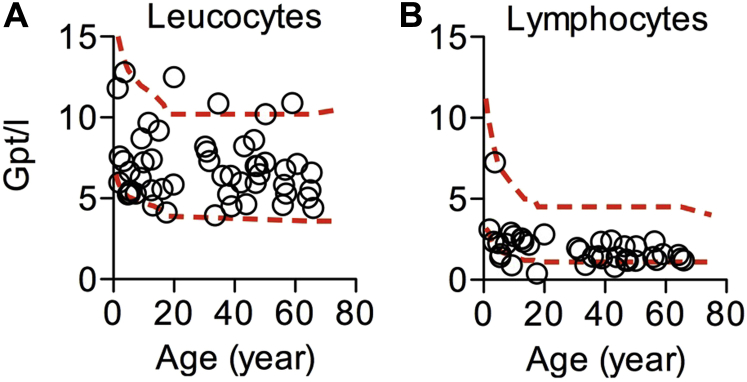
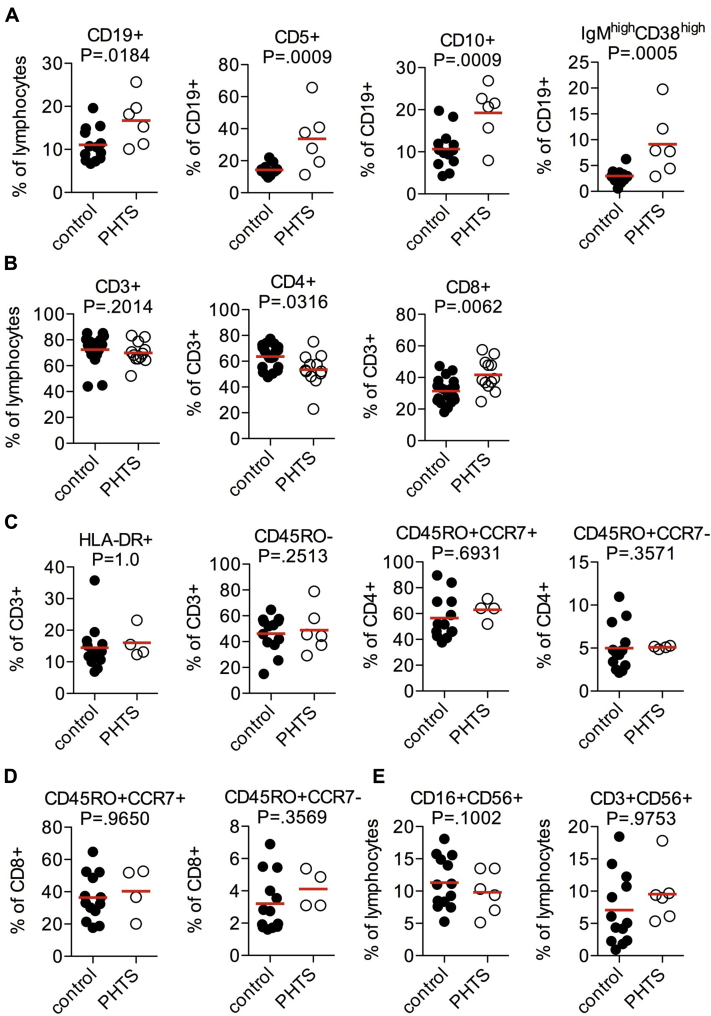
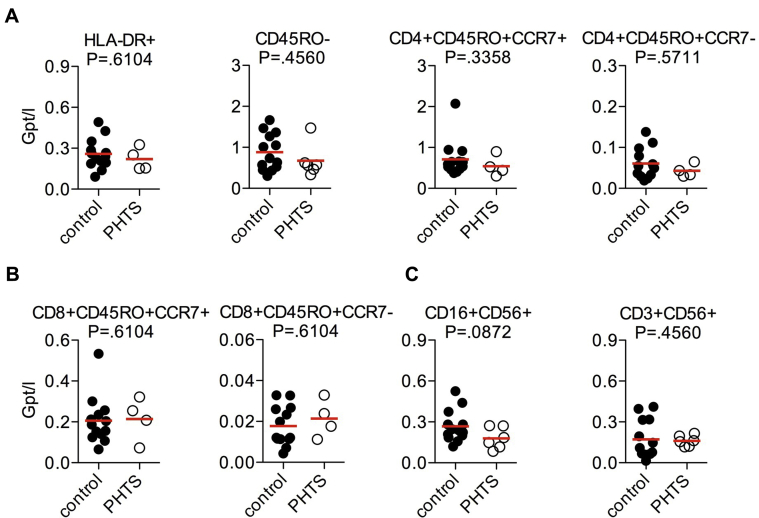
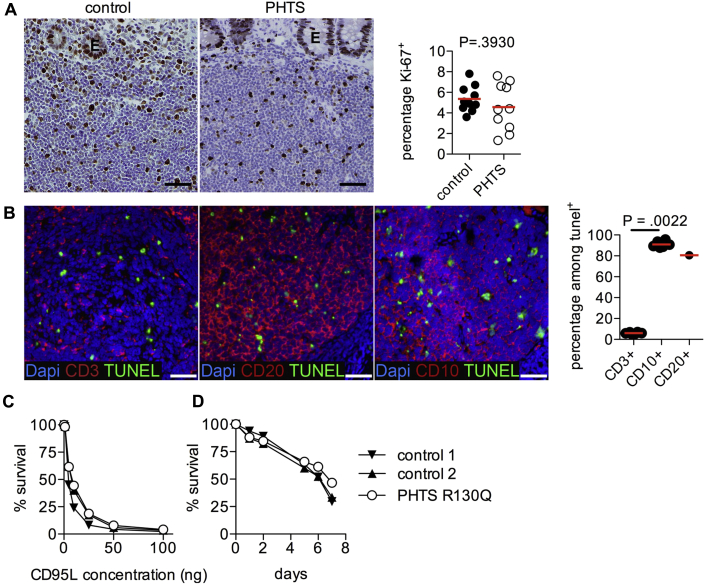
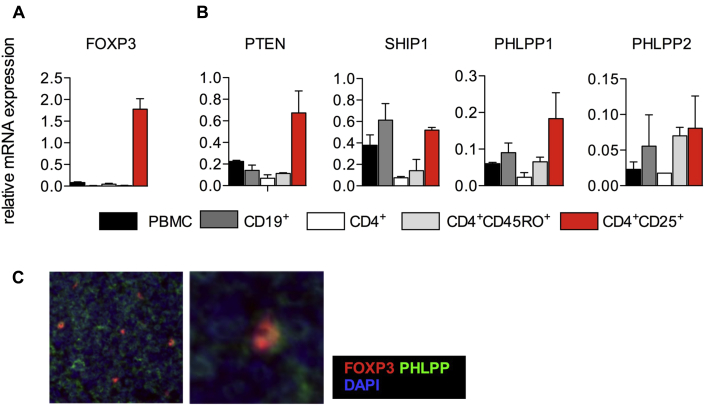
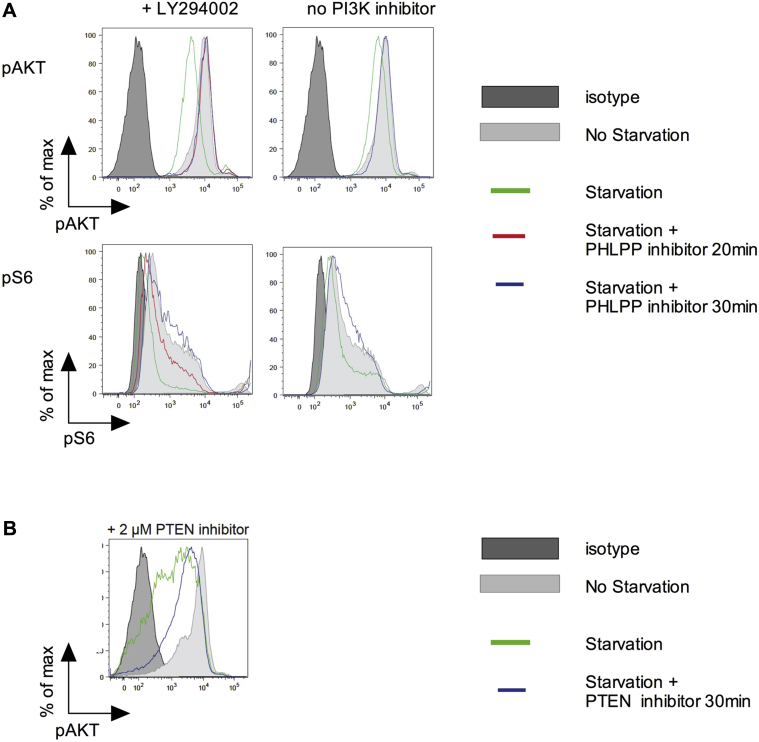
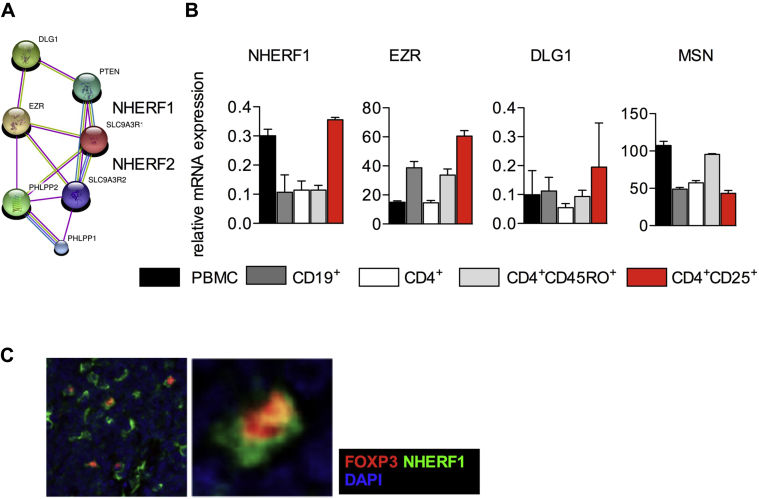
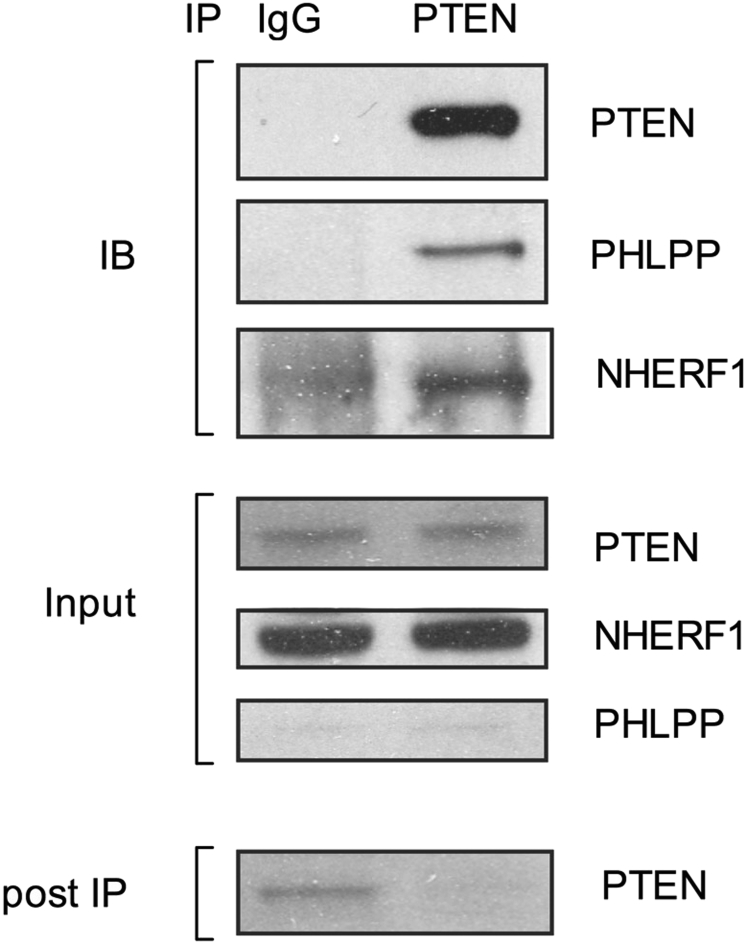
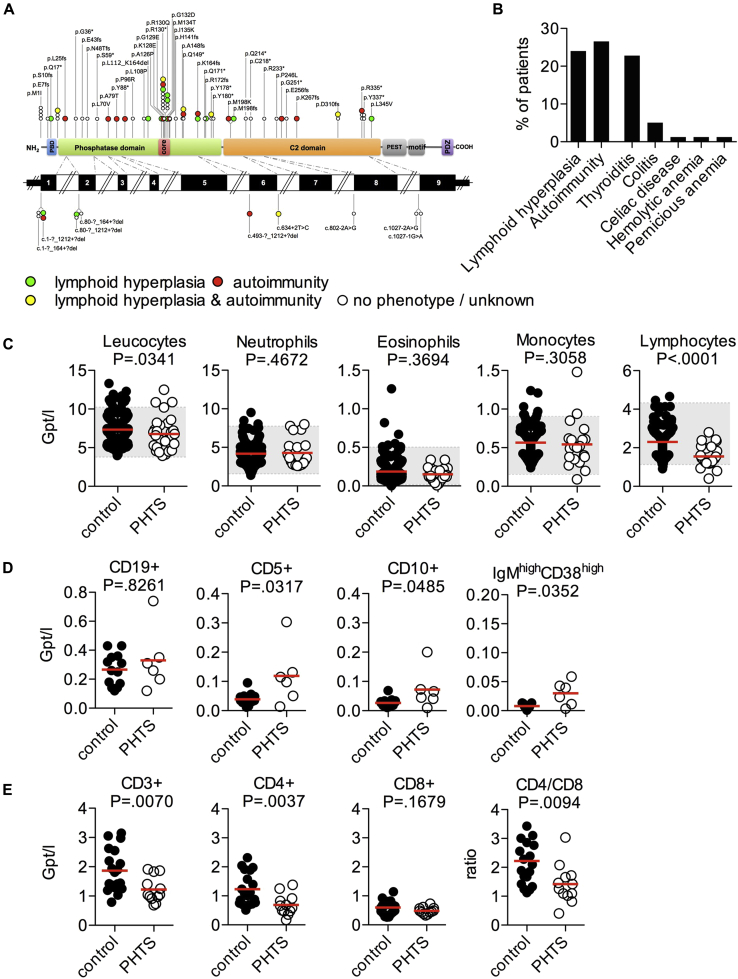
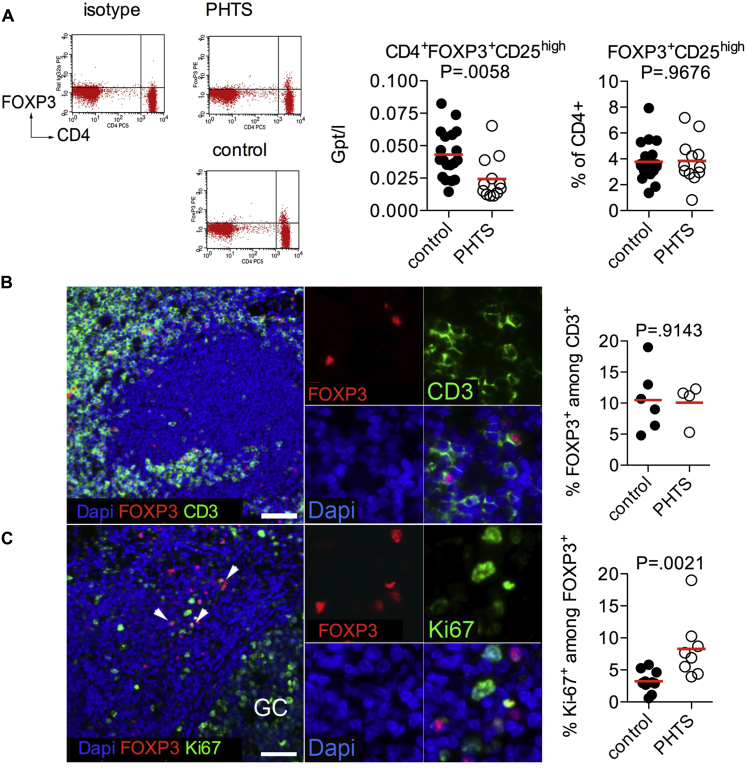
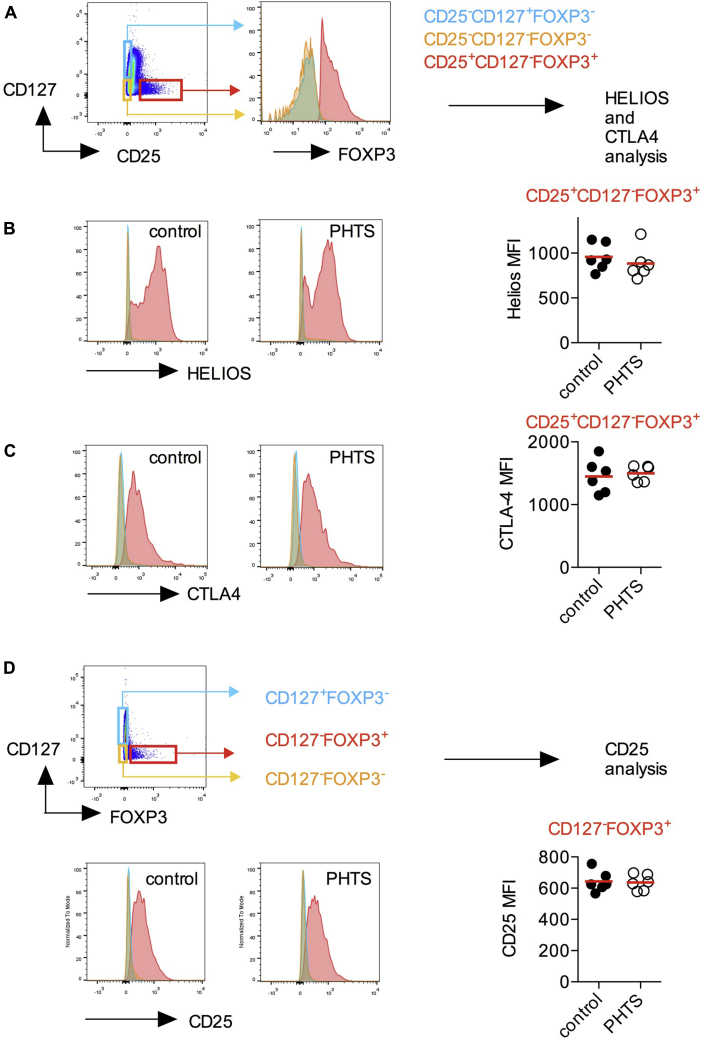
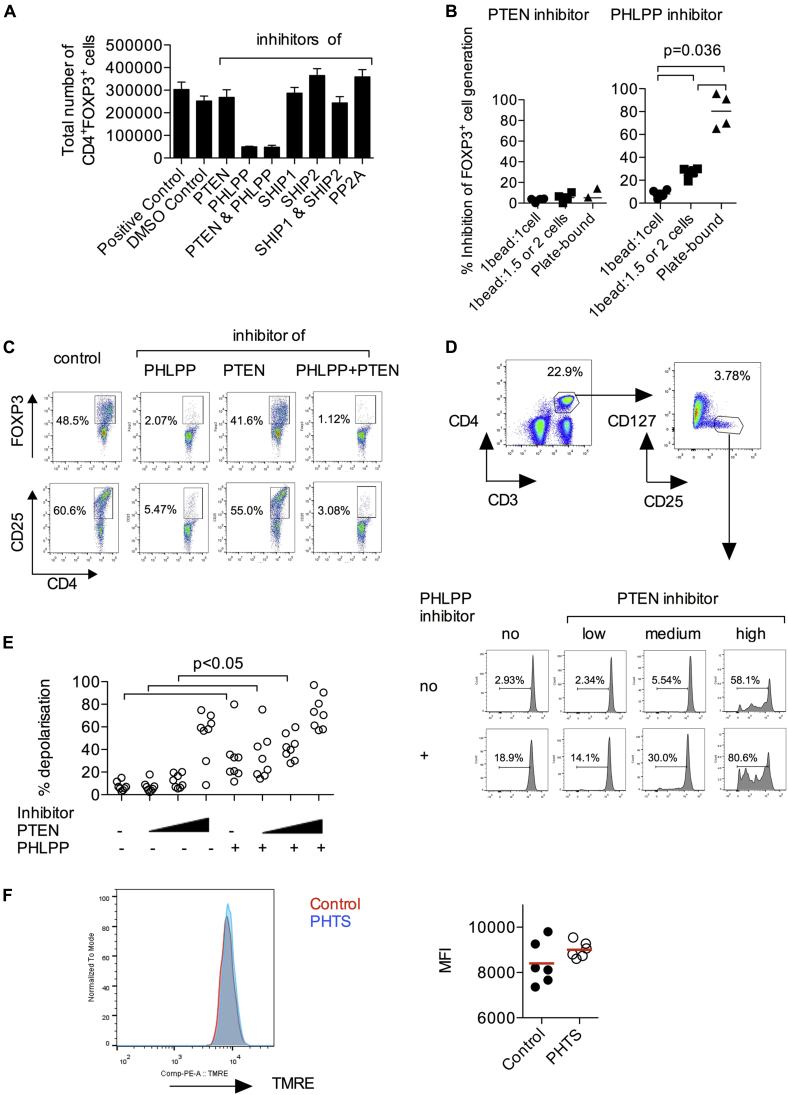
Results: Autoimmunity and peripheral lymphoid hyperplasia were found in 43% of 79 patients with PHTS. Immune dysregulation in patients with PHTS included lymphopenia, CD4+ T-cell reduction, and changes in T- and B-cell subsets. Although total CD4+FOXP3+ Treg cell numbers are reduced, frequencies are maintained in the blood and intestine. Despite pathogenic PTEN mutations, the FOXP3+ T cells are phenotypically normal. We show that the phosphatase PH domain leucine-rich repeat protein phosphatase (PHLPP) downstream of PTEN is highly expressed in normal human Treg cells and provides complementary phosphatase activity. PHLPP is indispensable for the differentiation of induced Treg cells in vitro and Treg cell mitochondrial fitness. PTEN and PHLPP form a phosphatase network that is polarized at the immunologic synapse.

Conclusion: Heterozygous loss of function of PTEN in human subjects has a significant effect on T- and B-cell immunity. Assembly of the PTEN-PHLPP phosphatase network allows coordinated phosphatase activities at the site of T-cell receptor activation, which is important for limiting PI3K hyperactivation in Treg cells despite PTEN haploinsufficiency.

Keywords: PH domain leucine-rich repeat protein phosphatase; PHTS; PTEN; Regulatory T cells; autoimmunity; immunologic synapse; phosphatases; phosphoinositide 3-kinase.


Figures

None
Graphical abstract
Fig E1
Fig E1
Leukocyte and lymphocyte counts in peripheral blood of patients with PHTS, with age indicated. A, Leukocyte counts. B, Lymphocyte counts. Lines represent the upper and lower normal reference.
Fig E2
Fig E2
Lymphocyte subsets of patients with PHTS (proportions). A, Frequencies of CD19+, CD5+, CD10+ immature, and IgMhighCD38high transitional B cells. B, Frequencies of CD3+ T cells and percentages of CD4+ and CD8+ T cells among CD3+ T cells. C, Frequencies of HLA-DR+ activated T cells and CD45RO naive T cells, CD45RO+CCR7+ central memory CD4+ T cells, and CD45RO+CCR7 effector memory CD4+ T cells. D, Frequencies of CD45RO+CCR7+ central memory CD8+ T cells and CD45RO+CCR7- effector memory CD8+ T cells. E, Frequencies of CD16+CD56+ NK cells and CD3+CD56+ NKT cells. Each dot represents 1 patient. The mean is presented by the red line. Statistical differences were analyzed by using the Mann-Whitney test.
Fig E3
Fig E3
FACS analysis of T-cell subsets, NK cells, and NKT cells in peripheral blood of patients with PHTS (absolute numbers). A, Levels of HLA-DR+ activated T cells and CD45RO naive T cells, CD45RO+CCR7+ central memory CD4+ T cells, and CD45RO+CCR7 effector memory CD4+ T cells. B, Levels of CD45RO+CCR7+ central memory CD8+ T cells and CD45RO+CCR7 effector memory CD8+ T cells. C, Levels of CD16+CD56+ NK cells and CD3+CD56+ NKT cells. Each dot represents 1 patient. The mean is presented by the red line. Statistical differences were analyzed by using the Mann-Whitney test.
Fig E4
Fig E4
Proliferation and apoptosis in lymphocytes from patients with PHTS. A, Gut tissue sections from patients with PHTS or control subjects were stained for Ki-67. Cell proliferation was analyzed within the T-cell areas. E, Epithelium. B, CD3, CD20, and CD10 costaining with terminal deoxynucleotidyl transferase dUTP nick end-labeling (TUNEL) for apoptosis detection in control appendix sections. The graph demonstrates the percentage of TUNEL+ cells that are CD3+, CD20+, or CD10+. Differences were analyzed by using the Mann-Whitney test. Scale bars = 50 μm. Symbols represent individual patients. C and D,In vitro apoptosis assays. Apoptosis was induced in PHA-activated T-cell blasts by means of CD95L (FasL) stimulation (Fig E4, C) or IL-2 deprivation (Fig E4, D). Percentages of surviving cells are shown for 1 patient with PHTS (p.R130Q) and 2 healthy control subjects. Similar results have been obtained by using analysis of 6 further patients with PHTS with different mutations in an independent experiment (data not shown). Dapi, 4′, 6′-Diamidino-2-phenylindole.
Fig E5
Fig E5
Phosphatases in PBMCs and blood-derived lymphocyte subsets. A and B, mRNA gene expression analysis in PBMCs compared with FACS-sorted B cells, whole CD4+ T cells, Tmem cells, and CD4+CD25+/high Treg cells. Comparative gene expression analysis of FOXP3 (Fig E5, A) and different phosphatases (PTEN, SHIP1, PHLPP1, and PHLPP2; Fig E5, B) regulating the PI3K/AKT/mTOR signaling pathway. Values are normalized to 18S rRNA. Means and SDs are shown for triplicate values. C, Immunohistochemical detection of PHLPP protein in FOXP3+ cells. Images show representative PHLPP staining in FOXP3+ cells in a control appendix section. DAPI, 4′, 6′-Diamidino-2-phenylindole.
Fig E6
Fig E6
iTreg assay and blockade of iTreg generation by phosphatase-specific inhibitors. A,In vitro differentiation of naive T cells into FOXP3 iTreg cells. B, Effects of TCR signal strength on FOXP3 induction. TCR stimulation was provided by T-cell activator beads or plate-bound anti-CD3 (10 μg/mL)/soluble anti-CD28 (1 μg/mL). C,In vitro T-cell proliferation suppression assay. Carboxyfluorescein succinimidyl ester (CFSE)–labeled naive (responder) T cells were cocultured with anti-CD3/anti-CD28 beads in the presence and absence of iTreg cells. Responder T-cell proliferation was measured by means of CFSE dilution. Data are representative of 2 independent experiments. D, Small-molecule inhibitors were used to block various phosphatases (PTEN, PHLPP1/2, SHIP1, SHIP2, and PP2A) that provide negative regulation at different points of the PI3K/AKT/mTOR signaling pathway.
Fig E7
Fig E7
Effects of the small-molecule inhibitors of PHLPP and PTEN on AKT/S6 phosphorylation. A, Levels of pAKT and pS6 in HEK293T cells with or without PHLPP inhibitor treatment. HEK293T cells were plated for 24 hours in Dulbecco modified Eagle medium supplemented with 10% FCS before serum starvation. Cells were then incubated for 24 hours in the presence or absence of 10% FCS (starvation or no starvation, respectively). Where appropriate, the PI3K inhibitor LY294002 was added to cells 6 hours after the start of serum starvation and left on for 18 hours to further reduce baseline levels of pAKT in serum-starved cells. Before fixation of cells for Phosflow, cells were exposed to the PHLPP inhibitor for 20 or 30 minutes. pAKT and pS6 levels were measured by using Phosflow. Data are representative of 2 independent experiments. B, Levels of pAKT in HEK293T cells with or without PTEN inhibitor treatment. HEK293T cells were plated for 24 hours in Dulbecco modified Eagle medium supplemented with 10% FCS before serum starvation. Cells were then incubated for 24 hours in the presence or absence of 10% FCS (starvation or no starvation, respectively). Before fixation of cells for Phosflow, cells were exposed to the PTEN inhibitor SF1670 for 30 minutes. pAKT levels were measured by using Phosflow.
Fig E8
Fig E8
Effect of PHLPP2 polymorphism p.L1016S in patients with pathogenic PTEN mutations. A, Sanger sequencing of wild-type and c.3047T>C (p.L1016S) variants. B, LightScanner analysis. C, PHLPP2 genotype-phenotype analysis. Sixty-six patients with PHTS were analyzed for the L1016S variant and autoimmune and lymphoid hyperplasia phenotype. Potential gene-gene interaction between PTEN and PHLPP2 was investigated by determining whether the hypomorphic polymorphism in PHLPP2 (p.L1016S) with reduced dephosphorylation activity at the C-terminal hydrophobic motif Ser473 of AKT has a detectable effect on the immune phenotype in patients with PHTS. The p.L1016S variant is present in about one fifth of the human population and was similarly frequently detected in the PHTS cohort. Although there is no literature to suggest that this polymorphism has major relevance for the development of autoimmunity in the general population with wild-type PTEN, we hypothesized that this polymorphism could be relevant for patients who harbor a pathogenic PTEN mutation and would therefore likely have a different PI3K-AKT signal activation threshold. There was a nonsignificant trend toward an increased frequency of autoimmunity and no significant difference in lymphoid hyperplasia between patients with PHTS with wild-type or L1016S variants. Our data suggest that heterozygous loss of PHLPP2 phosphatase activity has a potential effect on autoimmunity in those patients, but despite analysis of 66 patients with PHTS, this is underpowered.
Fig E9
Fig E9
Expression of scaffold proteins in Treg cells. A, Molecular interactions between PTEN and PHLPP1/2 suggest a protein network that links those phosphatases with the structural scaffold proteins NHERF1/2 and the membrane linker ezrin (EZR; String database 9.0, high-confidence setting). B, mRNA gene expression analysis in PBMCs compared with FACS-sorted B cells, whole CD4+ T cells, Tmem cells, and CD4+CD25+/high Treg cells. Comparative gene expression analysis of the structural proteins NHERF1, EZR, DLG1, and moesin (MSN) is shown. Values are normalized to the 18S rRNA level in each cell population. Means and SDs are shown for triplicate values. NHERF2 expression was not detected (data not shown). C, Immunohistochemical detection of NHERF1 expression in FOXP3+ cells. Images show representative NHERF1 staining in the control appendix section. DAPI, 4′, 6′-Diamidino-2-phenylindole.
Fig E10
Fig E10
Interaction of PTEN with PHLPP and NHERF1 in NIH/3T3 cells. Immunoprecipitation of PTEN followed by Western blot analysis for PTEN, NHERF1 and PHLPP in NIH/3T3 cells. Enrichment of PHLPP and NHERF1 in the immunoprecipitated anti-PTEN fraction but not in control IgG precipitate (IB) demonstrates physical association between PTEN and NHERF1 or PHLPP. For comparison, PTEN, PHLPP, and NHERF1 levels are shown before (Input) and after immunoprecipitation (supernatant post IP).
Fig 1
Fig 1
PHTS patient cohort and clinical phenotype. A, Representation of different pathogenic germline PTEN mutations in 79 patients with PHTS investigated. Symbols represent the mutation site of individual patients. Colored symbols represent patients who present with autoimmunity, lymphoid hyperplasia, or both. B, Immunologic conditions in the PHTS patient cohort. C, Peripheral blood leukocyte counts of adult patients with PHTS (n = 32) and blood donor control subjects (n = 216). Each dot represents 1 patient. Gray boxes mark the normal range. Statistical differences were analyzed by using the Mann-Whitney test. D, Numbers of CD19+, CD5+, CD10+ immature, and IgMhighCD38high transitional B cells. E, Numbers of CD3+ T cells, percentages of CD4+ and CD8+ T cells among CD3+ T cells, and CD4+/CD8+ T-cell ratio.
Fig 2
Fig 2
Treg cells in patients with PHTS. A, Absolute counts and frequencies of Treg cells in blood from patients with PHTS or control subjects. B, Percentages of FOXP3+ cells among CD3+ cells were analyzed in MALT from control subjects and patients. Representative staining of tissue sections from patients with PHTS is shown. C, FOXP3 and Ki-67 expression in MALT. Percentages of Ki-67+ proliferating FOXP3+ Treg cells were analyzed in control and patient samples. Arrows mark Ki-67+FOXP3+ Treg cells. Scale bars in all images represent 50 μm. Dapi, 4′, 6′-Diamidino-2-phenylindole; GC, location of a germinal center.
Fig 3
Fig 3
Phenotype of Treg cells in patients with PHTS. A, CD3+CD4+FOXP3+CD25+CD127 cells (Treg cells) were compared with FOXP3CD25CD127+ (naive and central Tmem cells) and FOXP3CD25CD127 cells (effector T cells). B, Expression levels of Helios are shown as a histogram and quantified in Treg cells. C, Expression levels of CTLA-4 are shown as a histogram and quantified in Treg cells. D, CD3+CD4+FOXP3+CD127 (Treg) cells were compared with FOXP3CD127+ (naive and central Tmem) and FOXP3CD127 (effector T cells) cells. CD25 expression in CD4+FOXP3+ Treg cells is shown as a histogram and quantified in Treg cells. No statistical differences were detected by using the Mann-Whitney U test.
Fig 4
Fig 4
PTEN activity and PI3K signaling in natural Treg cells. A, FACS-sorted Treg cells (CD4+CD25highCD127low) and Tmem cells (CD4+CD45RO+CD127highCD25low) were left unstimulated or subjected to anti-CD3/CD28 and IL-2 stimulation for 10 minutes. Cellular levels of pAKT, pS6, and phosphorylated signal transducer and activator of transcription 5 (pSTAT5) in each cell type with or without stimulation were analyzed by using Phosflow. B and C, PBMCs from healthy donors were rested or stimulated for 24 hours with anti-CD3 and anti-CD28 T-cell activator beads in the presence of IL-2. PTEN expression in FOXP3 nonregulatory and FOXP3+ Treg cell populations among total PBMCs was measured by using FACS to detect changes in PTEN protein levels after TCR and IL-2 receptor stimulation. D, MALT sections were stained for FOXP3+ cells, as well as phosphorylation of the S6 ribosomal protein (p[Ser235/236]S6). Scale bar = 50 μm. E, Percentage of pS6+ expressing cells among FOXP3+ cells in patients with PHTS versus control subjects determined by using immunohistochemical staining. Symbols represent individual patients, and lines represent means. Differences were analyzed by using the Mann-Whitney U test. F, Multiplex ligation-dependent probe amplification copy number analysis revealing a microdeletion spanning from exon 2 to exon 9 and a 3′ untranslated region (UTR) of PTEN. Protein representation of a wild-type (wt) subject and a patient with PHTS with the microdeletion (del E2-9) are shown for comparison. G, PTEN expression in CD3+ T cells from a control donor or a patient with PHTS (del E2-9, PTEN microdeletion) was determined by using FACS with an mAb that recognizes the C-terminal region of PTEN, allowing selective detection of the nonmutated copy of PTEN protein. PTEN levels were measured in cells with or without anti-CD3/CD28 and IL-2 stimulation for 24 hours.
Fig 5
Fig 5
Functional complementation between PTEN and PHLPP in Treg cells. A, Effects of small-molecule inhibitors of PTEN, PHLPP, SHIP1, SHIP2, and PP2A on iTreg cell differentiation in vitro. CD4+ naive human T cells were cultured for 4 days in the presence of various inhibitors under iTreg cell–inducing conditions. A dimethyl sulfoxide concentration-matched control was used. Total numbers of CD4+FOXP3+ cells for each condition at the end of the 4-day culture are shown. Bars represent means ± SDs for a culture performed in quadruplicate. Results are representative of 3 independent experiments. iTreg cell induction was performed at medium TCR stimulation signal strength (1 bead: 2 cells). B, Effects of TCR stimulation signal strength on the extent of blockade of iTreg cell generation by inhibitors of PTEN or PHLPP. C, Representative FACS plots demonstrating the effects of the PTEN and PHLPP inhibitors on iTreg cell differentiation. D and E, Mitochondrial depolarization in blood Treg cells after PTEN and/or PHLPP inhibition. Mitochondrial membrane potential was measured by using the TMRE assay in CD4+CD25highCD127low Treg cells treated with a PTEN inhibitor at 0.4, 2 (IC50), or 4 μmol/L alone or in combination with a PHLPP inhibitor (used at an IC50 of 70 μmol/L). Dimethyl sulfoxide concentrations are equal in all conditions. Data are pooled from 8 healthy donors. Each point represents 1 donor, and differences have been assessed by using the Mann-Whitney U test. F, Mitochondrial depolarization in blood Treg cells from patients with PHTS and control subjects. TMRE fluorescence in Treg cells is shown as a histogram and quantified.
Fig 6
Fig 6
Phosphatase and NHERF1 assembly at the immunologic synapse. A-C, Laser-scanning microscopy of CD4+CD25+ T cells stimulated on CD3- and ICAM-1–coated glass slides. Time-dependent accumulation of PHLLP, PTEN, and NHERF1 after anti-CD3–mediated TCR activation was assessed by measuring protein accumulation in the planar layer adjacent to the glass slide. Exposure to ICAM-1 without TCR engagement served as a negative control. Dots represent individual cells analyzed. D, PTEN, NHERF1, and PHLLP subcellular localization in relation to the central supramolecular activation complex (indicated by CD3 staining) and peripheral supramolecular activation complex (indicated by ICAM-1 staining) was analyzed by using TIRF microscopy. Differences were analyzed by using the Mann-Whitney U test.

References

    1. Okkenhaug K. Signaling by the phosphoinositide 3-kinase family in immune cells. Annu Rev Immunol. 2013;31:675–704. - PMC - PubMed
    1. Suzuki A., Yamaguchi M.T., Ohteki T., Sasaki T., Kaisho T., Kimura Y. T cell-specific loss of Pten leads to defects in central and peripheral tolerance. Immunity. 2001;14:523–534. - PubMed
    1. Newton R.H., Turka L.A. Regulation of T cell homeostasis and responses by pten. Front Immunol. 2012;3:151. - PMC - PubMed
    1. Walsh P.T., Buckler J.L., Zhang J., Gelman A.E., Dalton N.M., Taylor D.K. PTEN inhibits IL-2 receptor-mediated expansion of CD4+ CD25+ Tregs. J Clin Invest. 2006;116:2521–2531. - PMC - PubMed
    1. Huynh A., DuPage M., Priyadharshini B., Sage P.T., Quiros J., Borges C.M. Control of PI(3) kinase in Treg cells maintains homeostasis and lineage stability. Nat Immunol. 2015;16:188–196. - PMC - PubMed

Publication types

MeSH terms