. 2016 Aug 11;166(4):963-976.
doi: 10.1016/j.cell.2016.06.056. Epub 2016 Jul 28.

NRF2 Promotes Tumor Maintenance by Modulating mRNA Translation in Pancreatic Cancer

Affiliations

NRF2 Promotes Tumor Maintenance by Modulating mRNA Translation in Pancreatic Cancer

Iok In Christine Chio et al. Cell. .

Abstract

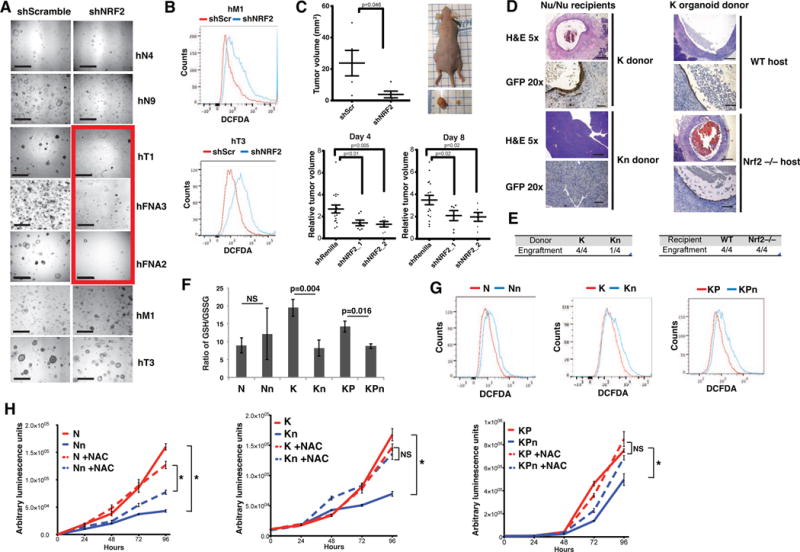
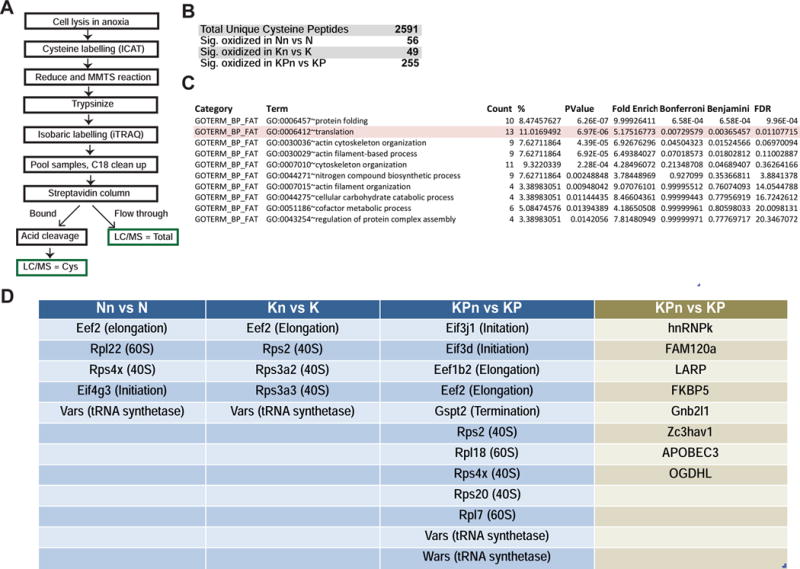
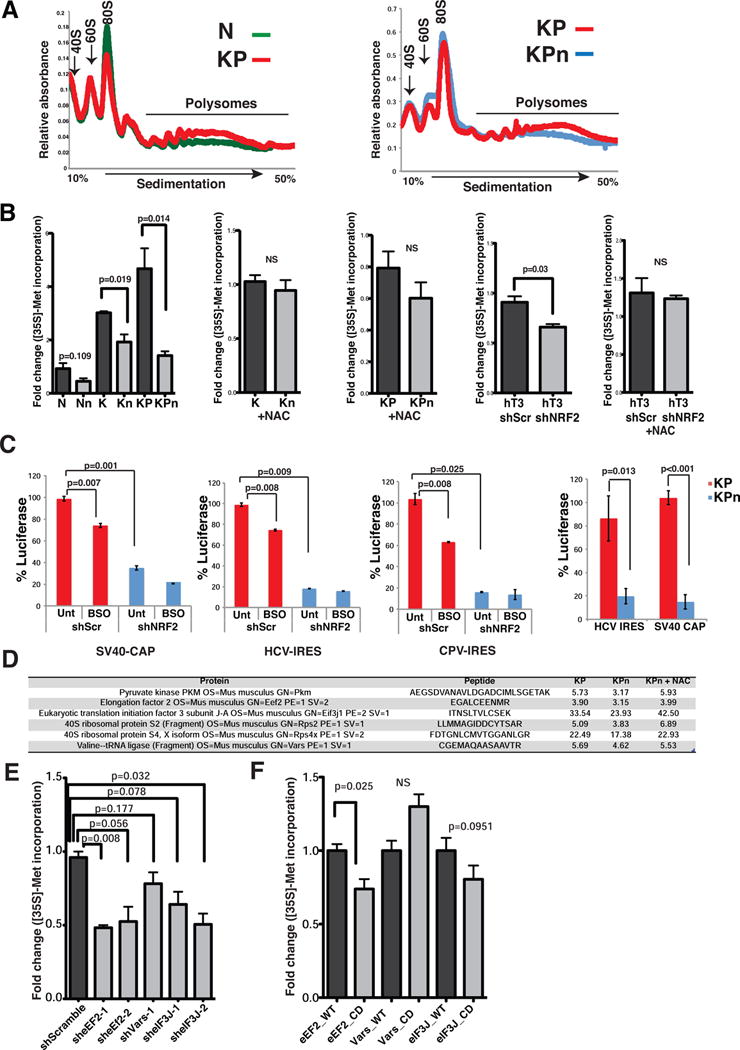
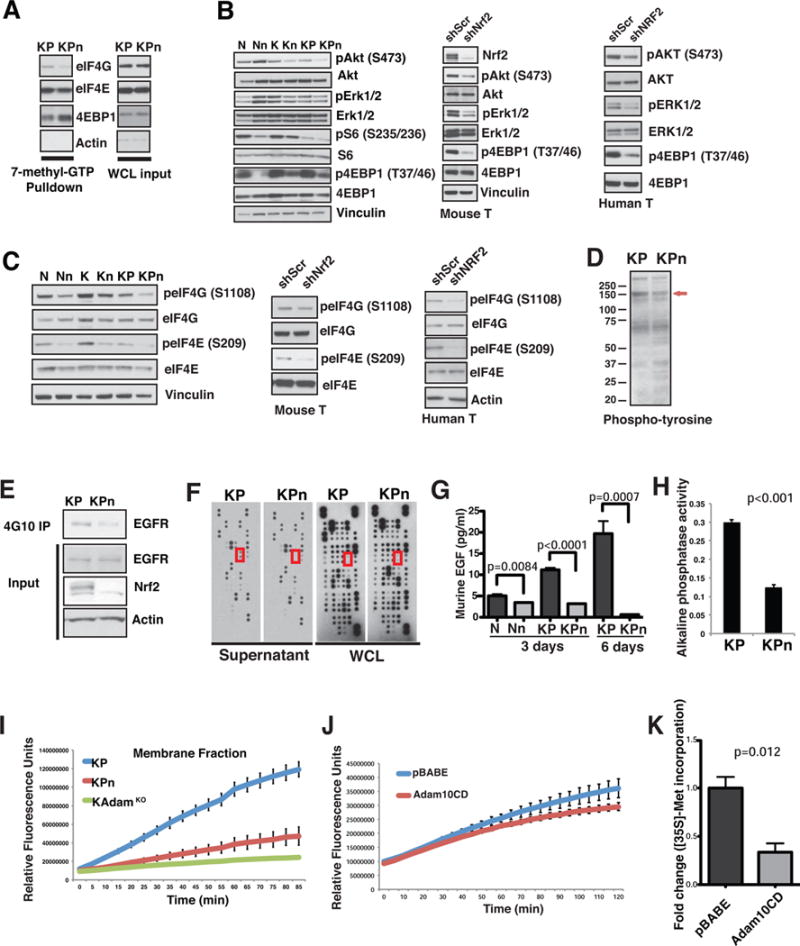
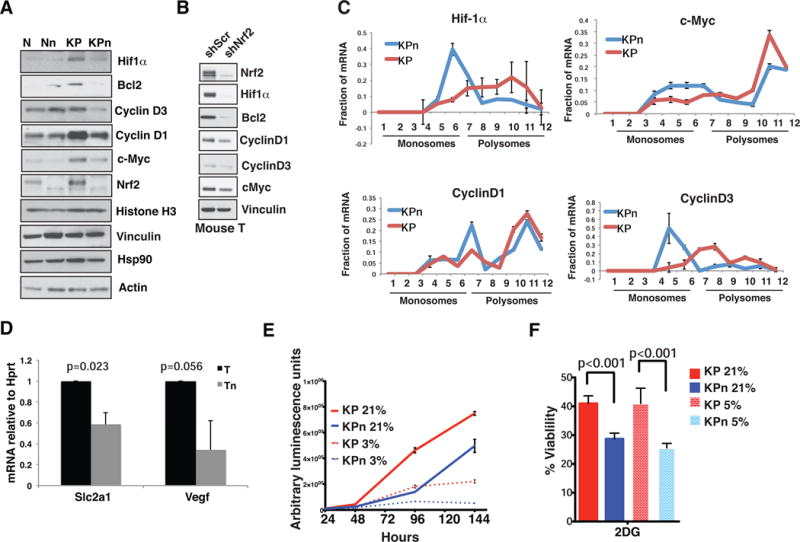
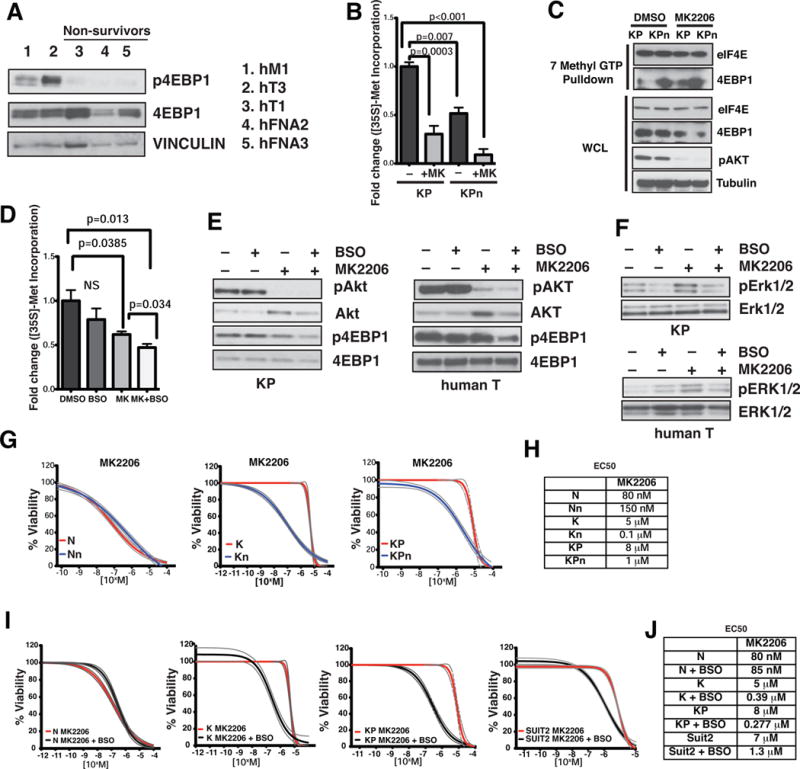
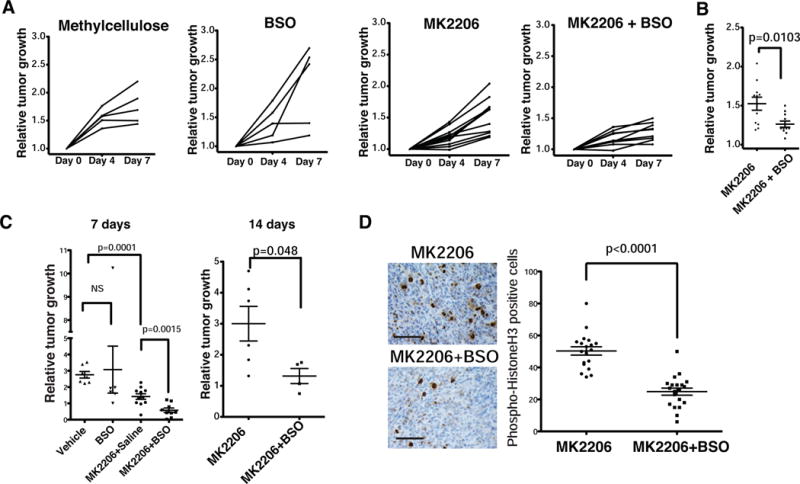
Pancreatic cancer is a deadly malignancy that lacks effective therapeutics. We previously reported that oncogenic Kras induced the redox master regulator Nfe2l2/Nrf2 to stimulate pancreatic and lung cancer initiation. Here, we show that NRF2 is necessary to maintain pancreatic cancer proliferation by regulating mRNA translation. Specifically, loss of NRF2 led to defects in autocrine epidermal growth factor receptor (EGFR) signaling and oxidation of specific translational regulatory proteins, resulting in impaired cap-dependent and cap-independent mRNA translation in pancreatic cancer cells. Combined targeting of the EGFR effector AKT and the glutathione antioxidant pathway mimicked Nrf2 ablation to potently inhibit pancreatic cancer ex vivo and in vivo, representing a promising synthetic lethal strategy for treating the disease.


Figures

Figure 1
Figure 1. Nrf2 controls redox homeostasis, initiation and maintenance of pancreatic tumors
(A) Human normal (N) and tumor (T) (T= primary tumor, FNA=fine needle biopsy, M=metastasis) organoid lines following knockdown with control (shScramble) or shNRF2 hairpins. Scale bar = 1mm. Red box: human T organoid lines that did not tolerate NRF2 loss. (B) ROS levels in human T organoids measured with CM-H2DCFDA. (C) Tumor volume of subcutaneously xenografted Suit2 cells bearing control or shNRF2 hairpins. Top panel, constitutive knockdown (n=5) on day 28. Left flank: control tumor; right flank: shNRF2 tumor. Bottom panel, inducible knockdown 21 days post transplantation followed by doxycycline treatment for 4 or 8 days (n=17 control, n=6 mice per shNRF2 hairpin, Student’s t-test.) (D) Hematoxylin and eosin (H&E), and immunohistochemistry (IHC) of orthotopic transplants of GFP-expressing K and Kn organoids into athymic nude mice 2 weeks after transplantation (left). H&E and IHC of orthotopic, syngeneic transplants of K organoids into B6 wildtype or Nrf2−/− mice 2 weeks after transplantation (right). 5X scale bar = 500 μm, 20X scale bar = 100 μm. (E) Engraftment rates of orthotopic transplants. (F) Ratio of reduced (GSH) to oxidized (GSSG) glutathione in murine organoids (n=3, Student’s t-test). (G) ROS levels in murine organoids measured with CM-H2DCFDA, representative from 3 biological replicates. (H) Proliferation of N, K and KP organoids grown in reduced media with or without 1.25 mM NAC. Data are mean +/− s.e.m. (n=5). *= p<0.05, NS= p>0.05, Student’s t-test. See also Figure S1.
Figure 2
Figure 2. Nrf2 deficiency induces cysteine oxidation of components of the translation machinery
(A) Schematic of cysteine proteomics approach. (B) Significant cysteine peptide changes identified in N, K and KP organoids compared to Nrf2-null counterparts. p<0.05, Welch’s t-test. (C) DAVID gene ontology analysis for pathway enrichment of significantly oxidized peptides in KPn organoids compared to KP organoids. (D) Proteins in the core translation machinery (blue) and regulators of mRNA translation (green) that were significantly oxidized (Welch’s t-test, p < 0.05) in Nrf2-deficient N, K and KP organoids. See also Figure S2 and Tables S1–4.
Figure 3
Figure 3. Nrf2 deficiency impairs protein synthesis
(A) Polysome profiles of N, KP and KPn organoids treated with 300 μg/ml cycloheximide for 10 min. Absorbance light at 254 nm. Representative profiles from two biological replicates. (B) [35S]-Met incorporation into protein from murine and human organoids grown in reduced media or in media containing 1.25 mM NAC. Data are mean +/− s.e.m (n=3, Student’s t-test). NS = not significant. (C) Activities of Renilla and firefly luciferase in Suit2 cells bearing shScr or shNRF2 (left three graphs) or KP, KPn organoids (rightmost) transfected with the biscistronic reporter plasmid 24 hrs prior. Data are percentage luciferase activity driven by SV40-CAP, HCV-IRES or CPV-IRES. Data are mean +/− s.d. (n=3, Student’s t-test). (D) Cysteine peptide counts of translational regulatory proteins in KP, KPn and KPn organoids supplemented with 1.25 mM NAC (average of 2 biological replicates). (E–F) [35S]-Met incorporation into protein from murine T organoids bearing shRNA (E) or V5-tagged wildtype (WT) or cysteine mutated (CD) cDNAs of indicated proteins (F). Data are mean +/− s.e.m. (n=6, Student’s t-test). See also Figure S3.
Figure 4
Figure 4. Nrf2 deficiency impairs mitogenic signaling pathways governing eIF4F complex formation
(A) Lysates from KP and KPn organoids were subjected to 7-methyl-GTP pulldowns, and analysed for indicated proteins. WCL, whole cell lysates. (B–C) Immunoblot analysis for growth factor signaling pathway activation (B) and mRNA cap-binding proteins (C) in N, K, KP organoids as well as murine tumor (T) and human tumor (hM1, hT3) organoids with shScr or shNRF2. p=phospho. (D–E) Immunoblot analysis of total (D) and EGFR tyrosine (Y) phosphorylation (E) in KP and KPn organoids. Red arrow, 150 kD molecular weight protein. 4G10 IP, total phospho-Y antibody immunoprecipitation. (F) Protein array analysis for growth factors secreted into culture medium (Supernatant) and expressed in whole cell lysate (WCL) in KP and KPn organoids. Red box, murine EGF. (G) EGF ELISA of supernatant from N, Nn, KP and KPn organoids after 3 or 6 days in culture. Data are mean +/− s.d. (n=3, Student’s t-test). (H) Constitutive EGF shedding determined by alkaline phosphatase activity in the supernatant from KP organoids. Data are mean +/− s.d. (n=3, Student’s t-test). (I–J) Activity of Adam10 from plasma membrane fractions of KP, KPn and K;Adam10 KO organoids (I) or KP organoids expressing control vector versus Adam10 cysteine mutant (CD) (J), measured by cleavage and increase in 5-FAM fluorescence of a FRET substrate specific to Adam10. Activity was monitored over 2 hrs at excitation excitation/emission = 490 nm/520 nm. Data are mean +/− s.d. (n=2). (K) [35S]-Met incorporation into protein from KP organoids expressing control vector or Adam10 cysteine mutant (CD). Data are mean +/− s.d. (n=6, Student’s t-test). See also Figure S4.
Figure 5
Figure 5. Nrf2 supports translation of pro-survival transcripts
(A–B) Immunoblot analysis of oncoproteins in N and KP organoids (A) and murine T organoids (B) expressing shScramble or shNrf2. (C) qPCR analysis of indicated mRNAs from polysome fractions of KP and KPn organoids. ΔCT calculated against 80S fraction. Data are means normalized against the sum +/− s.d. (n=2 biological replicates). Fractions 1–6: Monosomes; 7–12: Polysomes. (D) qPCR analysis of mRNA expression of Hif1α target genes in murine T organoids. Data are mean +/− s.d. (n=3, Student’s t-test). (E) Proliferation of organoids grown in 21% or 3% oxygen. Data are mean +/− s.e.m. (n=5). (F) Cell viability upon treatment with 20 mM 2-deoxyglucose for 72 hours in 21% oxygen or 5% oxygen. Data are mean +/− s.e.m. (n=5, Students t-test.) See also Figure S5.
Figure 6
Figure 6. Inhibition of glutathione synthesis sensitizes pancreatic cancer cells to pan AKT inhibition
(A) Immunoblot analysis of 4EBP1 activation status in human T organoids. VINCULIN, loading control. p = phospho. (B) [35S]-Met incorporation into protein from KP and KPn organoids treated with DMSO or 1 μM MK2206 (MK) for 48 hrs. Data are mean +/− s.e.m. (n=3, Student’s t-test.). (C) Lysates from KP and KPn organoids treated with DMSO or 1 μM MK2206 were subjected to 7-methyl-GTP pulldowns, and analyzed for indicated proteins. (D) [35S]-Met incorporation into protein from KP organoids treated with 1 μM MK2206 (MK), 100 μM BSO, or in combo for 48 hrs. Data are mean +/ s.e.m. (n=3, Student’s t-test.). (E) Immunoblot analysis of AKT and 4EBP1 activation status in murine (left) and human hT1 (right) T organoids treated with 1 μM MK2206 (MK), 100 μM BSO, or in combo for 48 hrs. p = phospho. (F) Adaptive response in KP organoids (top) and human T organoids (bottom) upon treatment with vehicle only, 1 μM MK2206, 100 μM BSO, or in combination for 48 hrs. p = phospho. (G) Cell viability of N, K and KP and the corresponding Nrf2-deficient organoids over increasing concentrations of MK2206 for 72 hours. Dotted lines, 95% confidence intervals. (n=5). (H) EC50 values of MK2206 in murine organoids. (I) Cell viability of N, K, KP organoids and Suit2 cells over increasing concentrations of MK2206 in the presence or absence of BSO for 72 hours. Dotted lines, 95% confidence intervals. (n=5). (J) EC50 values of MK2206 on pancreatic organoids and cell lines in the presence or absence of BSO. See also Figure S6.
Figure 7
Figure 7. Combined inhibition of AKT and glutathione synthesis suppresses human and mouse pancreatic tumor growth in vivo
(A) Tumor volumes of KPC mice treated daily with vehicle (methylcellulose), BSO, MK2206, or the combination for 7 days. Tumor volumes were determined by ultrasound imaging on the indicated days. (B) Relative tumor volume of KPC mice treated with MK2206 or in combination with BSO on day 7. Student’s t-test. (n=11). (C) Relative growth of subcutaneously xenografted Suit2 tumors in mice treated with vehicle, MK2206, or MK2206+BSO for 7 days (left) or 14 days (right). Data are mean +/− s.e.m. Student’s t test. (D) Phospho-histone H3 IHC of representative Suit2 tumors from treated mice (Left). Quantification of pH3 positivity (Right). Data are mean +/− s.e.m (n ≥ 5 fields of view). Student’s t-test. See also Figure S7.

Comment in

References

    1. Anastasiou D, Poulogiannis G, Asara JM, Boxer MB, Jiang JK, Shen M, Bellinger G, Sasaki AT, Locasale JW, Auld DS, et al. Inhibition of pyruvate kinase M2 by reactive oxygen species contributes to cellular antioxidant responses. Science. 2011;334:1278–1283. - PMC - PubMed
    1. Ardito CM, Gruner BM, Takeuchi KK, Lubeseder-Martellato C, Teichmann N, Mazur PK, Delgiorno KE, Carpenter ES, Halbrook CJ, Hall JC, et al. EGF receptor is required for KRAS-induced pancreatic tumorigenesis. Cancer Cell. 2012;22:304–317. - PMC - PubMed
    1. Bar-Sagi D, Feramisco JR. Induction of membrane ruffling and fluid-phase pinocytosis in quiescent fibroblasts by ras proteins. Science. 1986;233:1061–1068. - PubMed
    1. Barford D. The role of cysteine residues as redox-sensitive regulatory switches. Current opinion in structural biology. 2004;14:679–686. - PubMed
    1. Belalcazar AD, Ball JG, Frost LM, Valentovic MA, Wilkinson JT. Transsulfuration Is a Significant Source of Sulfur for Glutathione Production in Human Mammary Epithelial Cells. ISRN biochemistry. 2014;2013:637897. - PMC - PubMed

Publication types