. 2016 Aug 1:7:12327.
doi: 10.1038/ncomms12327.

Predictive decision making driven by multiple time-linked reward representations in the anterior cingulate cortex

Affiliations

Predictive decision making driven by multiple time-linked reward representations in the anterior cingulate cortex

Marco K Wittmann et al. Nat Commun. .

Abstract

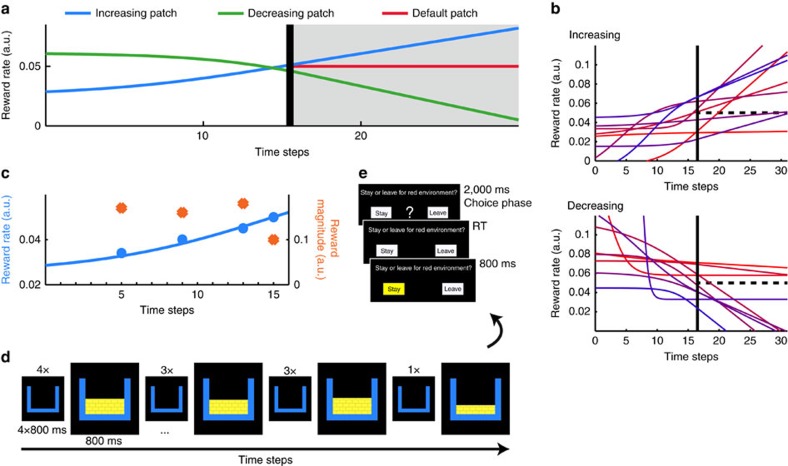
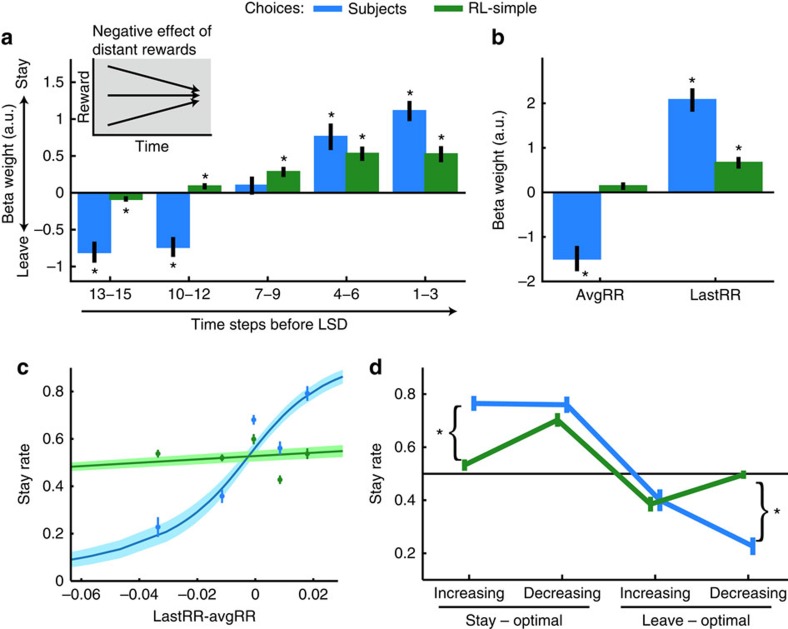
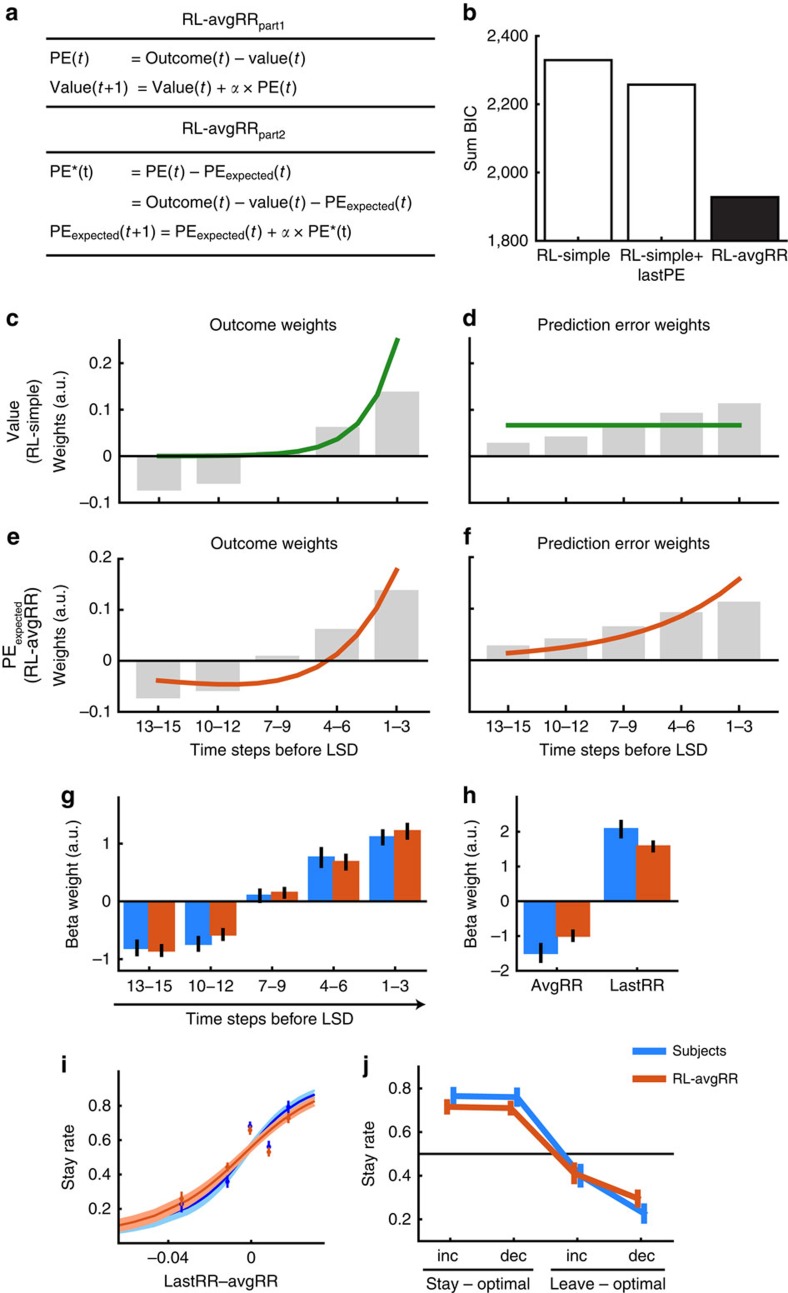
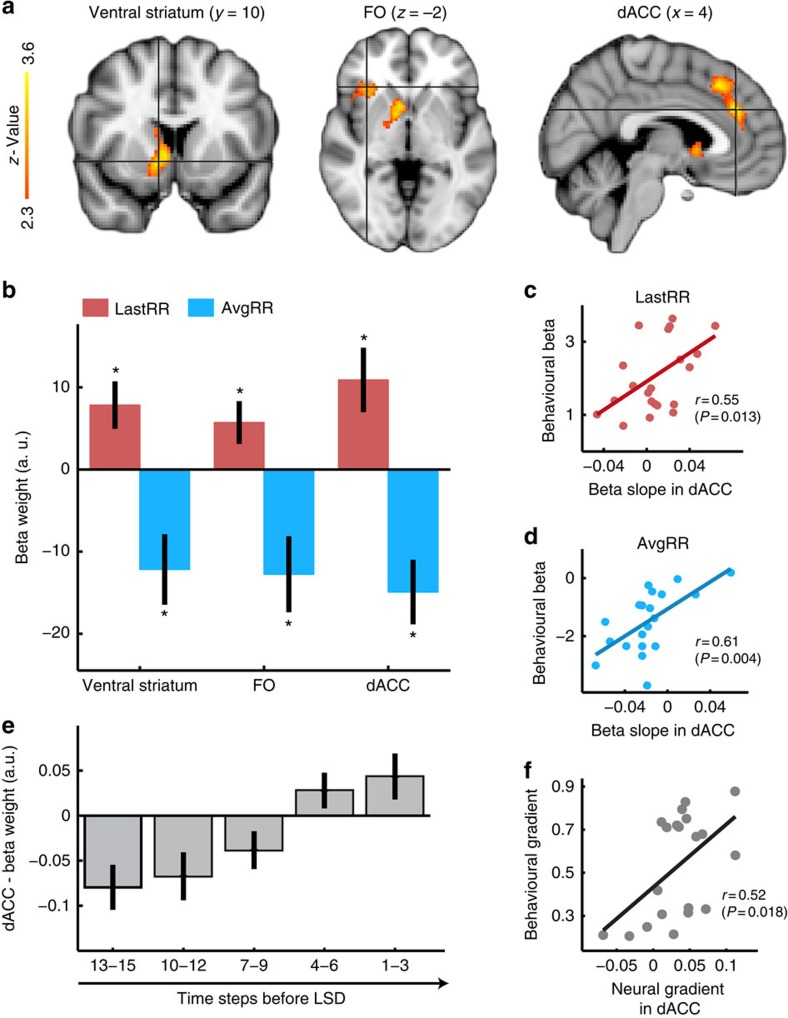
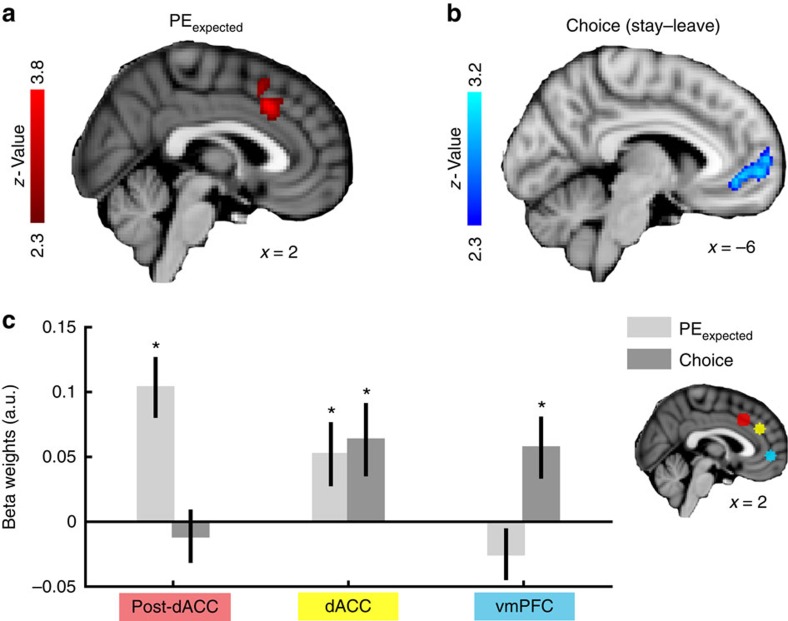
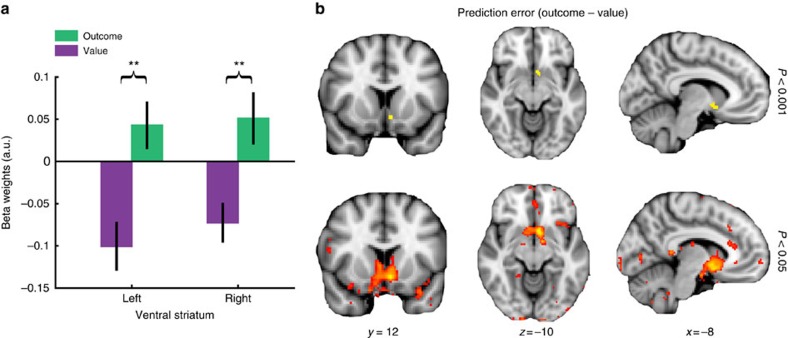
In many natural environments the value of a choice gradually gets better or worse as circumstances change. Discerning such trends makes predicting future choice values possible. We show that humans track such trends by comparing estimates of recent and past reward rates, which they are able to hold simultaneously in the dorsal anterior cingulate cortex (dACC). Comparison of recent and past reward rates with positive and negative decision weights is reflected by opposing dACC signals indexing these quantities. The relative strengths of time-linked reward representations in dACC predict whether subjects persist in their current behaviour or switch to an alternative. Computationally, trend-guided choice can be modelled by using a reinforcement-learning mechanism that computes a longer-term estimate (or expectation) of prediction errors. Using such a model, we find a relative predominance of expected prediction errors in dACC, instantaneous prediction errors in the ventral striatum and choice signals in the ventromedial prefrontal cortex.


Figures

Figure 1
Figure 1. Experimental design and implementation.
(a) Two example patches with increasing (blue) and decreasing (green) reward rates. At LSDs (black) subjects chose between staying in the patch and switching to a default patch with a stable reward rate (red). In these examples, correct decisions (stay on blue, leave green) can be predicted from the reward rate curves. (b) All 18 reward rate curves from which trials were derived. Solid black line indicates LSD and vertical dashed line indicates reward rate of reference patch. For visualization purposes only, different colouring for reward rate curves was used, and the curves were aligned so that the LSD is on the same time step. (c) Sequence of events corresponding to the blue reward rate curve before LSD in a. Four reward events were presented at time steps 5, 9, 13 and 15. Their reward rates (blue dots), which conform to the reward rate curve (blue line), are calculated by dividing their reward magnitudes (orange dots) by the time delay from the previous reward event or the start of the patch. (d) Screen during events in c. Empty boxes represent non-reward events; the height of ‘gold bars' in reward events represent their reward magnitudes. Each event was displayed for 800 ms. Between events, a fixation cross was shown and subjects proceeded to the next event by pressing a button. Note that lastRR for this patch would be equivalent to the height of the gold bars in the final box divided by two time steps. (e) LSD followed, without time jitter, after the last reward event (boxes in the default environment were red; therefore, it was labelled ‘red environment' for subjects).
Figure 2
Figure 2. Recent and past reward rates influence choice in an opposing manner.
(a) GLM predicting stay choices. Binning the reward history into bins of three time steps relative to the LSD (LSD-1-3, LSD-4-6 and so on) revealed the influence of discrete previous time steps on choice. Opposing effects of recent and past rewards emerged gradually in subjects' behaviour (blue). A simple-RL model (green) captured positive effects of recent rewards but failed to represent distant rewards as negatively as subjects did. Inset: the reason for the negative impact of early rewards becomes particularly clear when keeping recent rewards stable. The reward trajectory points more upwards the lower its starting position. (b) GLM predicting stay choices. As in a, reward rate trend-guided behaviour can be explained by a positive effect of a patch's most recent value (lastRR) in combination with a negative effect of reward rates in the past (avgRR). RL-predicted choices (green) captured part of the positive influence of lastRR on human subjects (blue), but failed to represent avgRR negatively. (c) Softmax functions of subjects' actual (blue) and RL-simple predicted (green) stay rates plotted against lastRR–avgRR illustrates that, overall, subjects' choices were influenced by the reward rate change in contrast to RL-simple. Overlaid are binned actual and RL-predicted stay rates. (d) Stay rates plotted by optimal choice and categorical reward rate trend. The simple-RL model's choices (green) were close to random when the reward rate trend was predictive of the optimal choice (stay/increasing and leave/decreasing). It performed similar to subjects (blue) when the reward rate trend had to be ignored. (*P<0.0001; error bars are s.e.m. between subjects).
Figure 3
Figure 3. RL-avgRR explains reward rate trend-guided choices.
(a) Equations used in RL-avgRR. (b) Summed Bayesian information criterion (BIC) scores for RL-avgRR were lower than RL-simple and RL-simple+lastPE, indicating better model fit. (cf) Comparison of past outcome and PE weights used by a standard value estimate and PEexpected at the time of choice (same x-axis in all plots). Grey bars indicate the weights of influence that past outcomes (c,e, same data) and past PEs (d,f, same data) had on subjects' decision to stay in a patch. The lines indicate the amount of influence past events had on the calculation of a simple value estimate (from RL-simple; green line) and PEexpected (from RL-avgRR; orange line). Note that the empirically determined weights correspond qualitatively to the weights used by RL-avgRR, but not to RL-simple. While simple value estimates are a recency-weighted sum of past outcomes (c), expected PEs are highest when encountering high rewards after initially poor outcomes (negative than positive weighting, e). The same information as in c,e can be presented as a function of PEs for RL-simple (d) and RL-avgRR (f). Again, the influence of past PEs on subjects' choices are qualitatively similar to the way PEexpected is calculated from past PEs. (gj) Analyses from Fig. 2 were repeated for RL-avgRR. Unlike RL-simple (Fig. 2), RL-avgRR made choice predictions (orange) that were similar to subjects' actual choices (blue). Note, in particular, how the weights in 3 g mimic the theoretical weights shown in e and that RL-avgRR is able to represent past rewards negatively. See Fig. 2 for legends.
Figure 4
Figure 4. Opposing effects of recent and past reward rates in dACC predict choice.
(a) A whole-brain contrast lastRR−avgRR time-locked to the LSD revealed three areas in which a more positive reward rate trend led to more activity: dorsal anterior cingulate cortex (dACC), right frontal operculum (FO) and right ventral striatum. (Family-wise error cluster-corrected, z>2.3, P<0.05). (b) ROI analyses of the three areas (using leave-one-out procedures) show separate neural responses to lastRR and avgRR. For all areas, extracted beta weights indicate that lastRR had a positive effect, while avgRR had a negative effect. (c,d) In dACC, the slopes of the behavioural beta weights for both lastRR (c) and avgRR (d) were predictive of how much the respective recent and past reward rates influenced subjects' choices. Neither of the other areas showed either correlation. (e) In dACC, we validated the results found in b by analysing the neural effects of reward rates presented in discrete time bins before the LSDs (analogous to the behavioural analysis in Fig. 2a). We found a temporal gradient of reward effects on BOLD activity that was similar to the temporal gradient of reward effects on behaviour in Fig. 2. (f) Using this alternative analysis approach, we were again able to confirm a relationship between dACC activity and behaviour; in dACC, but in neither of the other areas, the gradient of neural responses to past rewards was predictive of the behavioural gradient (Fig. 2a) characterizing the influence of past rewards on the decision to stay or leave (error bars are s.e.m.; *P<0.05).
Figure 5
Figure 5. Separable representations of choice and decision variables along the ACC.
(a) At the time of choice, activity in a posterior region of the dACC (post-dACC) varied as a function of PEexpected. Activity was largely confined to the anterior rostral cingulate zone. The same was the case previously for dACC activity related to the reward rate trend (Fig. 4a). (b) The vmPFC BOLD signal increased when subjects decided to stay in a patch compared with leaving it. (c) Analysis of BOLD response to the model-based evidence for staying in a patch (PEexpected) and the ensuing choice along an axis of post-dACC (red, from Fig. 5a), a more anterior dACC region (yellow, lastRR−avgRR contrast from Fig. 4a) and vmPFC (blue, from Fig. 5b). Anterior dACC signals encode both PEexpected and the ensuing choice to commit to or leave the patch. Contrarily, post-dACC and vmPFC show only a significant effect of PEexpected and the categorical choice, respectively. Note that the anterior dACC ROI was identified using a leave-one-out procedure. Significance of PEexpected in post-dACC and choice in vmPFC was assessed in the previous whole-brain analysis (Fig. 5a,b). (*P<0.05, one-sample t-test; error bars are s.e.m. between subjects).
Figure 6
Figure 6. Standard PEs in the ventral striatum.
(a) Significant standard PE (outcome minus value) signals in the left and right ventral striatum. ROIs are the same as for the striatal ROI in Fig. 4b as well as the same ROI mirrored to the contralateral side. For each subject and both hemispheres, ROIs were determined via a leave-one-out procedure to avoid spatial bias. (b) Whole-brain PE contrast shown at two thresholds (shown for illustration only). The PE signal is centred on the left ventral striatum (top row; threshold of 0.001, uncorrected). No other brain region showed an equally strong encoding of standard PEs (bottom row; threshold of 0.05, uncorrected). Note that images are shown according to the radiological convention, so left/right is flipped. x/y/z coordinates refer to both images from both rows. (**P<0.01, paired t-test; error bars are s.e.m. between subjects).

References

    1. Charnov E. Optimal foraging: the marginal value theorem. Theor. Popul. Biol. 9, 129–136 (1976). - PubMed
    1. Stephens D. W. & Krebs J. R. Foraging Theory Princeton University Press (1986).
    1. Kira S., Yang T. & Shadlen M. N. A neural implementation of Wald's sequential probability ratio test. Neuron 85, 861–873 (2015). - PMC - PubMed
    1. Boorman E. D., Behrens T. E. J., Woolrich M. W. & Rushworth M. F. S. How green is the grass on the other side? Frontopolar cortex and the evidence in favor of alternative courses of action. Neuron 62, 733–743 (2009). - PubMed
    1. FitzGerald T. H. B., Seymour B. & Dolan R. J. The role of human orbitofrontal cortex in value comparison for incommensurable objects. J. Neurosci. 29, 8388–8395 (2009). - PMC - PubMed

Publication types

LinkOut - more resources