. 2016 Aug 9;7(2):192-206.
doi: 10.1016/j.stemcr.2016.06.013. Epub 2016 Jul 28.

H3K27me3 Does Not Orchestrate the Expression of Lineage-Specific Markers in hESC-Derived Hepatocytes In Vitro

Affiliations

H3K27me3 Does Not Orchestrate the Expression of Lineage-Specific Markers in hESC-Derived Hepatocytes In Vitro

Jolien Vanhove et al. Stem Cell Reports. .

Abstract

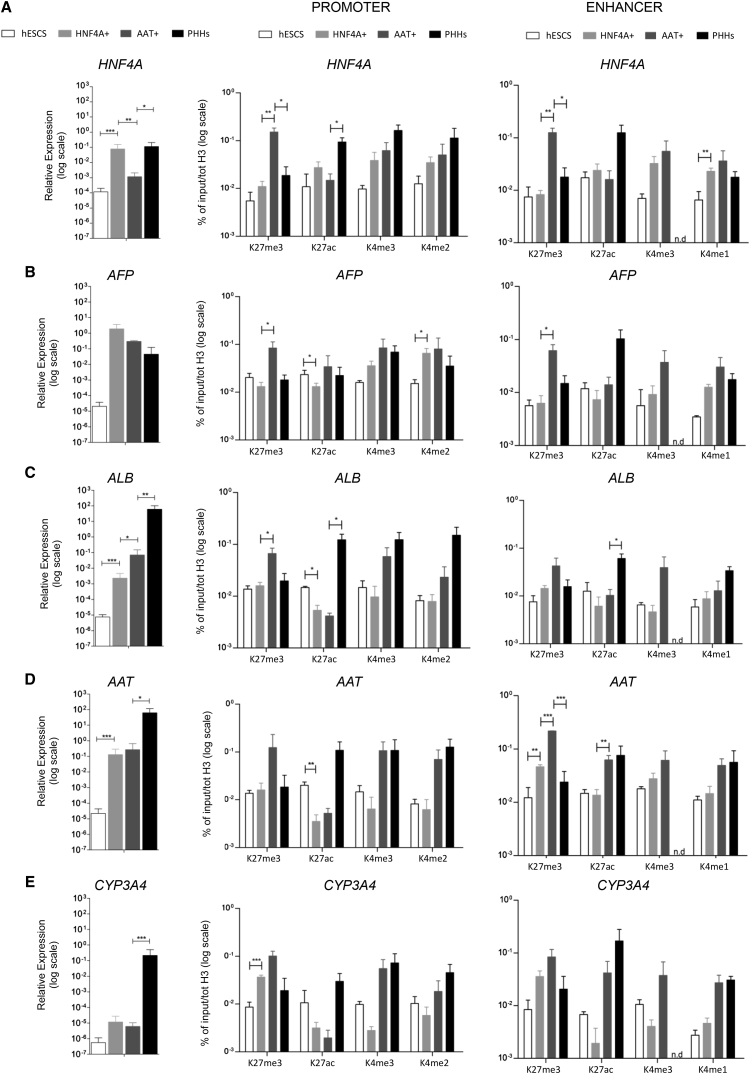
Although pluripotent stem cells can be differentiated into the hepatocyte lineages, such cells retain an immature phenotype. As the chromatin state of regulatory regions controls spatiotemporal gene expression during development, we evaluated changes in epigenetic histone marks in lineage-specific genes throughout in vitro hepatocyte differentiation from human embryonic stem cells (hESCs). Active acetylation and methylation marks at promoters and enhancers correlated with progressive changes in gene expression. However, repression-associated H3K27me3 marks at these control regions showed an inverse correlation with gene repression during transition from hepatic endoderm to a hepatocyte-like state. Inhibitor of Enhancer of Zeste Homolog 2 (EZH2) reduced H3K27me3 decoration but did not improve hepatocyte maturation. Thus, H3K27me3 at regulatory regions does not regulate transcription and appears dispensable for hepatocyte lineage differentiation of hESCs in vitro.


Figures

None
Graphical abstract
Figure 1
Figure 1
hESC-Derived Hepatic Lineage: Two Stages of Lineage Specification Can Be Enriched (A) Schematic overview of the hepatocyte differentiation protocol. (B and C) Representative FACS sorting plots for HNF4A on day 8 (B) and AAT on day 28 (C) (right panels) and corresponding isotype controls (left panels). (D and E) Relative expression (to GAPDH) of OCT4, HNF4A, AFP, ALB, AAT, and CYP3A4 in sorted d8-HNF4A+ (black)/HNF4A (white) cells (D) and d28-AAT+ (black)/AAT (white) cells (E). (F and G) Enrichment of H3K4me3/me2/me1, H3K27ac, and H3K27me3 histone marks at promoters (left panels) and enhancers (right panels) of selected genes in d8-HNF4A+ (black)/HNF4A(white) (F) and d28-AAT+ (black)/AAT (white) cells (G). Data represent mean ± SEM of n ≥ 3 independent experiments. See also Figure S1.
Figure 2
Figure 2
Gene Expression and Histone Modifications in Promoters and Enhancers of Hepatic Marker Genes in hESCs, d8-HNF4A+ Cells, d28-AAT+ Cells, and PHHs Relative gene expression (to GAPDH) (left panels) and epigenetic patterns of H3K4me3/me2/me1, H3K27ac, and H3K27me3 histone modifications at the promoter (middle panels) and enhancer (right panels) of hepatic HNF4A (A), AFP (B), ALB (C), AAT (D), and CYP3A4 (E) genes in hESCs (white), d8-HNF4A+ cells (light gray), d28-AAT+ cells (dark gray), and PHHs (black). Data represent mean ± SEM of n ≥ 3 independent experiments. p < 0.05, ∗∗p < 0.01, ∗∗∗p < 0.001 by Student's t test. Note that both gene expression and histone enrichment for d8-HNF4A+ and d28-AAT+ cells represented are identical to the HNF4A+ and AAT+ data in Figure 1. See also Figure S2.
Figure 3
Figure 3
mRNA Transcript, Protein Levels, and Functional Analysis of hESC-Derived HLCs Treated with or without DMSO (A) Relative gene expression (to GAPDH, log scale) analysis represented in a heatmap of pluripotent, fetal hepatic, mature hepatic, drug transporter, and hepatic TF marker genes in cells treated with or without DMSO, FHs, and PHHs. (B) Representative FACS plots for AAT (right panels) and isotype controls (left panels) on d28-hESC-derived HLCs obtained in the presence or absence of DMSO. (C) Representative immunofluorescence images for HNF4A, AFP, ALB, AAT (magnification 20×; scale bar, 50 μm) on day 20 for cells treated without or with DMSO. (D) Functional CYP3A4 activity in non-treated (black) or DMSO-treated (white) HLCs. (E) Relative gene expression (to GAPDH) for OCT4 and hepatic markers at different time points (days 4, 12, 20, and 28) of differentiation with (white) or without (black) DMSO. Data, except for (C), represent mean ± SEM of n ≥ 3 independent experiments. p < 0.05, ∗∗p < 0.01, ∗∗∗p < 0.001 by Student's t test. See also Figure S3.
Figure 4
Figure 4
Chromatin Modifications at Promoters and Enhancers of FACS-Sorted HNF4A+ and AAT+ Cells Treated with or without DMSO (A and C) Relative gene expression (to GAPDH) of pluripotent and hepatic marker genes in d8-HNF4A+ cells (A) and d28-AAT+ cells (C) from cultures with (white) or without (black) DMSO. Data represent mean ± SEM of n = 3 independent experiments. (B and D) Enrichment of H3K4me3/me2/me1, H3K27ac and H3K27me3, and POL2RA at promoters (left panels) and enhancers (right panels) of OCT4, HNF4A, AFP, ALB, AAT, and CYP3A4 genes in d8-HNF4A+ cells (B) and d28-AAT+ cells (D) treated either without (HNF4A+/AAT+−DMSO, black) or with DMSO (HNF4A+/AAT++DMSO, white). Note that HNF4A+−DMSO and AAT+−DMSO data represented in these graphs are identical to the HNF4A+ and AAT+ data in Figure 2. Data represent mean ± SD of n ≥ 2 independent experiments. See also Figure S4.
Figure 5
Figure 5
Effect of EZH2 Inhibition on hESC-Derived HLCs Treated with or without DMSO on H3K27me3 Enrichment, Protein, and Transcript Levels (A) Schematic overview of EZH2 function and effect of GSK-343. (B) Schematic overview of hepatocyte differentiation protocol with the time frame (days 6–16) in which 1 μM GSK-343 (referred to as EZH2 inhibitor [EZH2i]) was added. (C) Western blot for H3K27me3 in FACS-sorted AAT+ cells at day 28 obtained by both differentiation protocols in the presence or absence of the EZH2i. The molecular weight size marker was cropped from the gel. (D) Graphs represent fold change enrichment of H3K27me3 at promoters and enhancers OCT4 and hepatic markers in EZH2i-treated (black bars) compared with non-treated cells (line) in both d28-AAT+ sorted cells with or without DMSO. (E) Relative gene expression (to GAPDH) profile of OCT4 and hepatic markers in both differentiation protocols treated with (white) or without (black) EZH2i. (F and G) Percent AAT+ cells (by FACS) (F) and percent HNF4A+ cells (by ICC) (G) in EZH2i-treated (bars) compared with non-treated cells (line) in d28 progeny with or without DMSO. Data, except for (C), represent mean ± SEM of n = 3 independent experiments. p < 0.05 by Student's t test. See also Figure S5.

References

    1. Aoki R., Chiba T., Miyagi S., Negishi M., Konuma T., Taniguchi H., Ogawa M., Yokosuka O., Iwama A. The polycomb group gene product Ezh2 regulates proliferation and differentiation of murine hepatic stem/progenitor cells. J. Hepatol. 2010;52:854–863. - PubMed
    1. Azuara V., Perry P., Sauer S., Spivakov M., Jorgensen H.F., John R.M., Gouti M., Casanova M., Warnes G., Merkenschlager M. Chromatin signatures of pluripotent cell lines. Nat. Cell Biol. 2006;8:532–538. - PubMed
    1. Bannister A.J., Kouzarides T. Regulation of chromatin by histone modifications. Cell Res. 2011;21:381–395. - PMC - PubMed
    1. Basma H., Soto-Gutierrez A., Yannam G.R., Liu L., Ito R., Yamamoto T., Ellis E., Carson S.D., Sato S., Chen Y. Differentiation and transplantation of human embryonic stem cell-derived hepatocytes. Gastroenterology. 2009;136:990–999. - PMC - PubMed
    1. Baxter M.A., Rowe C., Alder J., Harrison S., Hanley K.P., Park B.K., Kitteringham N.R., Goldring C.E., Hanley N.A. Generating hepatic cell lineages from pluripotent stem cells for drug toxicity screening. Stem Cell Res. 2010;5:4–22. - PMC - PubMed

Publication types

MeSH terms

LinkOut - more resources