. 2016 Sep 1;63(5):898-911.
doi: 10.1016/j.molcel.2016.06.034. Epub 2016 Jul 28.

DNA Breaks and End Resection Measured Genome-wide by End Sequencing

Affiliations

DNA Breaks and End Resection Measured Genome-wide by End Sequencing

Andres Canela et al. Mol Cell. .

Abstract

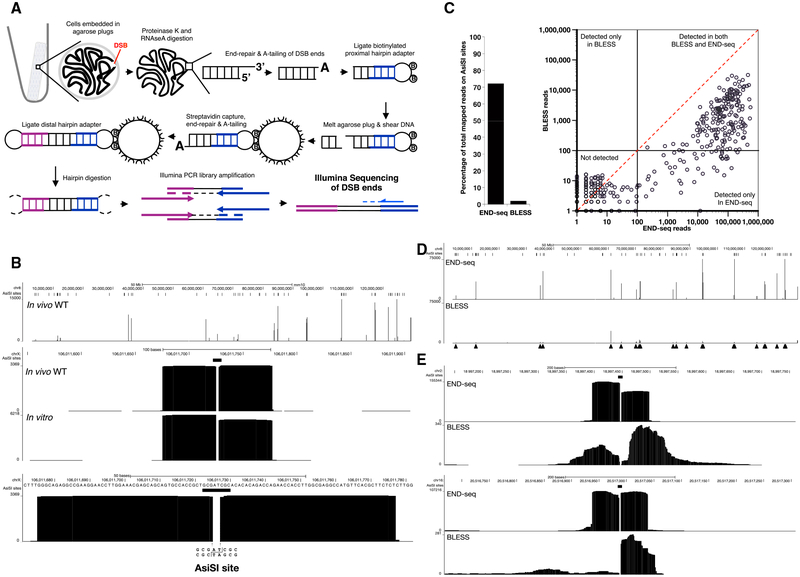
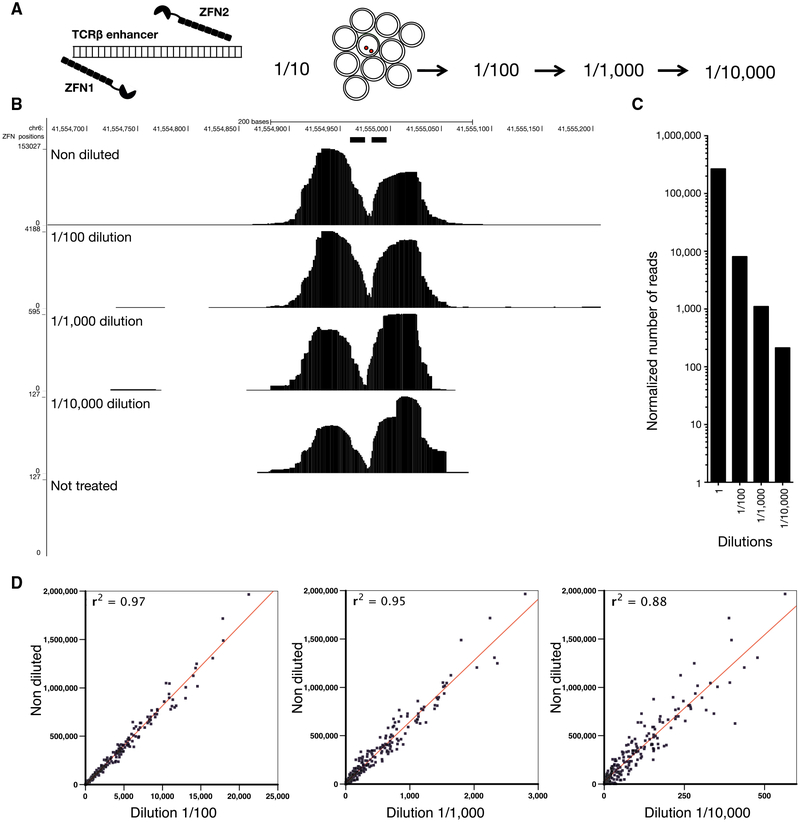
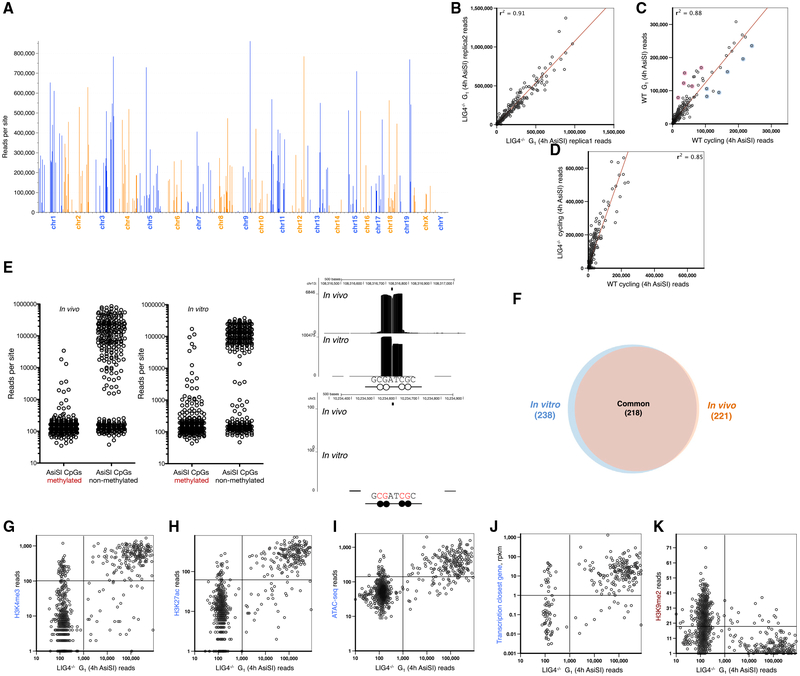
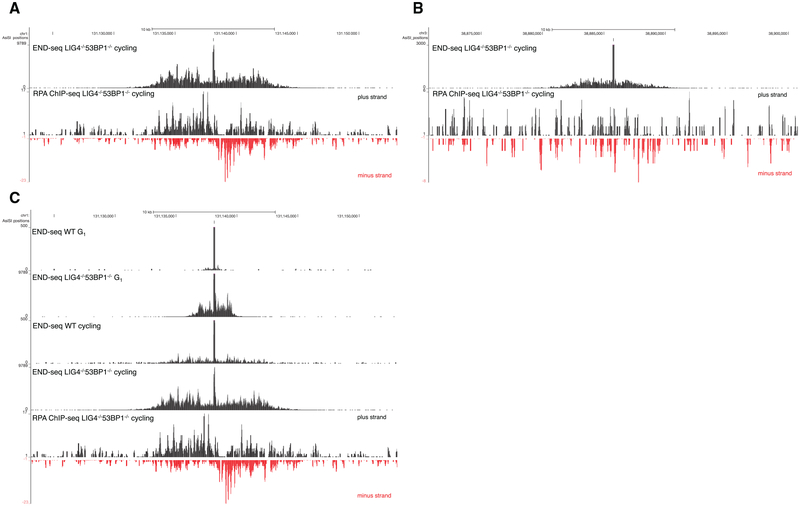
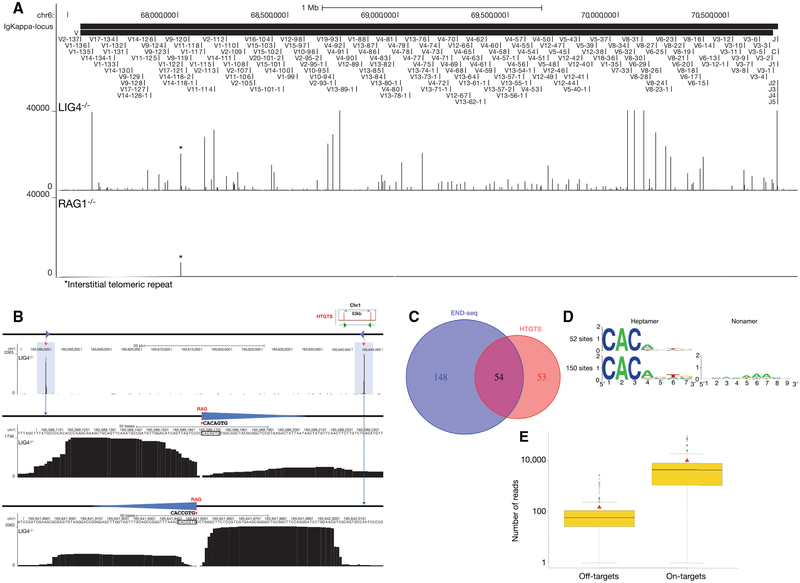
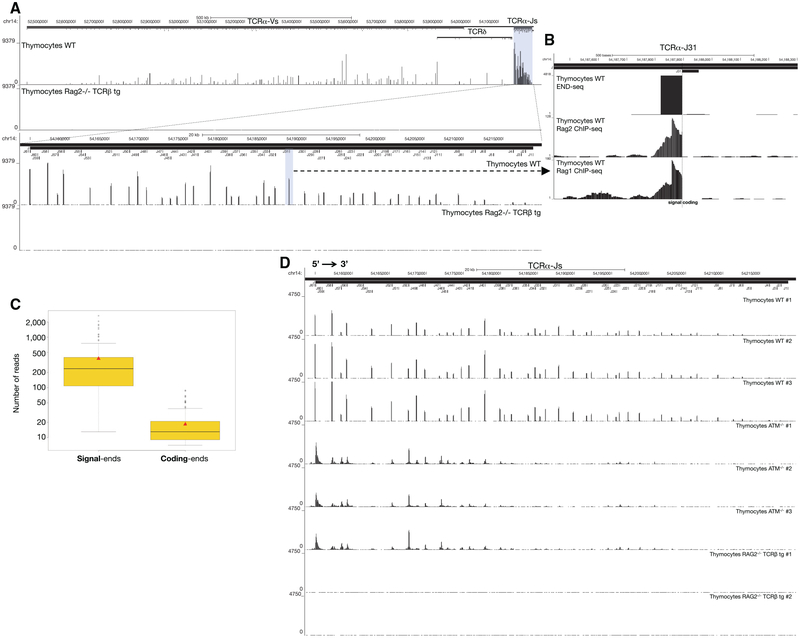
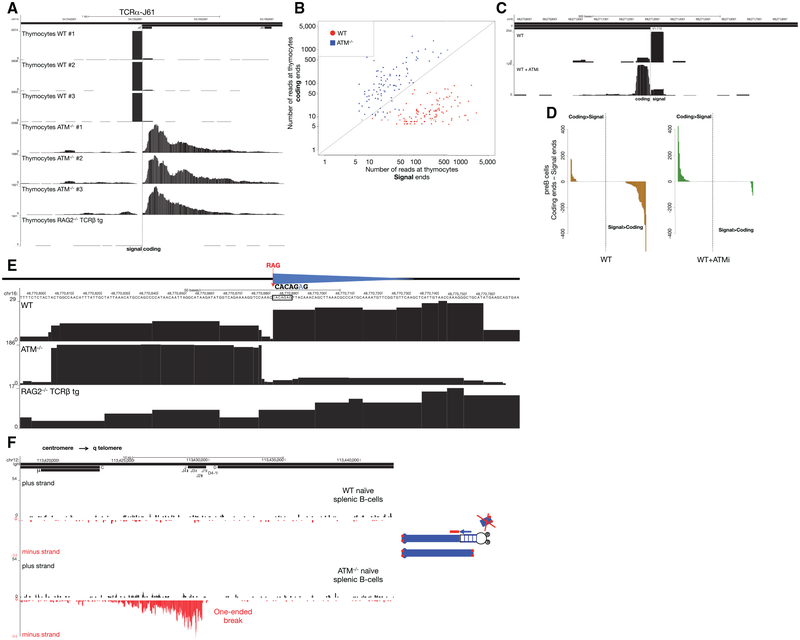
DNA double-strand breaks (DSBs) arise during physiological transcription, DNA replication, and antigen receptor diversification. Mistargeting or misprocessing of DSBs can result in pathological structural variation and mutation. Here we describe a sensitive method (END-seq) to monitor DNA end resection and DSBs genome-wide at base-pair resolution in vivo. We utilized END-seq to determine the frequency and spectrum of restriction-enzyme-, zinc-finger-nuclease-, and RAG-induced DSBs. Beyond sequence preference, chromatin features dictate the repertoire of these genome-modifying enzymes. END-seq can detect at least one DSB per cell among 10,000 cells not harboring DSBs, and we estimate that up to one out of 60 cells contains off-target RAG cleavage. In addition to site-specific cleavage, we detect DSBs distributed over extended regions during immunoglobulin class-switch recombination. Thus, END-seq provides a snapshot of DNA ends genome-wide, which can be utilized for understanding genome-editing specificities and the influence of chromatin on DSB pathway choice.


Figures

Figure 1.
Figure 1.. DNA Breaks Measured by END-Seq
(A) Schematic overview of END-seq. (B) Top panel shows END-seq read coverage for chromosome 8 in G1-arrested WT pre-B cells after 4 hr AsiSI induction. Predicted AsiSI target sites are indicated above by black bars. The y axis corresponds to the number of reads. Middle panel shows END-seq reads corresponding to an AsiSI DSB generated in vivo in pre-B cells or in vitro with purified recombinant AsiSI. Lower panel shows close-up magnification of the cut site, revealing absence of reads at AT overhangs generated by enzymatic digestion. (C) Comparison between END-seq and BLESS in detecting AsiSI DSBs in LIG4−/− pre-B G1-arrested cells. Left panel shows percentage of total reads mapped at AsiSI sites, and the right panel shows the total reads at individual sites plotted on a log scale. Dashed diagonal red line is indicative of the same number of reads detected by both methods. (D) Comparison of END-seq and BLESS detection of AsiSI DSBs on chromosome 8. Filled triangles indicate peaks detected by END-seq. (E) Two examples showing the differences in the symmetry of AsiSI sites detected by END-seq and BLESS. See also Figures S1and S2 and Table S1.
Figure 2.
Figure 2.. Sensitivity of END-Seq
(A) Schematic of a dilution experiment used to determine the limits of END-seq sensitivity using a pair of zinc-finger nucleases (ZFNs). (B) END-seq tracks for undiluted and 10-fold serially diluted samples. y axis represents number of reads. (C) Number of reads within a 240 bp window surrounding the ZFN break in each dilution library normalized by the total number of mapped reads. (D) Comparison between the normalized reads at AsiSI sites in undiluted versus serially diluted samples. ZFN and AsiSI breaks were produced simultaneously in LIG4−/− cells after treating cells with DOX and 4OHT. See also Figure S2 and Table S2.
Figure 3.
Figure 3.. Variation in AsiSI Targeting across the Genome
(A) Number of reads at each AsiSI cut site in the genome in G1-arrested LIG4−/− pre-B cells. A total of 1,088 non-overlapping AsiSI sites are sorted by chromosome position. (B) Comparison of number of reads at each AsiSI site between biological replicas. (C) Comparison of number of reads at each AsiSI site between G1-arrested versus cycling cells. Blue circles highlight AsiSI cut sites with relatively more reads in cycling versus non-cycling cells, and red circles highlight those sites that are more cut in resting cells. Cell-cycle-related genes (Jun, Trps1), genes that are activated in proliferating cells (Dusp5, Mapkk14, Glrx2), or genes with a role in mitosis (Syde2) are blue; genes that inhibit growth or proliferation (Ell2, Gps1, Aurkaip1, Samhd1) or modify histones upon cell-cycle exit (Prmt7) are in red; and AsiSI cut sites are found near the promoters of these genes. (D) Comparison of number of reads at each AsiSI site between WT versus LIG4−/− cycling cells. (E) Number of END-seq reads for each AsiSI site that is cut in vivo (left panel) or in vitro (middle panel) in accordance with the methylation status of the two CpGs within the AsiSI site. Right panels show examples of END-seq reads at a non-methylated (top) and methylated (bottom) AsiSI site in vitro and in vivo. A black circle indicates a methylated CpG and the white circle indicates a non-methylated CpG. (F) Overlap of AsiSI sites produced in vivo or in vitro. (G–K) Correlation between the number of END-seq reads with chromatin marks H3K4me3 (G), H3K27ac (H), ATACseq (I), transcription of the closest gene (J), and H3K9me2 (K). See also Figure S2 and Table S2.
Figure 4.
Figure 4.. Nucleotide Resolution Mapping of End Resection
(A) Top panel shows END-seq tracks surrounding an AsiSI DSB generated in Lig4−/− 53BP1−/−cycling pre-B cells. The accumulation of reads away from the DSB is indicative of end resection. Bottom panel shows the read coverage for RPA ChIP-seq for the same interval (B) END-seq and RPA ChIP-seq reads for an AsiSI site distinct from that shown in (A). RPA ChIP-seq is not detectable above background for this site. (C) End resection in G1-arrested versus cycling pre-B cells. The bottom track shows RPA ChIP-seq reads for the same interval. End resection is greater in cycling cells than arrested cells. See also Figure S3.
Figure 5.
Figure 5.. RAG Endonuclease On- and Off-Target Activity
(A) END-seq reads at the Igκ locus for LIG4−/− (top data track) and RAG1−/− (bottom data track) cells. Position of all the V and J gene segments are displayed at the top. (B) A pair of RAG off-target DSBs on chromosome 1 detected by END-seq at a convergent pair of c-RSSs, previously identified by HTGTS in ATM−/− cells (top right cartoon) (Hu et al., 2015). Both off-target DSBs are highlighted in blue; blue triangles represent cryptic RSSs, and dashed red line indicates RAG cleavage. Middle and lower panels show the magnified view of the SE and CE breaks associated with the cryptic RSSs (triangle) whose sequence is indicated. (C) Venn diagram comparing the number of RAG off-targets identified by END-seq versus HTGTS. (D) Consensus sequence logo at cryptic RSSs classified as those that do not contain a nonamer (top) and those that do (bottom). (E) Boxplot representing the number of reads at each RAG on- and off-target site for LIG4−/− cells. Red triangle indicates the mean value and black solid line is median in each group. See also Figures S4 and S5 and Table S3.
Figure 6.
Figure 6.. DSB Repertoire of Freshly Isolated Thymocytes
(A) Top panel: END-seq reads at TCRα locus from WT (top track) and RAG2−/− TCRβ (bottom track) thymocytes. The position of all V and J gene segments is displayed as bars above, and TCRα J segments are highlighted in blue. Bottom panel: magnification of the TCRα J region, with the Jα31 highlighted in blue. (B) END-seq reads at TCRα J31 gene segment. (C) Boxplot representing the distribution of the number of END-seq reads for each SE and CE in WT thymocytes. Red triangle designates the mean value and black solid line indicates median value in each group. (D) END-seq reads along the 64 kb TCR Jα locus for three independent WT, three ATM−/−, and two RAG2−/− TCRβ transgenic thymocytes. See also Figures S6 and S7 and Tables S4 and S5.
Figure 7.
Figure 7.. Structure of DNA Ends in Primary WT and ATM−/− Lymphocytes
(A) SEs and CEs at the TCRα J61 segment in WT, ATM−/−, and RAG2−/− TCRβ transgenic thymocytes. The position of Jα61 is indicated above the top track and the dashed line shows the SE-CE border. (B) Scatterplot representing the number of reads at SEs versus CEs in WT and ATM−/− thymocytes for all broken RSSs in the TCRα locus. Diagonal line represents those RSSs with equal number of reads at SEs and CEs. (C) Examples of SE versus CE reads at Igκ V1–110 in WT pre-B cells with or without ATM inhibitor pretreatment. The position of the Igκ V1–110 gene segment is indicated above the top track and the dashed line indicates the predicted RAG cleavage site. (D) Difference in number of reads between CEs and SEs sorted in descending order in untreated (left panel) and ATMi pre-treated (right panel) WT pre-B cells. Positive values indicate that the number of reads at the CE is higher than at the SE, whereas negative values indicate greater number of reads at the SEs. (E) Example of a RAG off-target DSB identified by END-seq in primary thymocytes. Blue triangles represent cryptic RSSs, and the dashed red line shows the RAG cleavage site. WT (top) and ATM−/− (middle) thymocytes show two blocks of reads on both sides of the c-RSS. Sequencing track for RAG2−/− TCRβ is shown below. (F) Left panel shows END-seq reads on plus and minus strands at the IgH locus (interval between IgH-μ in the constant region and the beginning of IgH-D) in mature WT (first two tracks) and ATM−/− (bottom two tracks) splenic B cells. Cartoon on the right illustrates a break at the IgH locus on one chromosome 12 homolog, with the centromeric fragment captured by the END-seq adaptor. The telomeric fragment is lost during replication earlier during B cell development, and as a result only one end of the original DSB is captured. Red dots denote telomeres. See also Figure S7 and Table S5.

Comment in

References

    1. Baranello L, Kouzine F, Wojtowicz D, Cui K, Przytycka TM, Zhao K, and Levens D (2014). DNA break mapping reveals topoisomerase II activity genome-wide. Int. J. Mol. Sci 15, 13111–13122. - PMC - PubMed
    1. Baranello L, Wojtowicz D, Cui K, Devaiah BN, Chung HJ, Chan-Salis KY, Guha R, Wilson K, Zhang X, Zhang H, et al. (2016). RNA polymerase II regulates topoisomerase 1 activity to favor efficient transcription. Cell 165, 357–371. - PMC - PubMed
    1. Barlow JH, Faryabi RB, Callén E, Wong N, Malhowski A, Chen HT, Gutierrez-Cruz G, Sun HW, McKinnon P, Wright G, et al. (2013). Identification of early replicating fragile sites that contribute to genome instability. Cell 152, 620–632. - PMC - PubMed
    1. Benner C, Isoda T, and Murre C (2015). New roles for DNA cytosine modification, eRNA, anchors, and superanchors in developing B cell progenitors. Proc. Natl. Acad. Sci. USA 112, 12776–12781. - PMC - PubMed
    1. Bredemeyer AL, Sharma GG, Huang CY, Helmink BA, Walker LM, Khor KC, Nuskey B, Sullivan KE, Pandita TK, Bassing CH, and Sleckman BP (2006). ATM stabilizes DNA double-strand-break complexes during V(D)J recombination. Nature 442, 466–470. - PubMed

Publication types

MeSH terms

LinkOut - more resources