. 2016 Jul 29:9:33.
doi: 10.1186/s13072-016-0079-z. eCollection 2016.

Epigenetic dynamics of monocyte-to-macrophage differentiation

Affiliations

Epigenetic dynamics of monocyte-to-macrophage differentiation

Stefan Wallner et al. Epigenetics Chromatin. .

Abstract

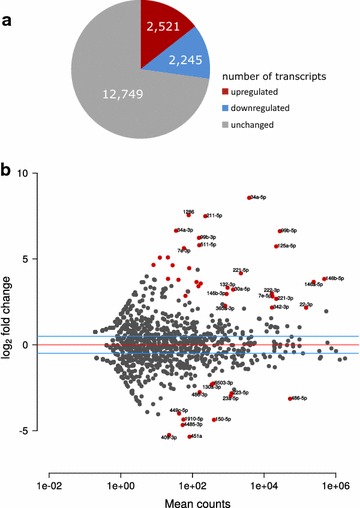
Background: Monocyte-to-macrophage differentiation involves major biochemical and structural changes. In order to elucidate the role of gene regulatory changes during this process, we used high-throughput sequencing to analyze the complete transcriptome and epigenome of human monocytes that were differentiated in vitro by addition of colony-stimulating factor 1 in serum-free medium.

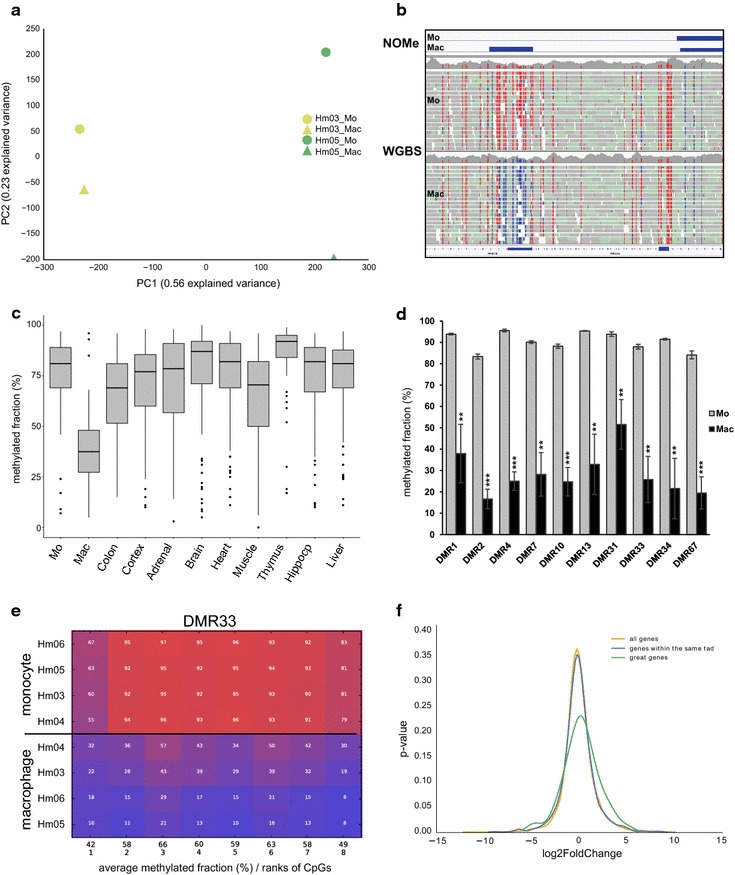
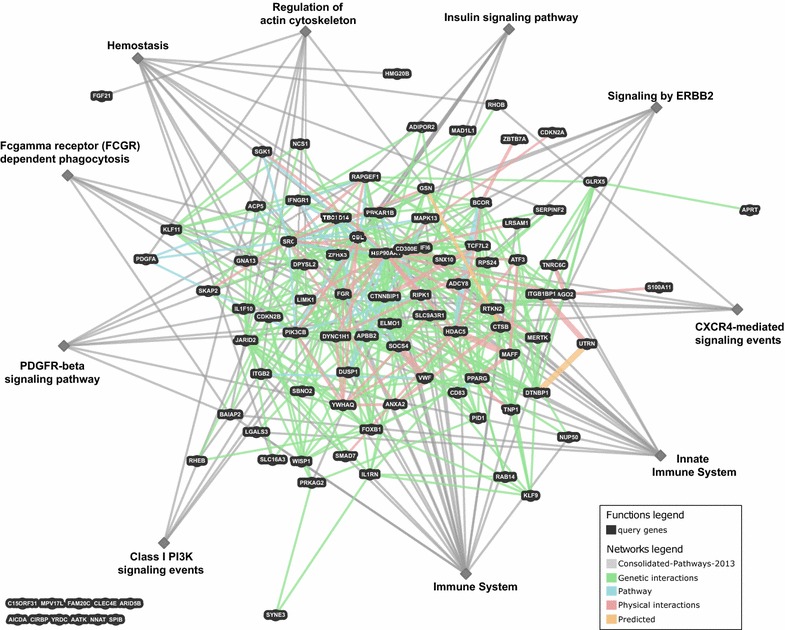
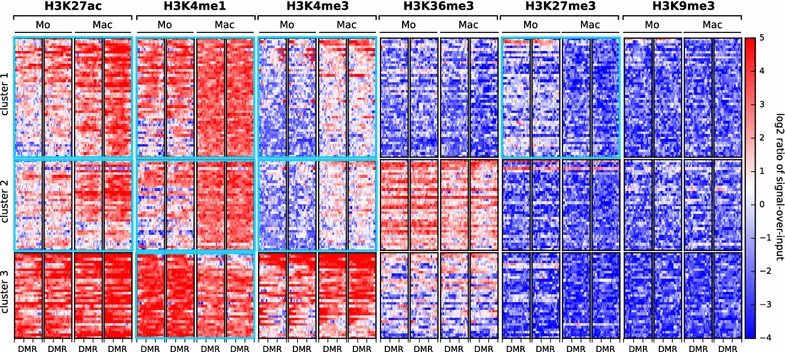
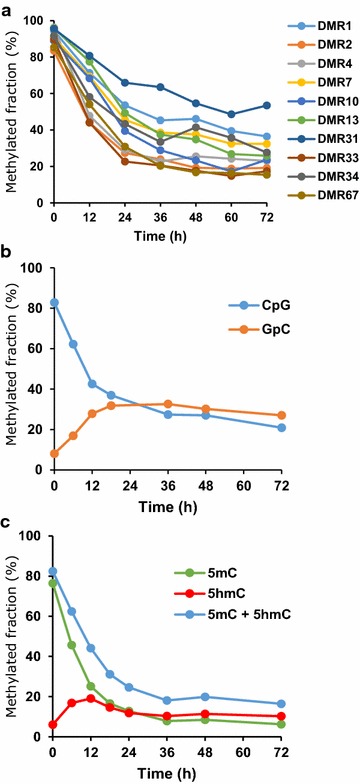
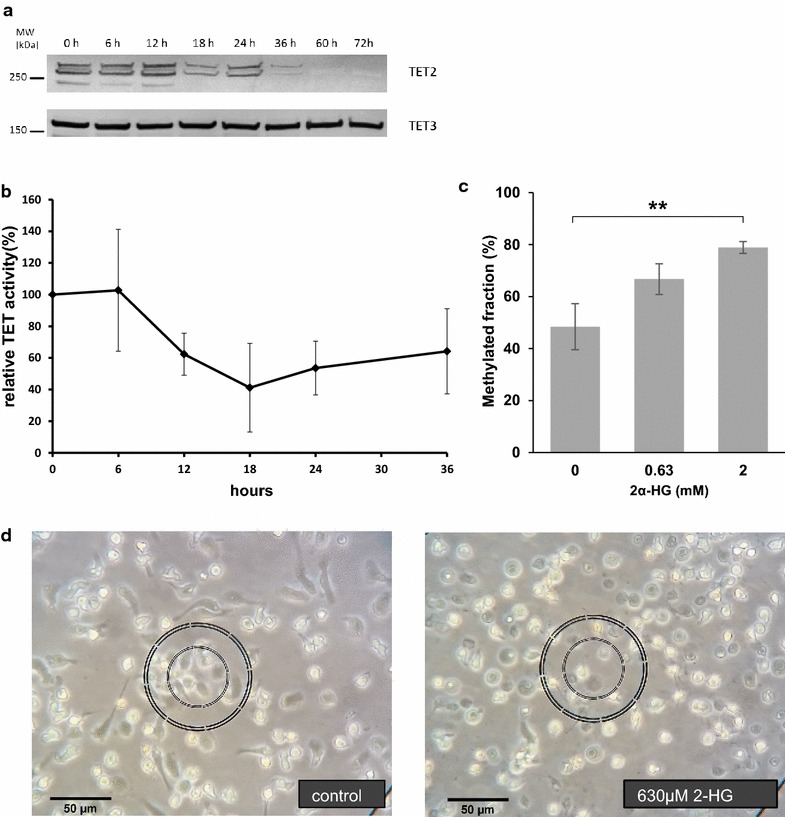
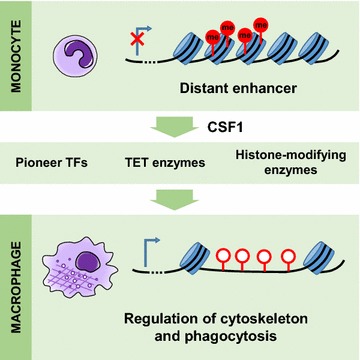
Results: Numerous mRNAs and miRNAs were significantly up- or down-regulated. More than 100 discrete DNA regions, most often far away from transcription start sites, were rapidly demethylated by the ten eleven translocation enzymes, became nucleosome-free and gained histone marks indicative of active enhancers. These regions were unique for macrophages and associated with genes involved in the regulation of the actin cytoskeleton, phagocytosis and innate immune response.

Conclusions: In summary, we have discovered a phagocytic gene network that is repressed by DNA methylation in monocytes and rapidly de-repressed after the onset of macrophage differentiation.

Keywords: DEEP; Enhancer; Epigenetics; IHEC; Macrophage; Methylation; Monocyte; Next-generation sequencing; TET; Ten eleven translocation methylcytosine dioxygenase.


Figures

Fig. 1
Fig. 1
Transcriptional analysis. a Regulation of mRNA transcripts during ​monocyte-to-macrophage differentiation. b log2 transformed expression changes upon ​monocyte-to-macrophage differentiation plotted against miRNA levels in mean read counts. Significantly regulated miRNAs (padj < 0.05) are labeled and depicted in red
Fig. 2
Fig. 2
DNA methylation analysis. a PCA on whole-genome bisulfite data. A clear separation of monocytes (Mo) and macrophages (Mac) as well as donors Hm03 and Hm05 is visible. b Representative example of a DMR in the left part of an IGV browser snapshot. The DMR coincides with the gain of a NOMe peak. c Comparison of the average methylated DNA fraction in the identified DMRs in a variety of tissues subjected to WGBS [12]. Boxplots showing medians, 75th and 25th percentile (box limits) and whiskers of 1.5 × IQR, p < 0.0001 (unpaired Student’s t test) for Mac against all other tissues. d Validation of 10 DMRs by targeted deep bisulfite sequencing. Average CpG methylated fractions in monocytes and macrophages after at least 3 days of differentiation. Results are mean ± SD from 4 independent donor samples (Hm03, Hm04, Hm05 and Hm06). **p value <0.01; ***p value <0.001 (two-tailed paired Student’s t test). Related to Additional file 6: Figure S3. e Representative comparative methylation plot (DMR33). Samples are sorted by overall methylation. Related to Additional file 6: Figure S3. f Distribution plot of expression changes for all genes (yellow), genes within the same TAD (blue) and genes identified in the GREAT analysis (green)
Fig. 3
Fig. 3
Network showing genetic, physical, pathway and predicted interactions between the 95 DMR-associated genes that belong to one or more of the 16 significantly enriched GO terms. For a more detailed inspection, the 95 genes (Additional file 8: Table S4) can be uploaded to http://www.genemania.org/
Fig. 4
Fig. 4
Heatmap of histone modification signals at 114 differentially methylated regions in monocyte (Mo) versus macrophage (Mac). The heatmap shows the log2 ratio of ChIP signal over input at the DMRs plus 1 kb flanking regions for six different histone modifications. k-means clustering revealed three cluster with distinct chromatin signatures. Cluster 1 comprises DMRs that gain in macrophages the signature of active enhancers in non-transcribed regions, cluster 2 comprises DMRs that gain in macrophages the signature of active enhancers in actively transcribed regions and cluster 3 comprises DMRs with the signature of promoters or enhancers that are active in both monocyte and macrophage. Clusters and histone marks with significant change during ​monocyte-to-macrophage differentiation (p < 0.001, paired Student’s t test with Bonferroni correction) are highlighted with a bold light blue border
Fig. 5
Fig. 5
Time-course analysis. a Demethylation of 10 DMRs. Average CpG methylated fractions in Hm06 donor monocytes (0 h) and cells collected at different time points during differentiation into macrophages. Related to Additional file 9: Figure S5. b Time course of chromatin accessibility (GpC methylation in NOMe experiments) and DNA CpG methylation in DMR33. Average CpG and GpC methylated fractions in Hm10 donor monocytes (0 h) and cells collected at different time points during differentiation into macrophages. The transition from lower to higher GpC methylated fraction is indicative of an increase in chromatin accessibility. GCG motifs were excluded due to ambiguity between CpG- endogenous- and GpC-enzymatic-methylation. Related to Additional file 10: Figure S6. c 5-hydroxymethyl-cytosine (5hmC) level increases during differentiation. Average 5hmC and 5mC (5-methylcytosine) fractions in monocytes (0 h) and cells collected at different time points (DMR33 from donor Hm10). Related to Additional file 14: Figure S7
Fig. 6
Fig. 6
Analysis of TET activity. a Western blot for TET enzymes (donor Hm14) showing a decrease in TET2 protein levels during the first day of differentiation. Multiple isoforms are detectable for TET2. TET3 levels did not change. TET1 was undetectable by western blotting using commercial antibodies. b TET activity during ​monocyte-to-macrophage differentiation. TET activity in nuclear extract decreases significantly (p < 0.05, ANOVA) during differentiation from freshly isolated monocytes at 0 h to adherent phagocytic cells at later time points (n = 3–5, mean ± SEM). c Quantification of DMR33 methylation after 1-day differentiation exposed to different concentrations of the TET inhibitor Octyl-2-α hydroxyglutarate (2-HG). Results are mean ± SD from 3 independent donor samples (Hm15, HU2 and HU3). **p value <0.01 (unpaired Student’s t test). (D) Light microscopy of monocytes after 1 day differentiation in the presence or absence of TET inhibitor (donor Hm15). While control cells acquire a macrophage-like, adherent phenotype with protrusions, cells treated with 630 µM 2-HG are only loosely attached and have a round phenotype
Fig. 7
Fig. 7
Graphical summary. A phagocytic gene network that is repressed by DNA methylation in monocytes is rapidly derepressed after the onset of macrophage differentiation

References

    1. Hume DA, Freeman TC. Transcriptomic analysis of mononuclear phagocyte differentiation and activation. Immunol Rev. 2014;262:74–84. doi: 10.1111/imr.12211. - DOI - PubMed
    1. Andersson R, Gebhard C, Miguel-Escalada I, Hoof I, Bornholdt J, Boyd M, Chen Y, Zhao X, Schmidl C, Suzuki T, et al. An atlas of active enhancers across human cell types and tissues. Nature. 2014;507:455–461. doi: 10.1038/nature12787. - DOI - PMC - PubMed
    1. Arner E, Daub CO, Vitting-Seerup K, Andersson R, Lilje B, Drabløs F, Lennartsson A, Rönnerblad M, Hrydziuszko O, Vitezic M. Transcribed enhancers lead waves of coordinated transcription in transitioning mammalian cells. Science. 2015;347:1010–1014. doi: 10.1126/science.1259418. - DOI - PMC - PubMed
    1. Hume DA, Summers KM, Raza S, Baillie JK, Freeman TC. Functional clustering and lineage markers: insights into cellular differentiation and gene function from large-scale microarray studies of purified primary cell populations. Genomics. 2010;95:328–338. doi: 10.1016/j.ygeno.2010.03.002. - DOI - PubMed
    1. Gosselin D, Glass CK. Epigenomics of macrophages. Immunol Rev. 2014;262:96–112. doi: 10.1111/imr.12213. - DOI - PMC - PubMed

LinkOut - more resources