Review
. 2016 Jul 5;10(4):043402.
doi: 10.1063/1.4955123. eCollection 2016 Jul.

Microfluidic viscometers for shear rheology of complex fluids and biofluids

Affiliations
Review

Microfluidic viscometers for shear rheology of complex fluids and biofluids

Siddhartha Gupta et al. Biomicrofluidics. .

Abstract

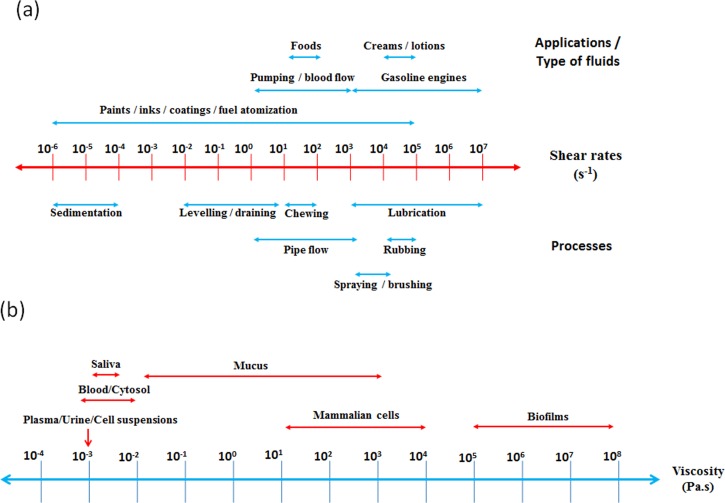
The rich diversity of man-made complex fluids and naturally occurring biofluids is opening up new opportunities for investigating their flow behavior and characterizing their rheological properties. Steady shear viscosity is undoubtedly the most widely characterized material property of these fluids. Although widely adopted, macroscale rheometers are limited by sample volumes, access to high shear rates, hydrodynamic instabilities, and interfacial artifacts. Currently, microfluidic devices are capable of handling low sample volumes, providing precision control of flow and channel geometry, enabling a high degree of multiplexing and automation, and integrating flow visualization and optical techniques. These intrinsic advantages of microfluidics have made it especially suitable for the steady shear rheology of complex fluids. In this paper, we review the use of microfluidics for conducting shear viscometry of complex fluids and biofluids with a focus on viscosity curves as a function of shear rate. We discuss the physical principles underlying different microfluidic viscometers, their unique features and limits of operation. This compilation of technological options will potentially serve in promoting the benefits of microfluidic viscometry along with evincing further interest and research in this area. We intend that this review will aid researchers handling and studying complex fluids in selecting and adopting microfluidic viscometers based on their needs. We conclude with challenges and future directions in microfluidic rheometry of complex fluids and biofluids.


Figures

FIG. 1.
FIG. 1.
Diverse examples of complex fluids and biofluids from everyday life. (a) Engine oil is a blend of heavy hydrocarbons, aromatics, and additives. (b) Shaving cream is a foam containing as much as 90% of air. (c) Paints are colloidal suspensions often admixed with polymers. (d) Ketchup and mustard sauce are complex mixtures of particulate matter and biopolymers. (e) Saliva showing beads-on-a-string phenomenon due to the presence of viscoelastic mucin polymers. (f) Blood is a suspension of cells with volume fractions close to 45%. The inset shows red blood cells that are typically 8 μm in diameter. (g) Vitreous humor in the anterior of a dissected calf eye with the lens and iris visible underneath it. Vitreous humor has 98%–99% of its volume as water and also contains cells, salts, sugars, and collagen. Photograph by Mark Fickett distributed under a CC-BY-SA 2.5 licence. (h) Synovial fluid is a non-Newtonian fluid found in the cavities of synovial joints. It is made of hyaluronic acid, lubricin, proteinases, and collagenases. Photograph by James Heilman distributed under a CC-BY-SA 3.0 licence.
FIG. 2.
FIG. 2.
Significance of shear rheology for complex fluids and biofluids. (a) Shear rate ranges for different applications alongside different processes in complex fluids. The range of shear rates varies widely from 10−6 to 107 s−1. From Barnes et al., An Introduction to Rheology, Copyright 1989 John Wiley and Sons, Inc. Reprinted with permission from John Wiley and Sons, Inc. (b) Typical biofluids and their viscosity values, showing the diversity in naturally occurring complex fluids.
FIG. 3.
FIG. 3.
Shear viscometry and viscometric flows. (a) Shear viscometry of a Newtonian fluid between sliding parallel plates. The top plate is moved at constant velocity while the bottom plate is fixed leading to a homogenous shearing of the Newtonian fluid. (b) Different macroscale geometries used to measure the rheology of complex fluids. The left column shows geometries that generate boundary-driven flows, while the right column shows geometries that create pressure-driven flows. From Macosko, Principles of Rheology: Measurements and Applications, Copyright 1994 John Wiley and Sons, Inc., Adapted with permission from John Wiley and Sons, Inc.
FIG. 4.
FIG. 4.
(a) Pressure sensing microfluidic viscometer with flush mounted pressure sensors. (b) Viscosity as a function of shear rate for aqueous xanthan gum solution showing high shear rate (10−3–104 s−1) rheometry with flush mounted sensors. Reproduced with permission from Pipe et al., Rheol. Acta 47(5–6), 621–642 (2008). Copyright 2008 Springer-Verlag.
FIG. 5.
FIG. 5.
Flow rate sensing viscometers. (a) (top) Schematic of the pressure-driven micro-capillary rheometer showing the two pressure chambers connected by polyethylene tubing along with the circuit diagram showing resistance of the flow path. (bottom) Measured viscosity of different concentrations (20–100 g/l) of antibody solutions over a range of shear rates at pH 8.7 and temperatures of 5 °C, 23 °C, and 40 °C, showing Newtonian behavior. Reproduced with permission from Hudson et al., J. Pharm. Sci. 104 (2), 678–685 (2015). Copyright 2015 Elsevier. (b) (top) iCapillary viscometer setup and operation. (bottom) Viscosity values of 2 wt. % (circles) and 1 wt. % (squares) PEO solutions obtained using the iCapillary device. The lines are data from macroscale rheometry.
FIG. 6.
FIG. 6.
Surface-tension viscometer. (a) Basic principle of capillary-pressure-driven flow inside microchannels. A drop of liquid placed at the inlet of channel migrates into the channel due to capillary pressure difference between the advancing and receding menisci until it reaches the other end where pressure equalization stops the flow. Reproduced with permission from Srivastava et al., Anal. Chem. 77(2), 383–392 (2005). Copyright 2005 American Chemical Society. (b) (left) Self-calibrating nanoliter viscometer device with two open channels and two sealed square chambers. (right) Graph showing viscosity as a function of shear rate for a semi dilute solution of PEO at 23 °C, where measurements from a nanoliter viscometer and a cone-and-plate viscometer are compared. Reproduced with permission from Srivastava and Burns, Anal. Chem. 78(5), 1690–1696 (2006). Copyright 2006 American Chemical Society. Reproduced with permission from Srivastava et al., Anal. Chem. 77(2), 383–392 (2005). Copyright 2005 American Chemical Society.
FIG. 7.
FIG. 7.
Co-flowing stream viscometry. (a) Working principle of the comparator-based microfluidic co-flowing streams viscometer and results showing comparison of viscosity as a function of shear rate between rheometer (solid line), and co-flowing streams viscometer using the interface displacement technique (symbols) for a 25 wt. % glycerol solution. Reproduced with permission from Solomon and Vanapalli, Microfluid. Nanofluid. 16(4), 677–690 (2014). Copyright 2014 Springer-Verlag Berlin Heidelberg. (b) Relative viscosity versus mean shear rate at several volume fractions for bacterial suspensions of E. coli. Reproduced with permission from Gachelin et al., Phys. Rev. Lett. 110(26), 268103 (2013). Copyright 2013 American Physical Society. (c) Viscosity as a function of shear rate for a solution made of 6% CpCl-NaSal in brine water at 22 °C. (⋄) represents results obtained in a 200 μm × 100 μm glass PDMS channel which are not in agreement with cone plate rheometer at low shear rates. Slip effects on PDMS are at the origin of this deviation. Reproduced with permission from Guillot et al., Langmuir 22(14), 6438–6445 (2006). Copyright 2006 American Chemical Society. (d) The indicator channel approach showing injected flowrates for sample and reference fluids (Qspl, Qref), and the number of indicating channels filled with the sample and reference fluids (Nspl, Nref). The bottom plot shows comparison of relative viscosity measured by the conventional viscometer and the indicator channel microfluidic viscometer for normal blood–plasma and normal blood–PBS (Phosphate buffered saline) suspension with respect to shear rate. Reproduced with permission from Kang and Yang, Microfluid. Nanofluid. 14(3–4), 657–668 (2013). Copyright 2013 Springer-Verlag Berlin Heidelberg. (e) The 8-plex co-flowing streams viscometer. Viscosity of various consumer products measured simultaneously using the 8-plex viscometer (open bars). The products are mouthwash (P1, P3), facial spray (P2), hair spray (P4, P5, P6), acne solution (P7), and hair gel (P8). The solid bars represent viscosity data obtained from the rheometer. γ˙ represents the shear rate at which the data were collected. Reproduced with permission from Solomon and Vanapalli, Microfluid. Nanofluid. 16(4), 677–690 (2014). Copyright 2014 Springer-Verlag Berlin Heidelberg.
FIG. 8.
FIG. 8.
Diffusion viscometers. (a) Schematic of a particle undergoing Brownian motion in a polymer network. A representative trajectory of the particle is also shown. (b) Flow based diffusional viscometer. Inset shows simulated diffusion profiles for different viscosities. (bottom) Relative viscosity (ηr) of aqueous solutions at different concentrations of bovine serum albumin (BSA) as measured by flow based diffusional viscometer (circles) and by dynamic light scattering technique (squares) at 25 °C. Reproduced with permission from Arosio et al., Anal. Chem. 88(7), 3488–3493 (2016). Copyright 2016 American Chemical Society. (c) Droplet based diffusional viscometer. (bottom) Plot showing viscosities of high-molecular weight heparin polymer solutions using high throughput multi-particle tracking rheology in droplets compared with conventional rolling ball viscometry. Reproduced with permission from Schultz and Furst, Lab Chip 11(22), 3802–3809 (2011). Copyright 2011 The Royal Society of Chemistry.
FIG. 9.
FIG. 9.
Velocimetry-based viscometers. (a) Experimental setup for viscometry of complex fluids using particle image velocimetry. Reproduced with permission from Appl. Phys. Lett. 89(2), 024104 (2006). Copyright 2006 AIP Publishing LLC. (b) (Left) Velocity vector field for flow of a Newtonian fluid in a 200 × 200 mm2 (green arrows are in the direction of flow). (Right) The parabolic velocity profile for the corresponding fluid flow (from unpublished data). (c) (Left) Velocity profiles for a PEO solution Mw = 5 × 106 g/mol, C = 7.5 g/l at 27 °C for different pressure drops. (○) 122 mbar, (□) 96 mbar, (▽) 71 mbar, and (⋄) 52 mbar from a 1.55 cm long and 18 ± 0.05 μm thick PDMS on a glass microchannel. Stress vs strain rate curve for the corresponding velocity profiles. (Right) The filled squares are independent measurements performed using a Couette rheometer. The dashed lines are guides for the eyes for slope 1 and 0.56, respectively. Reproduced with permission from Appl. Phys. Lett. 89(2), 024104 (2006). Copyright 2006 AIP Publishing LLC.
FIG. 10.
FIG. 10.
Microfluidic viscosity indexers (a) Electrowetting viscometer with electrodes. Reproduced with permission from Lin et al., Electrochim. Acta 52(8), 2876–2883 (2007). Copyright 2007 Elsevier. (b) Cantilever based viscometer. Reproduced with permission from Khan et al., Sens. Actuators B: Chem. 185, 456–461 (2013). Copyright 2013 Elsevier. (c) Vibrating nanowire inside a microchannel with applied magnetic field. Reproduced with permission from Rev. Sci. Instrum. 82(3), 035113 (2011). Copyright 2011 AIP Publishing LLC. (d) Droplet squeezing constriction viscometer. Reproduced with permission from Livak-Dahl et al., Lab Chip 13(2), 297–301 (2013). Copyright 2013 The Royal Society of Chemistry. (e) Droplet based microfluidic viscometer with standard T-junction. Reproduced with permission from DeLaMarre et al., Anal. Chem. 87(9), 4649–4657 (2015). Copyright 2015 American Chemical Society.

Similar articles

Cited by

References

    1. Larson R. G., The Structure and Rheology of Complex Fluids ( Oxford University Press, New York, 1999).
    1. McClements D. J., Food Emulsions: Principles, Practices, and Techniques ( CRC press, 2015).
    1. Spagnolie S. E., Complex Fluids in Biological Systems ( Springer New York Heidelberg Dordrecht London, 2015).10.1007/978-1-4939-2065-5 - DOI
    1. Wilking J. N., Angelini T. E., Seminara A., Brenner M. P., and Weitz D. A., MRS Bull. 36(05), 385–391 (2011).10.1557/mrs.2011.71 - DOI
    1. Morrison F. A., Understanding Rheology ( Oxford University Press, USA, 2001).