. 2016 Jul 29:5:22.
doi: 10.1186/s40164-016-0044-3. eCollection 2015.

Effects of molecularly targeted therapies on murine thymus: highly selective mTOR inhibitors induce reversible thymic involution

Affiliations

Effects of molecularly targeted therapies on murine thymus: highly selective mTOR inhibitors induce reversible thymic involution

Suleiman Al-Hammadi et al. Exp Hematol Oncol. .

Abstract

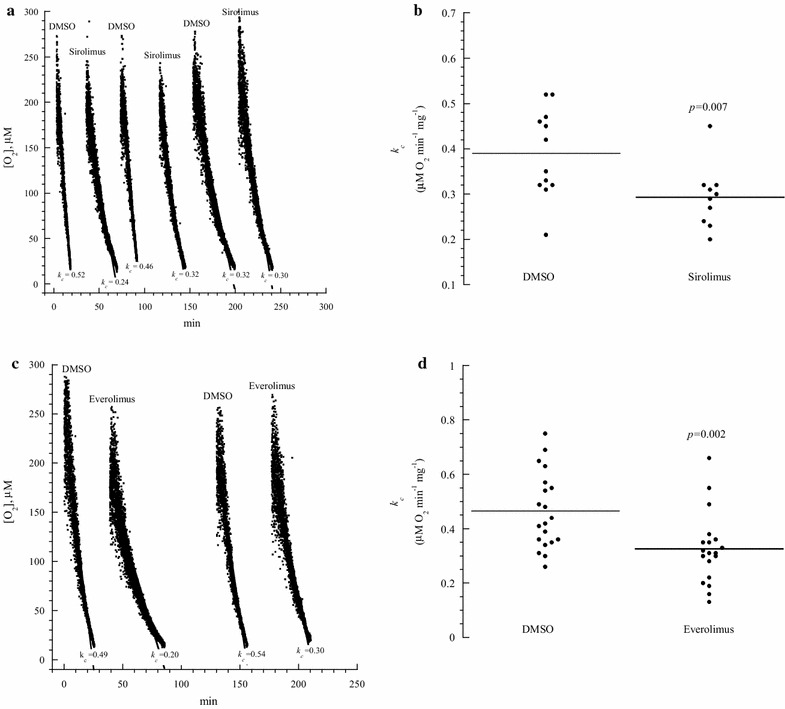
Background: Blocking mTOR (molecular target of rapamycin) by sirolimus has been shown to suppress cellular respiration. The bearing of this impaired cellular bioenergetics on the mode-of-action of mTOR inhibitors has yet to be illustrated.

Methods: This study investigated in vitro effects of several molecularly-targeted therapies on O2 consumption in thymic fragments from C57BL/6 mice.

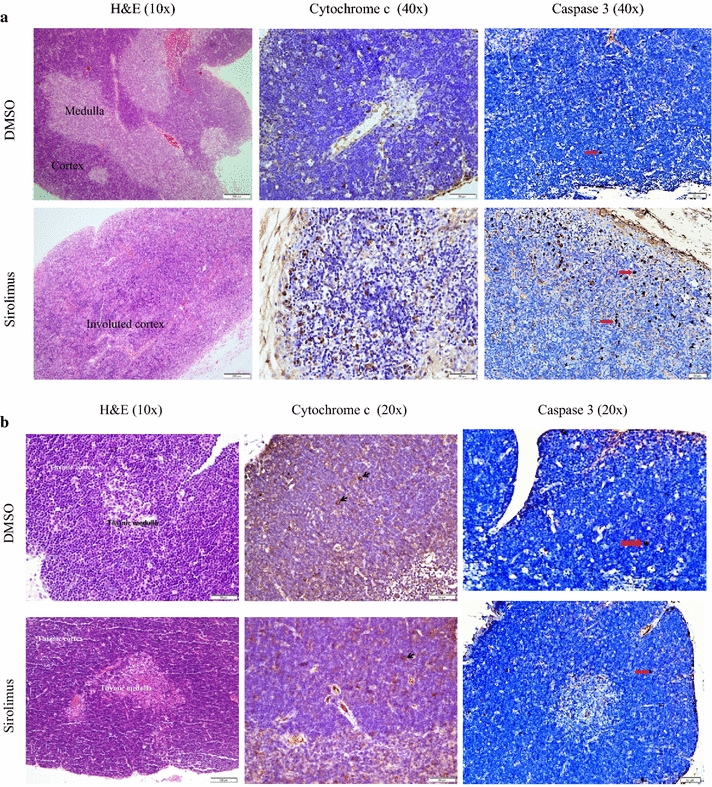
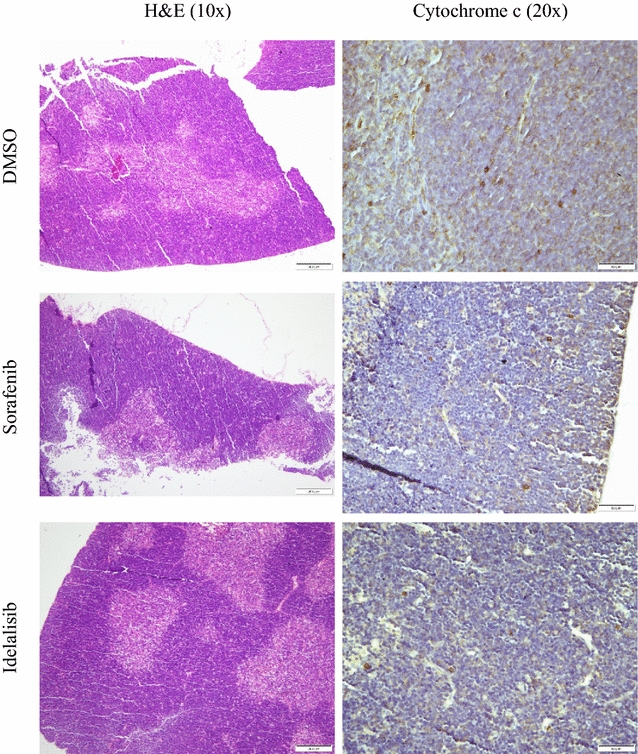
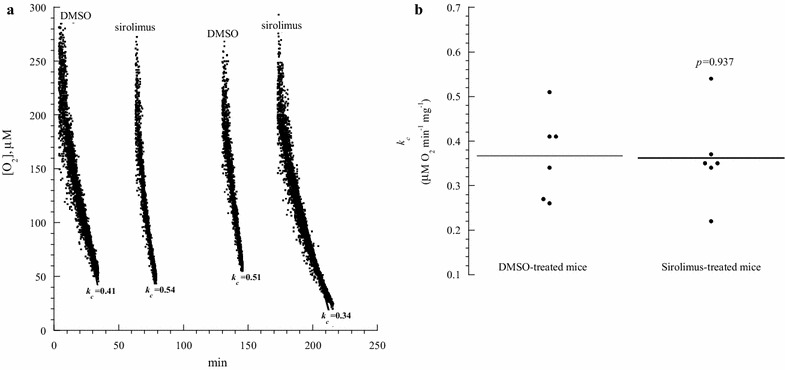
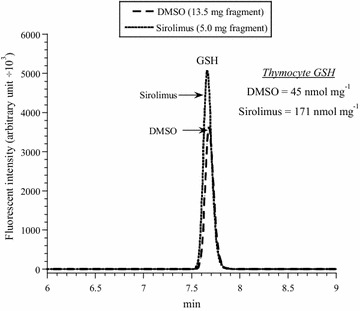
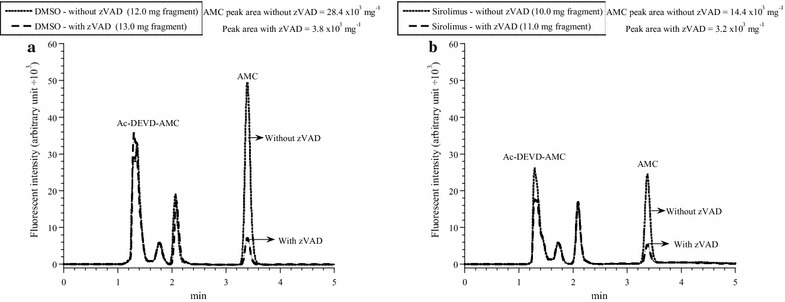
Results: Thymocyte respiration (µM O2 min(-1) mg(-1)) was reduced by sirolimus and everolimus (p ≤ 0.007). In contrast, the dual PI3K (phosphatidylinositol-3-kinase)/mTOR inhibitors BEZ235, GDC0980 and GSK2126458, the highly-selective PI3 K-p110-δ inhibitor idelalisib and the calcineurin inhibitor tacrolimus had no effects on thymocyte respiration. Sirolimus was administered intraperitoneally on Days 0-3 and the thymus was then examined on Days 4 and 14. Cortex involution associated with increased cytochrome c and caspase-3 positive cells (apoptosis) were observed on Day 4; these changes were resolved on Day 14 (10 days after sirolimus treatment). On Day 4, the residual thymus (mostly medulla) had normal cellular respiration, decreased caspase activity and increased glutathione. Intraperitoneal administration of sorafenib (a multikinase inhibitor) or idelalisib had no effects on thymus size.

Conclusion: Thus, the highly-selective mTOR inhibitors imposed specific effects on the thymus, manifested by suppression of cellular respiration and induction of apoptosis.

Keywords: Calcineurin inhibitors; Cellular respiration; Everolimus; Idelalisib; Immunosuppressants; Lymphocytes; PI3K inhibitors; Sirolimus; Sorafenib; Thymus; mTOR inhibitors.


Figures

Fig. 1
Fig. 1
In vitro effects of sirolimus and everolimus on thymocyte respiration. a and c: One representative from 10 to 20 separate experiments. Each run represented a thymus fragment that was collected from a C57BL/6 mouse and processed immediately for measuring cellular respiration in the presence of 10 μM sirolimus (or everolimus) or 1.6 µL DMSO. The rate of respiration (k, μM O2 min−1) was the negative of the slope of [O2] vs. t. The values of k c (μM O2 min−1 mg−1) are shown at the bottom of each run. The lines are linear fit. b and d: Summary of all results; the horizontal lines are mean
Fig. 2
Fig. 2
Effects of systemic sirolimus treatment on thymus histology and immunoperoxidase staining with cytochrome c and caspase 3. Mice received intraperitoneal DMSO or sirolimus on Days 0–3. Thymus fragments were then stained with H&E and immunoperoxidase with anti-cytochrome c and caspase 3 on Day 4 (Panel a) or Day 14 (Panel b). Panel a (Day 4): DMSO (control): Normal thymus histology demonstrating darkly staining lymphocyte rich cortex and pale staining medulla; few (<2 %) cortical lymphocytes with positive staining for cytochrome c and caspase 3 are present (arrow). Sirolimus: Thymic cortical involution with thinning of cortex and loss of the demarcation between the cortex and medulla; increased staining by cytochrome c and caspase 3 (about 20 % of the cells are positive). Panel b (Day 14): Normal thymus histology with a cortex rich in lymphocytes and a lymphocyte scant medulla; rare (<2 %) cortical lymphocytes with positive staining for cytochrome c are present (arrow)
Fig. 3
Fig. 3
Effects of systemic sorafenib and idelalisib treatments on thymus histology and immunoperoxidase staining with cytochrome c (Day 4). Mice received intraperitoneal DMSO, sorafenib or idelalisib on Days 0–3. Thymus fragments were then stained with H&E and immunoperoxidase with anti-cytochrome c on Day 4. Normal thymus histology with a cortex rich in lymphocytes and a lymphocyte scant medulla; few (<2 %) cortical lymphocytes with positive staining for cytochrome c are present
Fig. 4
Fig. 4
Thymocyte respiration in mice treated with sirolimus (Day 4). a One representative from three separate experiments. Mice received intraperitoneal DMSO or sirolimus on Days 0–3. On Day 4, thymic fragments were collected and processed immediately for measuring cellular respiration. The rate of respiration (k, µM O2 min−1) was the negative of the slope of [O2] vs. t. The values of k c (µM O2 min−1 mg−1) are shown at the bottom of each run. The lines are linear fit. b Summary of all results; the horizontal lines are mean
Fig. 5
Fig. 5
Thymocyte GSH in mice treated with sirolimus (Day 4). One representative from three triplicate experiments is shown. Mice received intraperitoneal DMSO or sirolimus on Days 0–3. On Day 4, thymus fragments were collected and processed immediately for measuring cellular GSH. The GS-bimane derivatives (retention time, R t = 7.7 min) were separated on HPLC and analyzed by fluorescence. The values of GSH (nmol mg−1) are shown
Fig. 6
Fig. 6
Effects of systemic sirolimus treatment on thymocyte caspase activity (Day 4). One representative from three triplicate experiments is shown. Mice received intraperitoneal DMSO (a) or sirolimus (b) on Days 0–3. On Day 4, thymic fragments were collected and incubated with the caspase-3 substrate Ac-DEVD-AMC with and without zVAD (pancaspase inhibitor) as described in “Methods” section. The tissue homogenates were separated on HPLC and analyzed by fluorescence for the released AMC moieties (reflecting intracellular caspase activity, R t = 3.44 min). The values of AMC peak areas (arbitrary unit ÷ 103 per mg) are shown. AMC peak areas decreased by ≥78 % in the presence of zVAD, confirming the cleavage was mediated mainly by caspases

References

    1. Ramanathan A, Schreiber SL. Direct control of mitochondrial function by mTOR. Proc Natl Acad Sci USA. 2009;106:22229–22232. doi: 10.1073/pnas.0912074106. - DOI - PMC - PubMed
    1. Albawardi A, Almarzooqi S, Saraswathiamma D, Abdul-Kader HM, Souid A-K, Alfazari AS. The mTOR inhibitor sirolimus suppresses renal, hepatic, and cardiac tissue cellular respiration. Int J Physiol Pathophysiol Pharmacol. 2015;7:54–60. - PMC - PubMed
    1. Cunningham JT, Rodgers JT, Arlow DH, Vazquez F, Mootha VK, Puigserver P. mTOR controls mitochondrial oxidative function through a YY1-PGC-1alpha transcriptional complex. Nature. 2007;450:736–740. doi: 10.1038/nature06322. - DOI - PubMed
    1. Schieke SM, Phillips D, McCoy JP, Jr, Aponte AM, Shen RF, Balaban RS, Finkel T. The mammalian target of rapamycin (mTOR) pathway regulates mitochondrial oxygen consumption and oxidative capacity. J Biol Chem. 2006;281:27643–27652. doi: 10.1074/jbc.M603536200. - DOI - PubMed
    1. Almarzooqi S, Albawardi A, Alfazari AS, Saraswathiamma D, Abdul-Kader HM, Shaban S, Mallon R, Souid A-K. Effects of selected inhibitors of protein kinases and phosphatases on cellular respiration: an in vitro study. J Clin Toxicol. 2014;4:212.