

Multiplexed Nanoplasmonic Temporal Profiling of T-Cell Response under Immunomodulatory Agent Exposure
- PMID: 27478873
- PMCID: PMC4960639
- DOI: 10.1021/acssensors.6b00240
Multiplexed Nanoplasmonic Temporal Profiling of T-Cell Response under Immunomodulatory Agent Exposure
Abstract
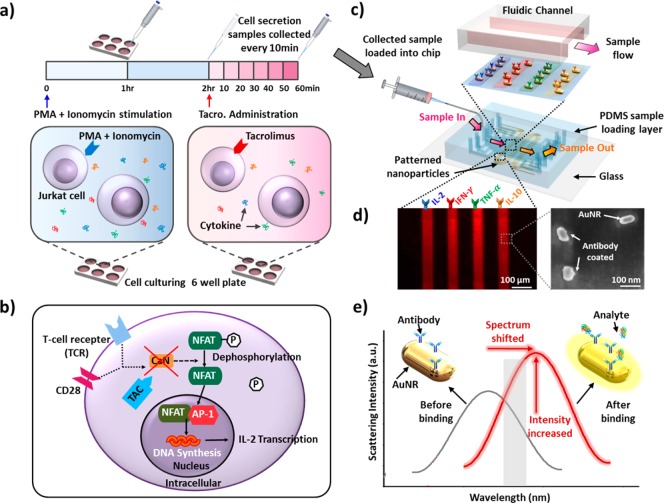
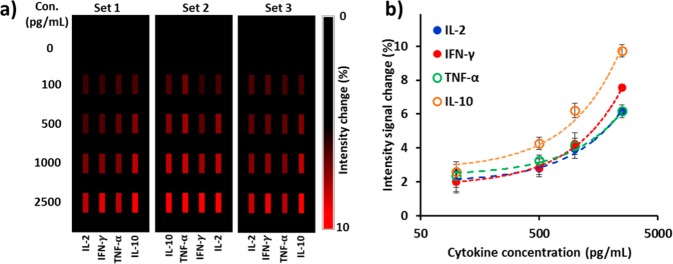
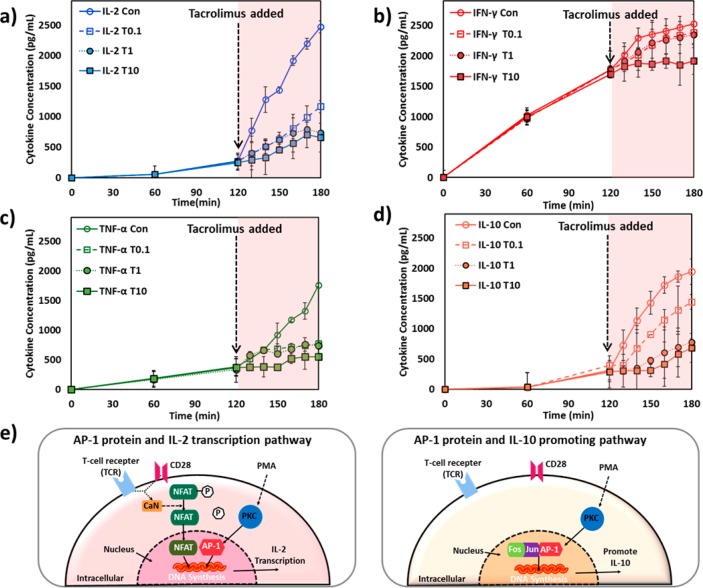
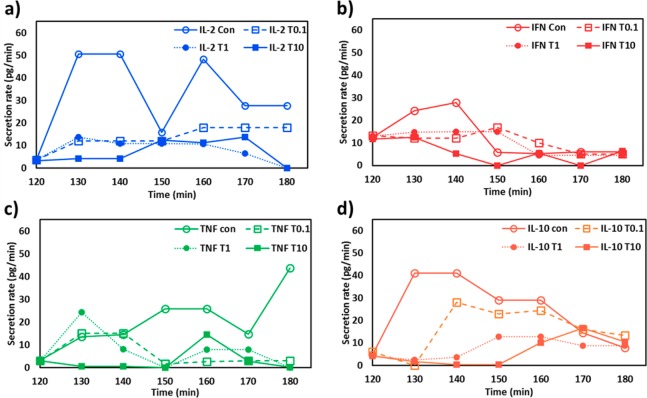
Immunomodulatory drugs-agents regulating the immune response-are commonly used for treating immune system disorders and minimizing graft versus host disease in persons receiving organ transplants. At the cellular level, immunosuppressant drugs are used to inhibit pro-inflammatory or tissue-damaging responses of cells. However, few studies have so far precisely characterized the cellular-level effect of immunomodulatory treatment. The primary challenge arises due to the rapid and transient nature of T-cell immune responses to such treatment. T-cell responses involve a highly interactive network of different types of cytokines, which makes precise monitoring of drug-modulated T-cell response difficult. Here, we present a nanoplasmonic biosensing approach to quantitatively characterize cytokine secretion behaviors of T cells with a fine time-resolution (every 10 min) that are altered by an immunosuppressive drug used in the treatment of T-cell-mediated diseases. With a microfluidic platform integrating antibody-conjugated gold nanorod (AuNR) arrays, the technique enables simultaneous multi-time-point measurements of pro-inflammatory (IL-2, IFN-γ, and TNF-α) and anti-inflammatory (IL-10) cytokines secreted by T cells. The integrated nanoplasmonic biosensors achieve precise measurements with low operating sample volume (1 μL), short assay time (∼30 min), heightened sensitivity (∼20-30 pg/mL), and negligible sensor crosstalk. Data obtained from the multicytokine secretion profiles with high practicality resulting from all of these sensing capabilities provide a comprehensive picture of the time-varying cellular functional state during pharmacologic immunosuppression. The capability to monitor cellular functional response demonstrated in this study has great potential to ultimately permit personalized immunomodulatory treatment.
Keywords: T cells; cytokines; immunomodulatory therapy; localized surface plasmon resonance (LSPR); multiplexed immunoassay; nanoplasmonic biosensing; tacrolimus.
Conflict of interest statement
The authors declare no competing financial interest.
Figures
Similar articles
-
Multiplex serum cytokine immunoassay using nanoplasmonic biosensor microarrays.ACS Nano. 2015;9(4):4173-81. doi: 10.1021/acsnano.5b00396. Epub 2015 Mar 23. ACS Nano. 2015. PMID: 25790830 Free PMC article.
-
A digital nanoplasmonic microarray immunosensor for multiplexed cytokine monitoring during CAR T-cell therapy from a leukemia tumor microenvironment model.Biosens Bioelectron. 2023 Jun 15;230:115247. doi: 10.1016/j.bios.2023.115247. Epub 2023 Mar 24. Biosens Bioelectron. 2023. PMID: 37023552 Free PMC article.
-
An integrated adipose-tissue-on-chip nanoplasmonic biosensing platform for investigating obesity-associated inflammation.Lab Chip. 2018 Dec 7;18(23):3550-3560. doi: 10.1039/c8lc00605a. Epub 2018 Oct 10. Lab Chip. 2018. PMID: 30302487 Free PMC article.
-
Trends and challenges of refractometric nanoplasmonic biosensors: a review.Anal Chim Acta. 2014 Jan 2;806:55-73. doi: 10.1016/j.aca.2013.10.048. Epub 2013 Nov 7. Anal Chim Acta. 2014. PMID: 24331040 Review.
-
Label-free cytokine micro- and nano-biosensing towards personalized medicine of systemic inflammatory disorders.Adv Drug Deliv Rev. 2015 Dec 1;95:90-103. doi: 10.1016/j.addr.2015.09.005. Epub 2015 Sep 25. Adv Drug Deliv Rev. 2015. PMID: 26408791 Free PMC article. Review.
Cited by
-
Airplug-mediated isolation and centralization of single T cells in rectangular microwells for biosensing.Adv Ther (Weinh). 2020 Jan;3(1):1900085. doi: 10.1002/adtp.201900085. Epub 2019 Oct 15. Adv Ther (Weinh). 2020. PMID: 33117882 Free PMC article.
-
Magnet Patterned Superparamagnetic Fe3 O4 /Au Core-Shell Nanoplasmonic Sensing Array for Label-Free High Throughput Cytokine Immunoassay.Adv Healthc Mater. 2019 Feb;8(4):e1801478. doi: 10.1002/adhm.201801478. Epub 2019 Jan 15. Adv Healthc Mater. 2019. PMID: 30645037 Free PMC article.
-
Point-of-care-ready nanoscale ISFET arrays for sub-picomolar detection of cytokines in cell cultures.Anal Bioanal Chem. 2020 Oct;412(25):6777-6788. doi: 10.1007/s00216-020-02820-4. Epub 2020 Jul 28. Anal Bioanal Chem. 2020. PMID: 32725311 Free PMC article.
-
Ultrasensitive Multiparameter Phenotyping of Rare Cells Using an Integrated Digital-Molecular-Counting Microfluidic Well Plate.Small. 2021 Aug;17(31):e2101743. doi: 10.1002/smll.202101743. Epub 2021 Jun 25. Small. 2021. PMID: 34170616 Free PMC article.
-
Novel Nanoplasmonic-Structure-Based Integrated Microfluidic Biosensors for Label-Free in Situ Immune Functional Analysis: A review of recent progress.IEEE Nanotechnol Mag. 2020 Apr;14(2):46-C3. doi: 10.1109/mnano.2020.2966205. Epub 2020 Feb 3. IEEE Nanotechnol Mag. 2020. PMID: 34290843 Free PMC article. No abstract available.
References
Grants and funding
LinkOut - more resources
Full Text Sources
Other Literature Sources
