. 2016 Sep;17(9):1046-56.
doi: 10.1038/ni.3532. Epub 2016 Aug 1.

C13orf31 (FAMIN) is a central regulator of immunometabolic function

Affiliations

C13orf31 (FAMIN) is a central regulator of immunometabolic function

M Zaeem Cader et al. Nat Immunol. 2016 Sep.

Abstract

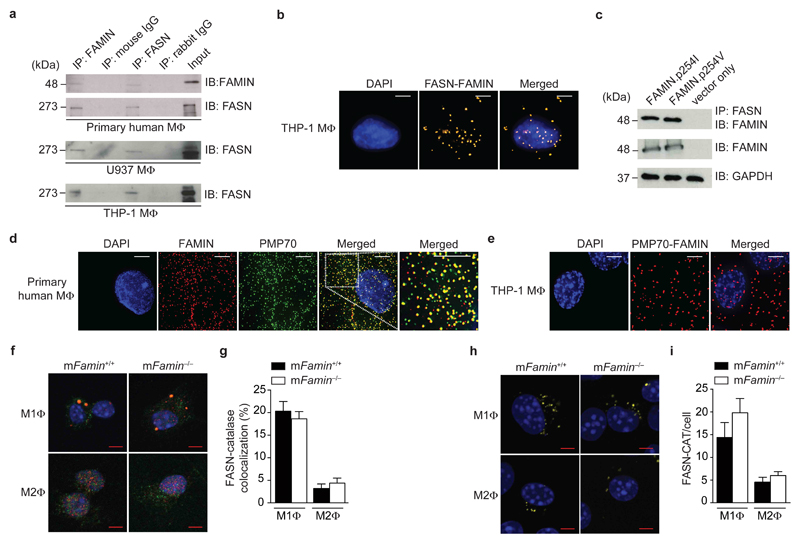
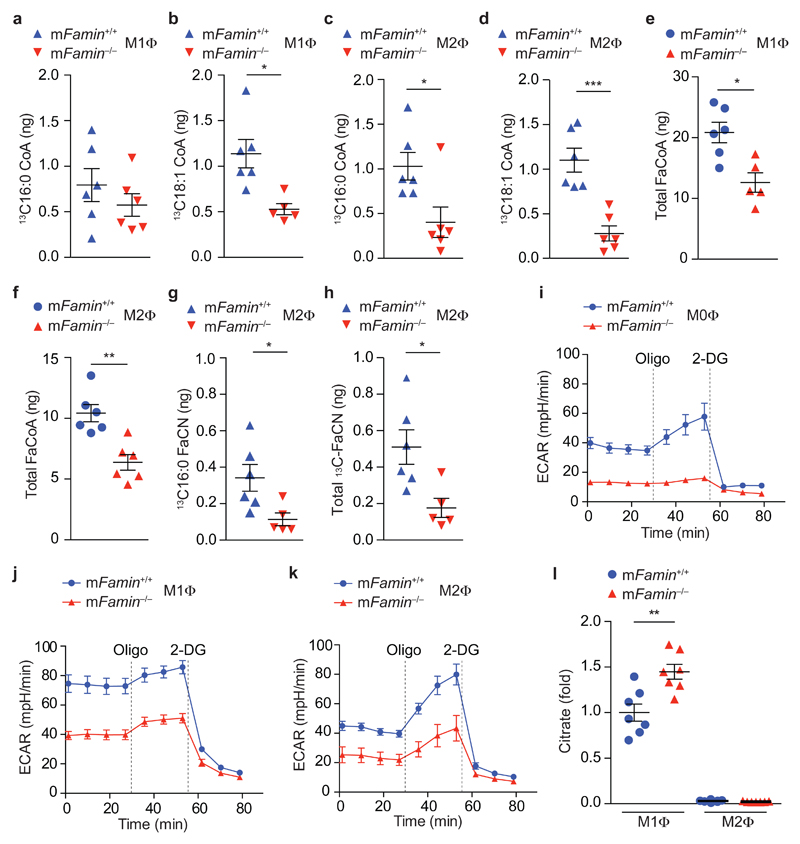
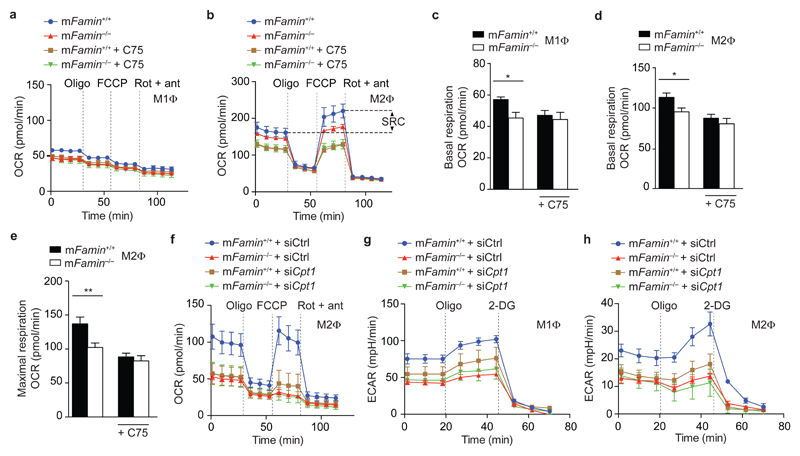
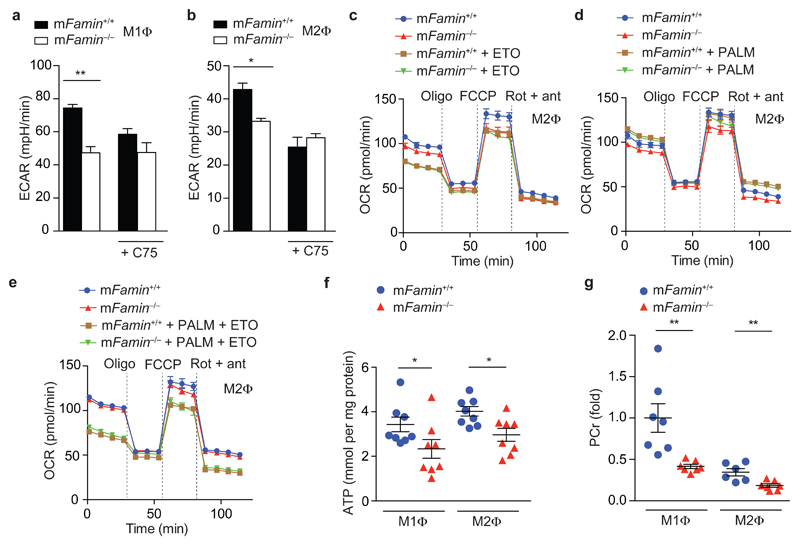
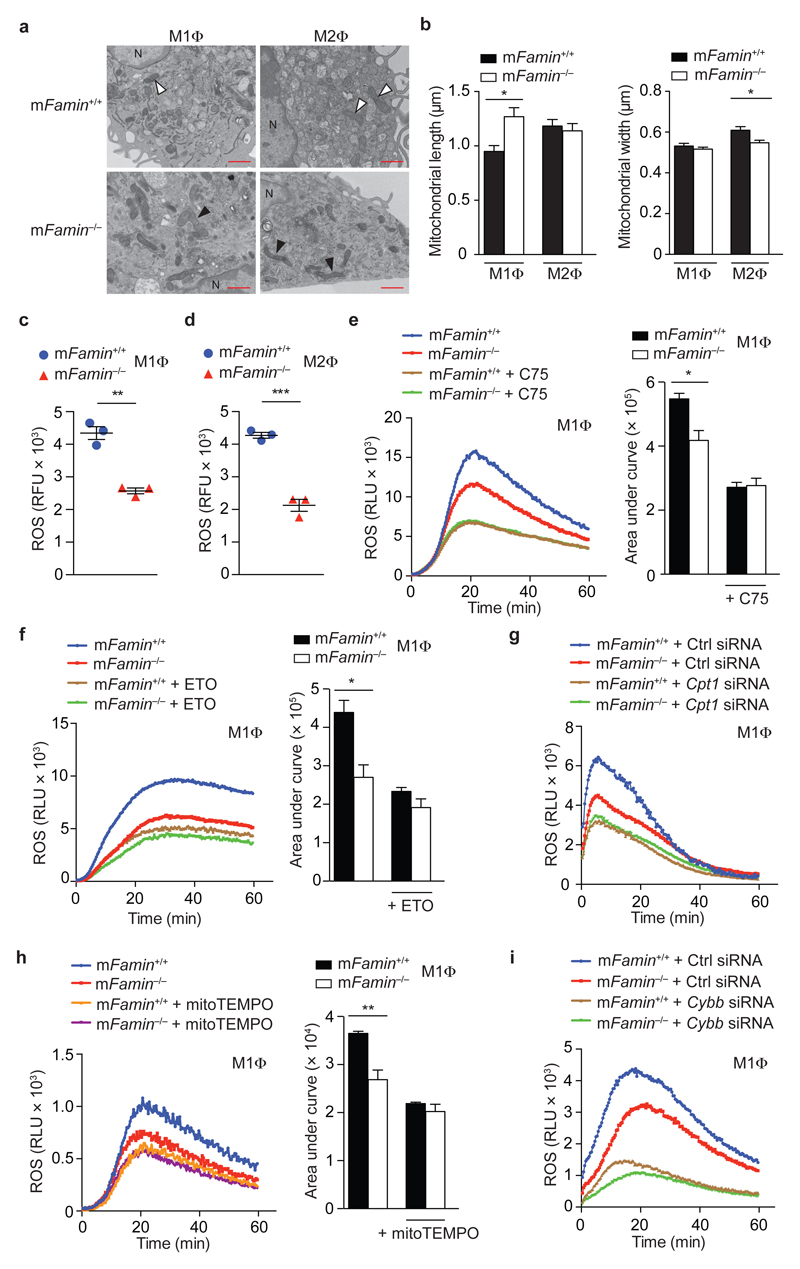
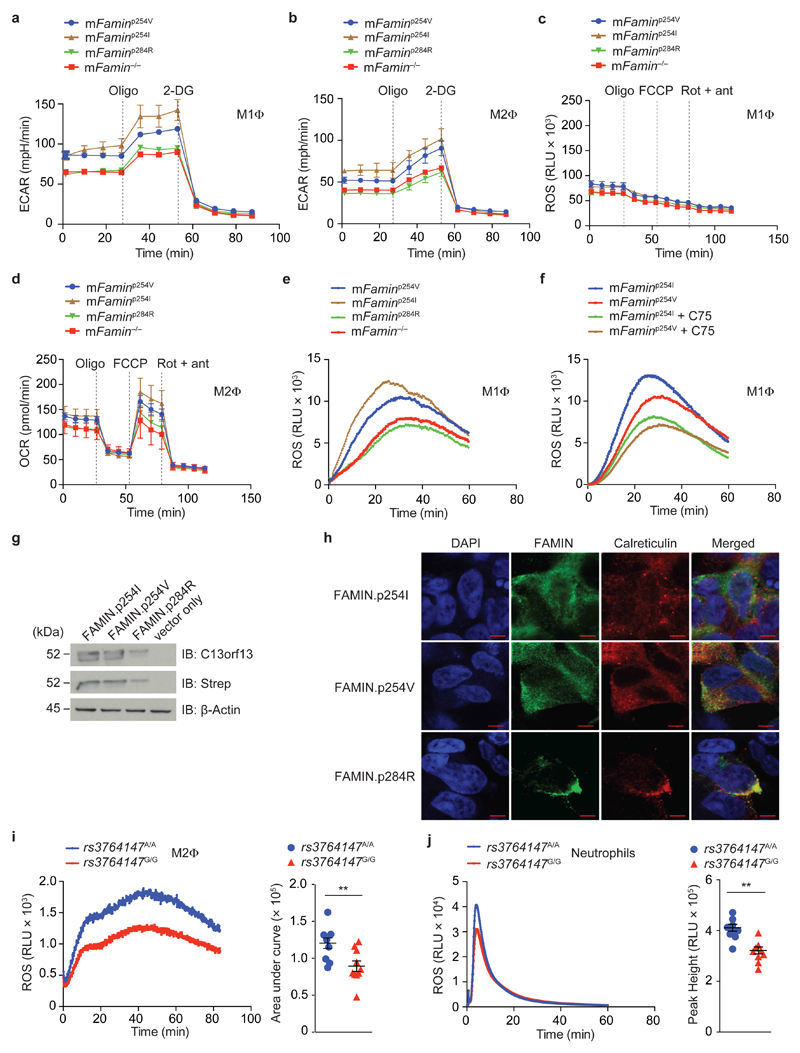
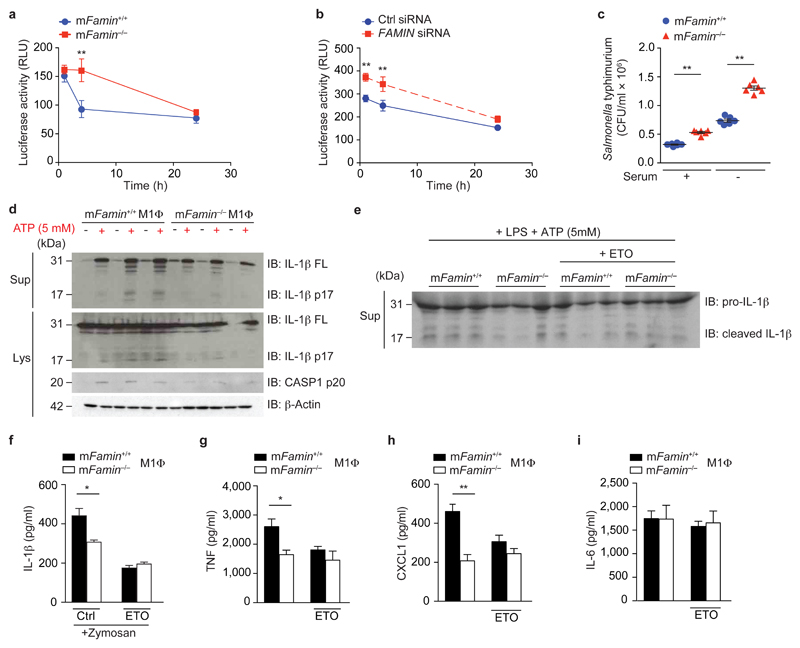
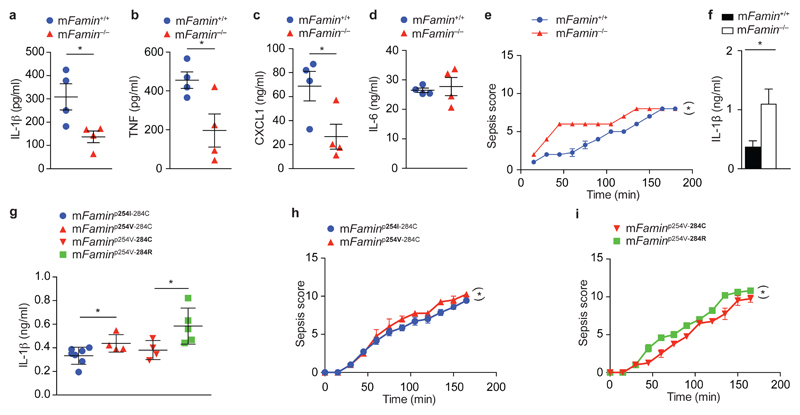
Single-nucleotide variations in C13orf31 (LACC1) that encode p.C284R and p.I254V in a protein of unknown function (called 'FAMIN' here) are associated with increased risk for systemic juvenile idiopathic arthritis, leprosy and Crohn's disease. Here we set out to identify the biological mechanism affected by these coding variations. FAMIN formed a complex with fatty acid synthase (FASN) on peroxisomes and promoted flux through de novo lipogenesis to concomitantly drive high levels of fatty-acid oxidation (FAO) and glycolysis and, consequently, ATP regeneration. FAMIN-dependent FAO controlled inflammasome activation, mitochondrial and NADPH-oxidase-dependent production of reactive oxygen species (ROS), and the bactericidal activity of macrophages. As p.I254V and p.C284R resulted in diminished function and loss of function, respectively, FAMIN determined resilience to endotoxin shock. Thus, we have identified a central regulator of the metabolic function and bioenergetic state of macrophages that is under evolutionary selection and determines the risk of inflammatory and infectious disease.


Conflict of interest statement

Competing Financial Interests

The authors declare no competing financial interests.

Figures

Figure 1
Figure 1. FAMIN interacts with fatty acid synthase and localizes to peroxisomes
(a) Immunoblots (IB) for FAMIN and FASN after anti-C13orf31, anti-FASN or IgG control immunoprecipitation (IP) of primary human PBMC-derived and PMA-differentiated U937 and THP-1 macrophages (MΦ). (b) Proximity-ligation assay (PLA) of FAMIN and FASN (yellow) in THP-1 macrophages. DAPI, blue; scale bar = 5 μm. (c) IB for FAMIN of lysates and after anti-FASN IP of HEK293 expressing FAMIN.p254I or FAMIN.p254V; GAPDH loading control. (d) Co-localization by immunofluorescence (IF) of FAMIN (red) with PMP70 (green) in primary human macrophages. DAPI nuclear staining, blue; scale bar = 5 μm. Images are enlarged from the demarcated region in Supplementary Fig. 2a; rightmost panel represents further enlargement of the area shown in the white box. (e) PLA of FAMIN and PMP70 (red) in THP-1 macrophages. DAPI, blue; scale bar = 5 μm. (f,g) Co-localization by IF of FASN (red) with catalase (green) in M1 and M2 macrophages. DAPI, blue; scale bar = 5 μm. (h,i) PLA of FASN and catalase (yellow) in M1 and M2 macrophages. DAPI, blue; scale bar = 5 μm. Data are representative of three independent experiments (ae) or one experiment with three mice and six (f,g) or ten (h,i) cells imaged per sample (fi; mean ± S.E.M.).
Figure 2
Figure 2. FAMIN promotes glycolysis and glucose flux into de novo lipogenesis.
(ad) Measurement of 13C-labelled C16:0 and C18:1 fatty acyl CoA following a 24 h pulse with 1,2-13C-glucose in mFamin–/– and mFamin+/+ M1 and M2 macrophages (MΦ). (e,f) Measurement of total fatty acyl CoA in M1 and M2 macrophages. (g,h) Measurement of 13C-labelled C16:0 and total fatty acyl carnitine (FaCN) following a 24 h pulse with 1,2-13C-glucose in M2 macrophages. (ik) Extracellular rate (ECAR) of M0, M1 and M2 macrophages given sequential treatment (dotted vertical lines) with oligomycin (Oligo) and 2-deoxyglucose (2-DG). (l) Citrate levels in M1 and M2 macrophages. Each symbol (ah, l) represents an individual mouse; small horizontal lines and error bars indicate the mean ± S.E.M. *P < 0.05, **P < 0.01, *** P < 0.001 (Unpaired, two-tailed Student’s t-test; Grubb’s test outlier exclusion). Data are from one experiment with six (ah) or seven mice (l) or one experiment with three mice representative of three independent experiments (ik; mean ± S.E.M.).
Figure 3
Figure 3. FAMIN augments fatty acid oxidation.
(a,b) Oxygen consumption rate (OCR) of mFamin–/– and mFamin+/+ M1 and M2 macrophages (MΦ) ± 20 μM C75 followed by sequential treatment (dotted vertical lines) with oligomycin (Oligo), FCCP, and rotenone plus antimycin (Rot + ant). Spare respiratory capacity (SRC) as depicted and refers to difference between maximal and basal respiratory capacities. (ce) Basal respiratory and maximal respiratory capacity in M1 macrophages (n = 6) and M2 macrophages ± C75 (n = 14/13/9/7). (fh) OCR and extracellular acidification rate (ECAR) of M1 and M2 macrophages silenced for Cpt1a (Cpt1a siRNA) or scrambled siRNA (Ctrl siRNA). *P < 0.05, **P < 0.01 (Unpaired, two-tailed Student’s t-test). Data are from one experiment with three mice representative of three independent experiments (a,b,fh; mean ± S.E.M.) or pooled from two or more independent experiments (ce; mean ± S.E.M.).
Figure 4
Figure 4. FAMIN controls FAO of endogenously synthesized lipids
(a,b) Basal ECAR of mFamin–/– and mFamin+/+ M1 and M2 macrophages (MΦ) ± 20 μM C75. (ce) OCR of M2 macrophages cultured in serum free medium and treated as indicated with 40 μM etomoxir (ETO) for 1 h and supplemented with bovine serum albumin (BSA) conjugated palmitate (PALM) or BSA alone prior to OCR measurement. (f) ATP quantification in M1 and M2 macrophage lysates (n = 8). (g) Phosphocreatine (PCr) levels in M1 and M2 macrophages. Each symbol (f,g) represents an individual mouse; small horizontal lines and error bars indicate the mean ± S.E.M. *P < 0.05, **P < 0.01 (Unpaired, two-tailed Student’s t-test). Data are from one experiment with three mice representative of three independent experiments (ae; mean ± S.E.M.) or from one experiment with eight (f) or seven mice (g).
Figure 5
Figure 5. FAMIN-deficient macrophages have impaired mitochondrial ROS production and exhibit features of mitochondrial injury and remodeling.
(a) Transmission electron microscopy of M1 and M2 macrophages (MΦ) showing mitochondria; black arrowheads show mitochondria that are elongated and amorphous in mFamin–/– M1 macrophages and narrower in mFamin–/– M2 macrophages compared to mFamin+/+ controls (white arrowheads). N = nucleus, scale bar = 1 μm and (b) quantification of mitochondrial size. (c,d) Mitochondrial ROS in unstimulated mFamin–/– and mFamin+/+ M1 and M2 macrophages stained with a red fluorescent mitochondrial superoxide indicator and measured in relative fluorescence units, RFU. (ei) Zymosan induced ROS production in mFamin–/– and mFamin+/+ M1 macrophages treated as indicated for 16 h with 20 μM C75; or 1 h with 40 μM etomoxir (ETO) or 500 μM mitoTEMPO prior to stimulation; or silenced for Cpt1a (Cpt1a siRNA) or Cybb (Cybb siRNA) or scrambled siRNA (Ctrl siRNA); Left, ROS kinetic plots measured in relative light units, RLU and right, area under curve, AUC. *P < 0.05, **P < 0.01 (Mann–Whitney U-test (b) or unpaired, two-tailed Student’s t-test (cf,h)). Data are representative of one experiment with three mice and six cells imaged per sample (ab; mean ± S.E.M.) or from one experiment with three mice representative of at least two independent experiments (ci; mean ± S.E.M.).
Figure 6
Figure 6. FAMIN.pI254V is hypomorphic and FAMIN.pC284R leads to complete loss of function.
(ad) Extracellular rate (ECAR) and Oxygen consumption rate (OCR) in murine M1 and M2 macrophages (MΦ) from mFamin–/– and C57BL/6N mice natively homozygous for the human ‘risk’ rs3764147 [G] allele (‘mFaminp254V’) or ‘non-risk’ [A] allele (‘mFaminp254I’) or Mendelian ‘risk’ variant (‘mFaminp284R’) at corresponding nucleotides of the murine gene. (e) Zymosan-stimulated ROS production in mFaminp254I, mFaminp254V, mFaminp284R and mFamin–/– M1 macrophages measured in relative light units, RLU. (f) Zymosan induced ROS production in mFaminp254I and mFamin p254V M1 macrophages treated as indicated for 16 h with 20 μM C75. (g) Immunoblot (IB) for FAMIN and Strep-tag in HEK293 cells with stable expression of N-terminal Strep-tagged FAMIN.p254I, FAMIN.p254V, FAMIN.p284R or vector control; β-actin loading control. (h) Co-localization by immunofluorescence of FAMIN (green) and calreticulin (red). DAPI, blue; scale bar = 5 μm. (i) Zymosan-stimulated ROS production in PBMC-derived M2 macrophages from healthy donors homozygous for the Crohn’s disease and leprosy risk (‘rs3764147G/G’) and non-risk (‘rs3764147A/A’) haplotypes; n = 10. (j) PMA-stimulated ROS production in neutrophils; Left, ROS kinetic plots and right, area under curve/peak height. Each symbol (i,j) represents an individual donor; small horizontal lines and error bars indicate the mean ± S.E.M. *P < 0.05, **P < 0.01 (Unpaired, two-tailed Student’s t-test). Data are from one experiment with three mice representative of two independent experiments (af; mean ± S.E.M), representative of three independent experiments (g,h) or pooled from 10 independent experiments (i,j).
Figure 7
Figure 7. FAMIN deficiency causes defective bacterial clearance and inflammasome activation, in vitro.
(a) mFamin–/– and mFamin+/+ M0 macrophages (MΦ) infected with Bacillus Calmette Guérin (BCG), containing a luciferase reporter gene; relative light units (RLU) measured at 0, 4, or 24 h. (b) Infection with BCG of human PBMC-derived M0 macrophages, silenced for FAMIN or scrambled siRNA control. (c) mFamin–/– and mFamin+/+ M0 macrophages infected with S. Typhimurium SL1344 in either serum containing or serum free medium; colony forming units, CFU. (d) Immunoblot (IB) of IL-1β and caspase 1 from mFamin–/– and mFamin+/+ M1 macrophages cell lysates (Lys) and supernatants (Sup); β-actin loading control. M1 macrophages were pretreated with 500 ng/mL of LPS for 2 h in serum free media and stimulated for 15 min with ATP. (e) IB of IL-1β in M1 macrophage cell supernatants; macrophages were pretreated as in (d) ± 100 μM etomoxir (ETO). (f) IL-1β levels in supernatants of M1 macrophages stimulated with 200 μg/mL of zymosan, pre-treated for 2 h with 100 μM etomoxir (ETO). (gi) TNF, CXCL1 and IL-6 levels in supernatants of M1 macrophages stimulated with 1μg/mL of LPS pre-treated for 2 h with 100 μM etomoxir (ETO). *P < 0.05, **P < 0.01 (One-way ANOVA with post-hoc Bonferroni (a,b) or unpaired, two-tailed Student’s t-test (c,fi)). Data are from one experiment with three mice representative of three independent experiments (a,di; mean ± S.E.M.) or from one experiment with six independent samples per group (b,c; mean ± S.E.M.).
Figure 8
Figure 8. FAMIN deficiency causes dysregulated response to endotoxin in vivo.
(ad) IL-1β, TNF, CXCL1 and IL-6 serum levels 2 h after intraperitoneal (i.p.) injection of LPS (2 mg/kg) of mFamin–/– and mFamin+/+ mice. (e) Clinical scoring of sepsis severity (maximum score 15) and (f) IL-1β serum levels 3 h after i.p. injection of LPS (10 mg/kg) of mFamin–/– and mFamin+/+ mice. (g) IL-1β serum levels 3 h after i.p. injection of LPS in 5 week-old mice homozygous for mFaminp254I-284C and their homozygous littermate mFaminp254V-284C controls; and homozygous mFaminp254V-284R mice and their homozygous mFaminp254V-284C littermate controls; (h,i) clinical scores of sepsis severity (maximum score 15). Each symbol (ad,g) represents an individual mouse; small horizontal lines and error bars indicate the mean ± S.E.M. *P < 0.05, **P < 0.01 (Unpaired, two-tailed Student’s t-test (ad,f,g) or linear mixed model (e,h,i)). Data are from one experiment with four mice per group (ad), three mice per group (e,f; mean ± S.E.M.) or seven (mFaminp254I-284C), four (mFaminp254V-284C, mFaminp254V-284C) or five (mFaminp254V-284R) mice (gi; mean ± S.E.M.).

References

    1. Wakil SM, et al. Association of a mutation in LACC1 with a monogenic form of systemic juvenile idiopathic arthritis. Arthritis & rheumatology. 2015;67:288–295. - PubMed
    1. Patel N, et al. Study of Mendelian forms of Crohn's disease in Saudi Arabia reveals novel risk loci and alleles. Gut. 2014;63:1831–1832. - PubMed
    1. Liu H, et al. Discovery of six new susceptibility loci and analysis of pleiotropic effects in leprosy. Nature genetics. 2015;47:267–271. - PubMed
    1. Jostins L, et al. Host-microbe interactions have shaped the genetic architecture of inflammatory bowel disease. Nature. 2012;491:119–124. - PMC - PubMed
    1. Hruz T, et al. Genevestigator v3: a reference expression database for the meta-analysis of transcriptomes. Advances in bioinformatics. 2008;2008 420747. - PMC - PubMed

MeSH terms

Supplementary concepts