

Epidemiology and etiology of influenza-like-illness in households in Vietnam; it's not all about the kids!
- PMID: 27479176
- PMCID: PMC4994428
- DOI: 10.1016/j.jcv.2016.07.014
Epidemiology and etiology of influenza-like-illness in households in Vietnam; it's not all about the kids!
Abstract
Background: Household studies provide opportunities to understand influenza-like-illness (ILI) transmission, but data from (sub)tropical developing countries are scarce.
Objective: To determine the viral etiology and epidemiology of ILI in households.
Study design: ILI was detected by active case finding amongst a cohort of 263 northern Vietnam households between 2008 and 2013. Health workers collected nose and throat swabs for virus detection by multiplex real-time RT-PCR.
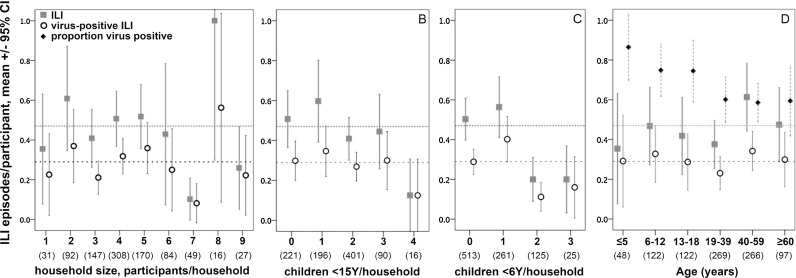
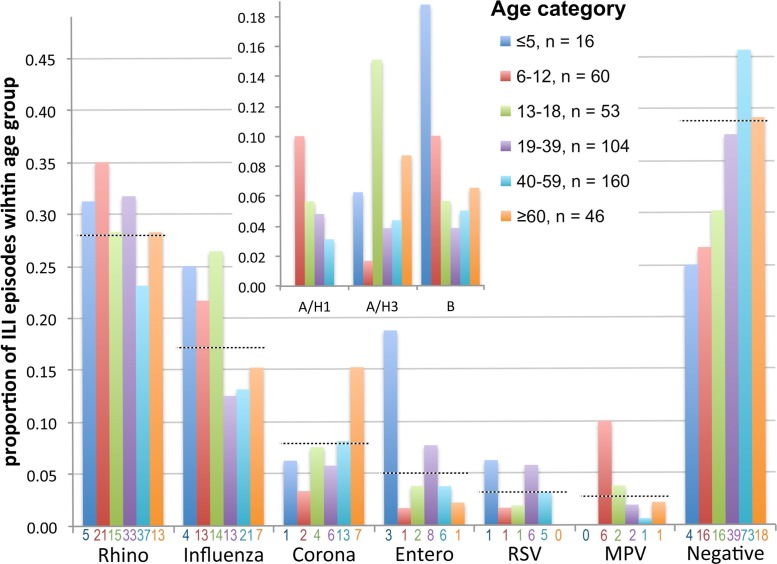
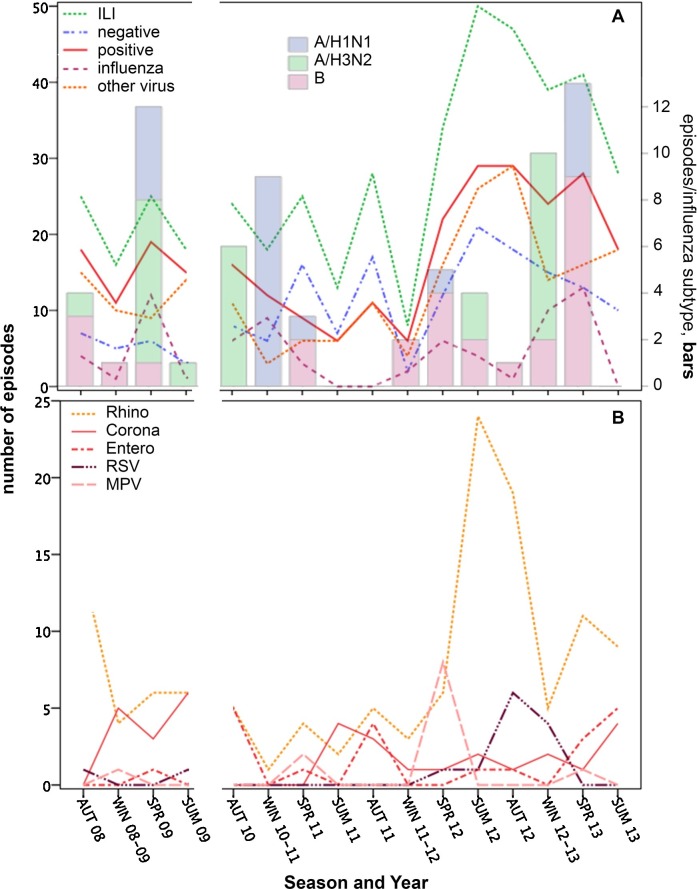
Results: ILI was detected at least once in 219 (23.7%) of 945 household members. 271 (62.3%) of 435 nose/throat swabs were positive for at least one of the 15 viruses tested. Six viruses predominated amongst positive swabs: Rhinovirus (28%), Influenza virus (17%), Coronavirus (8%), Enterovirus (5%), Respiratory syncytial virus (3%), Metapneumovirus virus (2.5%) and Parainfluenza virus 3 (1.8%). There was no clear seasonality, but 78% of episodes occurred in Winter/Spring for Influenza compared to 32% for Rhinovirus. Participants, on average, suffered 0.49 ILI, and 0.29 virus-positive ILI episodes, with no significant effects of gender, age, or household size. In contrast to US and Australian community studies, the frequency of ILI decreased as the number of household members aged below 5 years increased (p=0.006).
Conclusion: The findings indicate the need for tailored ILI control strategies, and for better understanding of how local childcare practices and seasonality may influence transmission and the role of children.
Keywords: Active case finding; Cohort; Household transmission; Influenza-like-illness; Respiratory viruses; Vietnam.
Copyright © 2016 The Authors. Published by Elsevier B.V. All rights reserved.
Figures

References
-
- Organization WHO . World Health Organization; 2013. WHO Methods and Data Sources for Global Causes of Death 2000–2011.
-
- Lambert S.B., Allen K.M., Druce J.D. Community epidemiology of human metapneumovirus, human coronavirus NL63, and other respiratory viruses in healthy preschool-aged children using parent-collected specimens. Pediatrics. 2007;120:e929–e937. - PubMed
Publication types
MeSH terms
Grants and funding
LinkOut - more resources
Full Text Sources
Other Literature Sources
Medical
