Comment
. 2016 Aug 1:3:160056.
doi: 10.1038/sdata.2016.56.

Species interactions in occurrence data for a community of tick-transmitted pathogens

Affiliations
Comment

Species interactions in occurrence data for a community of tick-transmitted pathogens

Agustín Estrada-Peña et al. Sci Data. .

Abstract

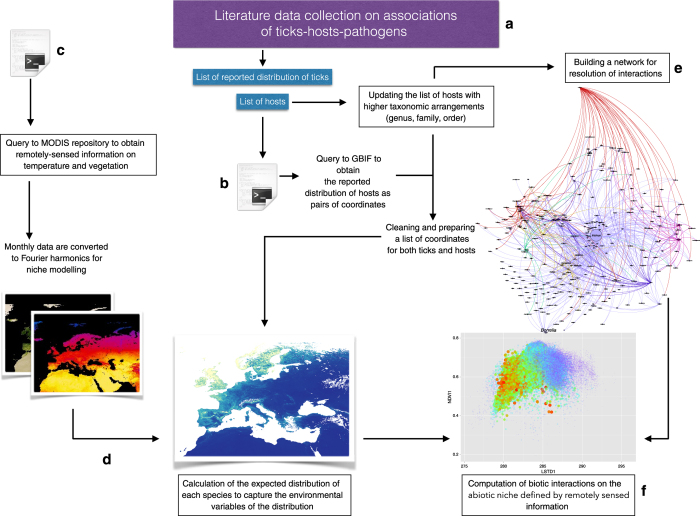
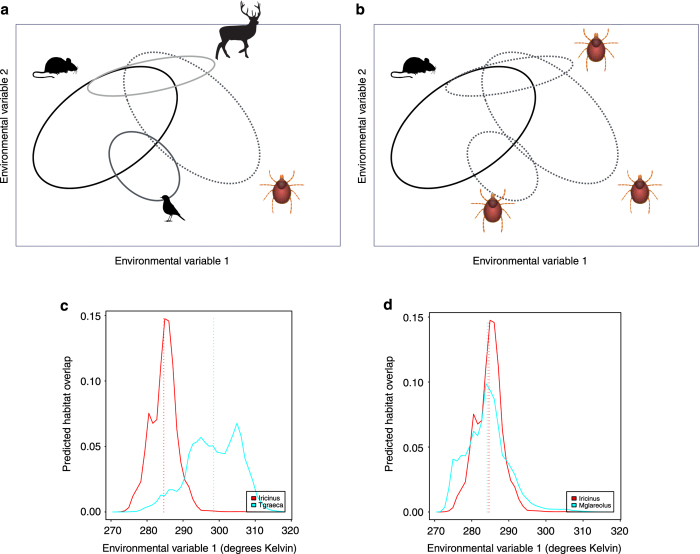
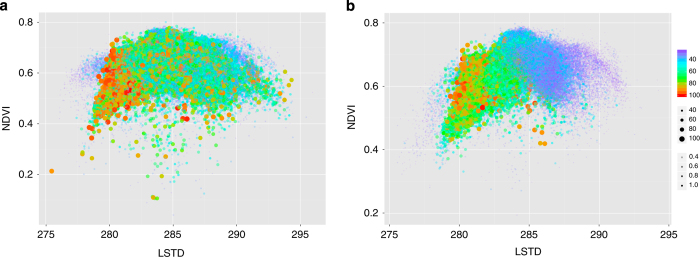
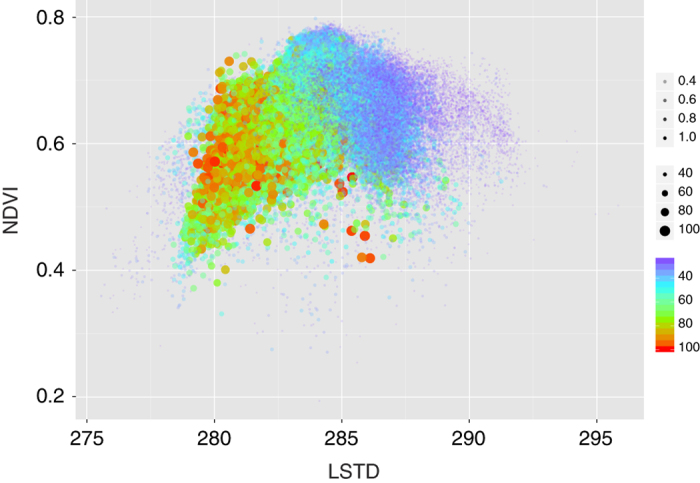
Interactions between tick species, their realized range of hosts, the pathogens they carry and transmit, and the geographic distribution of species in the Western Palearctic were determined based on evidence published between 1970-2014. These relationships were linked to remotely sensed features of temperature and vegetation and used to extract the network of interactions among the organisms. The resulting datasets focused on niche overlap among ticks and hosts, species interactions, and the fraction of the environmental niche in which tick-borne pathogens may circulate as a result of interactions and overlapping environmental traits. The resulting datasets provide a valuable resource for researchers interested in tick-borne pathogens, as they conciliate the abiotic and biotic sides of their niche, allowing exploration of the importance of each host species acting as a vertebrate reservoir in the circulation of tick-transmitted pathogens in the environmental niche.


Conflict of interest statement

The authors declare no competing financial interests.

Figures

Figure 1
Figure 1. The data acquisition workflow.
Data were acquired primarily from literature on the associations of ticks, hosts, and transmitted pathogens using several scripts prepared in the R programming environment to query data repositories (a). These queries locate and download the reported distribution of the vertebrates reported as hosts for ticks or reservoirs for pathogens (b) and the remotely sensed information to produce the variables of the environmental niche (c). This allows calculation of the environmental niche for each species of host and tick (d) and the computation of an epidemiological network involving all reported associations between vertebrates, ticks, and pathogens (e), ranking the relative importance of each species in the network. The last step (f) involves evaluating the habitat overlap between hosts and ticks, the host availability for each species of tick, and adequate weighing according to derived relationships.
Figure 2
Figure 2. The structure of interactions between hosts and vectors in the environmental niche.
The multivariate environmental niche is represented by only two variables (X and Y). The expected occurrence of ticks or hosts is represented by ellipses that account for the portions of the niche where permanent populations of the organisms can prevail. The intersection of these ellipses represent the portions of the environmental niche in which species can interact because they share parts of the niche. We represent two different kinds of interactions. (a) Several hosts interact with only one species of tick. (b) Several species of ticks interact with only one host species. The framework accounts for the niche overlap between suitable hosts and vectors and includes the importance of each host for the tick to evaluate the ‘strength’ of the interaction where niches overlap. (c and d) The niche utilization and overlap between the tick Ixodes ricinus and two reported hosts, Testudo graeca (c) and Myodes glareolus (d), in the dimension of the annual mean temperature with low niche overlap in the pictured dimension in (c). (d) Almost identical use of environmental resources by both the tick and that host. Broken lines indicate the median of the preferred niche occupancy.
Figure 3
Figure 3. The plot of the predicted niche occupancy for the tick Ixodes ricinus calculated on the dimensions of average ground temperature (LSTD, in Kelvins) and average vegetation (NDVI, no unit).
The plot indicates the intervals of the niche in which the tick can find suitable conditions for persistence considering only its abiotic component (a) or including the niche overlap with its reported hosts (b): the sum of the products of the habitat overlap of each host-tick pair multiplied by the centrality of each host in the epidemiological network and rescaled to the 0–100 interval to allow comparisons. For both panels, the predicted niche occurrence of the tick is indicated by the size, color, and transparency of the dot, combined. Transparency has been included to improve readability because each plot has more than 1.5 million dots.
Figure 4
Figure 4. The plot of the predicted niche occupancy for the Borrelia burgdorferi complex obtained in the dimensions of the average ground temperature (LSTD, in Kelvins) and average vegetation (NDVI, no unit).
The plot was obtained according to the evaluation of environmental suitability for the tick vector, habitat overlap with its reported hosts, and relative importance of each host in supporting the circulation of borreliae as obtained from an epidemiological network evaluating the importance of each reservoir. For both panels, the predicted niche occurrence of the pathogen is indicated by the size, color, and transparency of the dot, combined. Transparency has been included to improve readability.
Figure 5
Figure 5. An example of the performance of the proposed framework to track the impact of climate trends on the expected occurrence of pathogens transmitted by ticks when the expected niche occupancy is plotted against the environmental niche instead of the geographic dimensions.
The plots show the expected niche occupancy of the Borrelia pathogens in two dimensions of temperature (a) and two dimensions of the Normalized Difference Vegetation Index (NDVI) (b). The first dimension is the annual average temperature (LSTD1) or NDVI (NDVI1). The second dimension is the slope of the spring time temperature (LSTD2) or NDVI (NDVI2). Gray squares in both plots assume a set of hypothetical current conditions under which the pathogen could find a range of values of expected occurrence. A hypothetical climate shift, marked by a black square in the figure, would ‘move’ the environmental conditions to a different position. Because organisms track their niche, the predicted occupancy would shift and the change is easy to track.

Comment on

References

Data Citations

    1. Estrada-Peña A., de la Fuente J. 2016. Dryad. http://dx.doi.org/10.5061/dryad.2h3f2 - DOI

References

    1. Wisz M. S. et al. The role of biotic interactions in shaping distributions and realised assemblages of species: implications for species distribution modelling. Biol. Rev. 88, 15–30 (2013). - PMC - PubMed
    1. Estrada-Peña A. & de la Fuente J. The ecology of ticks and epidemiology of tick-borne viral diseases. Antiviral Res. 108, 104–128 (2014). - PubMed
    1. Meller L. et al. Ensemble distribution models in conservation prioritization: from consensus predictions to consensus reserve networks. Div. Dist. 20, 309–321 (2014). - PMC - PubMed
    1. Estrada-Pena A. & Venzal J. M. Climate niches of tick species in the Mediterranean region: modeling of occurrence data, distributional constraints, and impact of climate change. J. Med. Entomol. 44, 1130–1138 (2007). - PubMed
    1. Hartemink N. et al. Integrated mapping of establishment risk for emerging vector-borne infections: a case study of canine leishmaniasis in southwest France. PLoS ONE 6, e20817 (2011). - PMC - PubMed

Publication types