

doi: 10.1038/nmeth.3955.
Epub 2016 Aug 1.
Virtual microfluidics for digital quantification and single-cell sequencing
Affiliations
- PMID: 27479330
- PMCID: PMC5007149
- DOI: 10.1038/nmeth.3955
Item in Clipboard
Virtual microfluidics for digital quantification and single-cell sequencing
Nat Methods.
2016 Sep.
Abstract
We have developed hydrogel-based virtual microfluidics as a simple and robust alternative to complex engineered microfluidic systems for the compartmentalization of nucleic acid amplification reactions. We applied in-gel digital multiple displacement amplification (dMDA) to purified DNA templates, cultured bacterial cells and human microbiome samples in the virtual microfluidics system, and demonstrated whole-genome sequencing of single-cell MDA products with excellent coverage uniformity and markedly reduced chimerism compared with products of liquid MDA reactions.
Figures
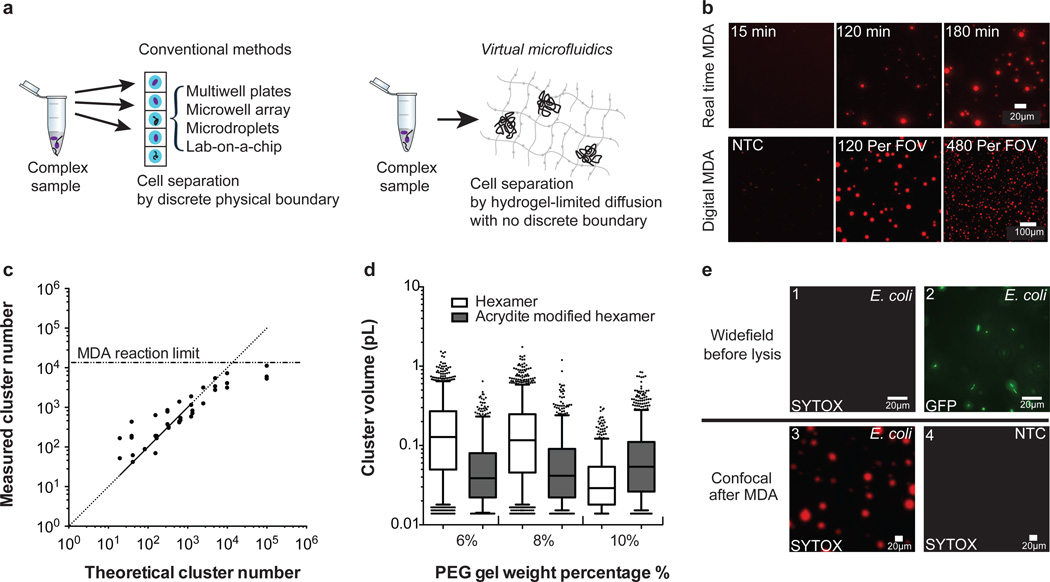
Application of Virtual Microfluidics for single molecule and single cell analysis. (a) Methods for single-cell analysis. Conventional approaches for single-cell analysis require discrete physical boundaries. Virtual microfluidics relies on hydrogel-limited diffusion to compartmentalize templates and reaction products. (b) Real time and digital MDA in PEG hydrogel. The top row shows time-lapse epifluorescence images (SYTOX Orange DNA stain) illustrating MDA cluster growth. Each template molecule gives rise to an amplified cluster of DNA in the gel. The bottom row demonstrates increasing DNA cluster number per 650 nm × 650 nm field of view (FOV) with increasing input template concentration. (c) Calibration curve illustrates linear relationship between template concentration and cluster number (n = 2 or 3 FOV at each concentration). (d) MDA cluster size is correlated with gel weight percentage and affected by acrydite modified hexamer anchorage. Data are shown as 5 %-95 % box plots with outliers scattered and center line for median. (n = 1334, 1587, 684, 704, 869, 1301). (e) Whole genome amplification of E. coli. 1) Before lysis, lab cultured E. coli are alive and are not detected by SYTOX Orange staining. 2) The same field of view shown where individual hydrogel-encapsulated E. coli are readily identifiable by GFP expression prior to MDA 3) After MDA, product clusters were readily identified by SYTOX Orange staining (different FOV than part 2). The high DNA content of clusters led to image saturation in this case. 4) No MDA product clusters were identified by SYTOX Orange staining after MDA in a negative control (no E. coli) sample.
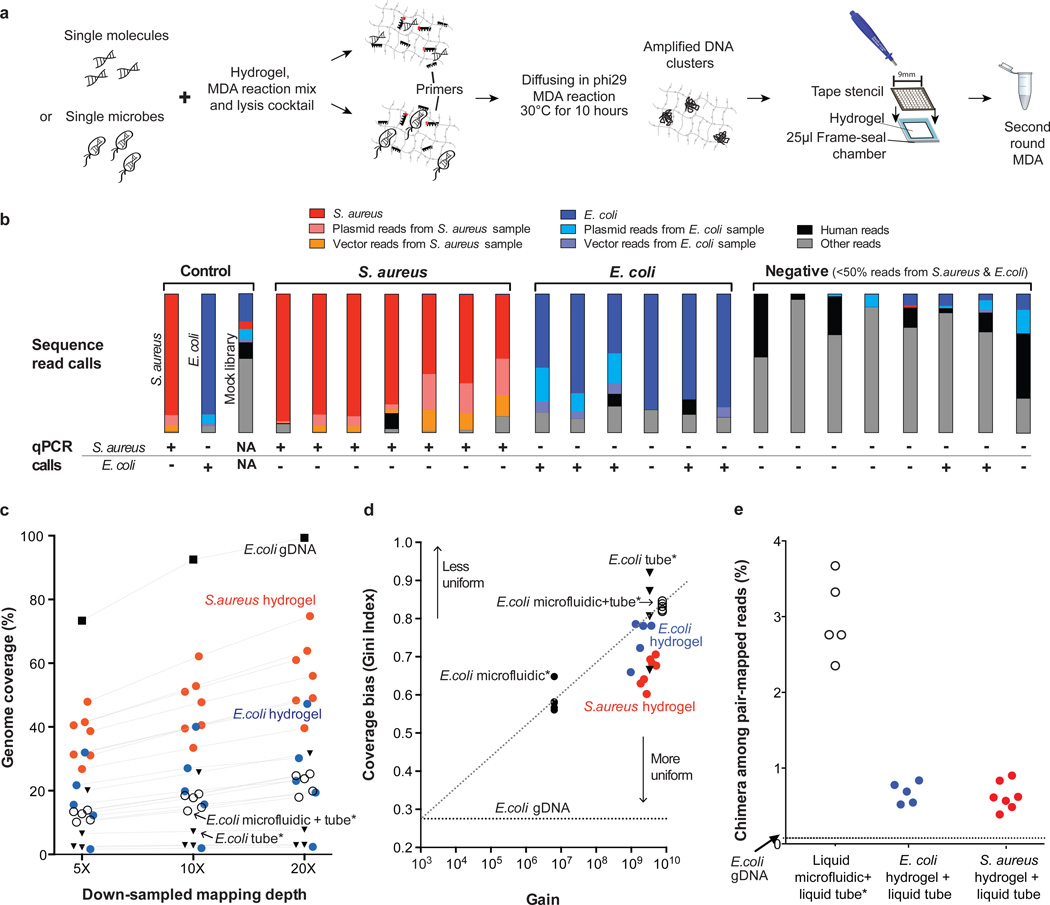
Single-cell whole genome sequencing from E. coli and S. aureus hydrogel WGA samples. (a) Virtual microfluidics WGA workflow. (b) Sequence read classification using BLAST against the corresponding databases (Supplementary Note). The samples were ordered based on the ratio of S. aureus to E. coli reads from shotgun sequencing and the fraction of reads not from S. aureus or E. coli. Two negative samples are classified as false positive PCR calls. Positive S. aureus and E. coli samples with matching PCR calls are included in downstream analyses. (c) Genome coverage in S. aureus and E. coli hydrogel punch samples compared with published single-cell E coli data produced using conventional liquid MDA reactions*. One E. coli outlier library showed extremely poor genome coverage. This library had low complexity (37 % duplicate reads), which points to poor library quality rather than MDA as the cause for low genome coverage. (all samples were randomly down-sampled based on mapped reads and bootstrapped 10 times; error in all cases was smaller than the symbols plotted). (d) Coverage distribution bias. Gini Index (derived from Lorenz curve) reports the genome coverage bias of single-cell E. coli and S. aureus punches compared to the same published liquid-MDA single-cell E. coli data as a function of amplification gain. (e) Chimera frequency in the virtual microfluidics samples is significantly reduced versus published E. coli data produced using standard liquid MDA reactions. * Indicates liquid MDA data from de Bourcy et al 2014.
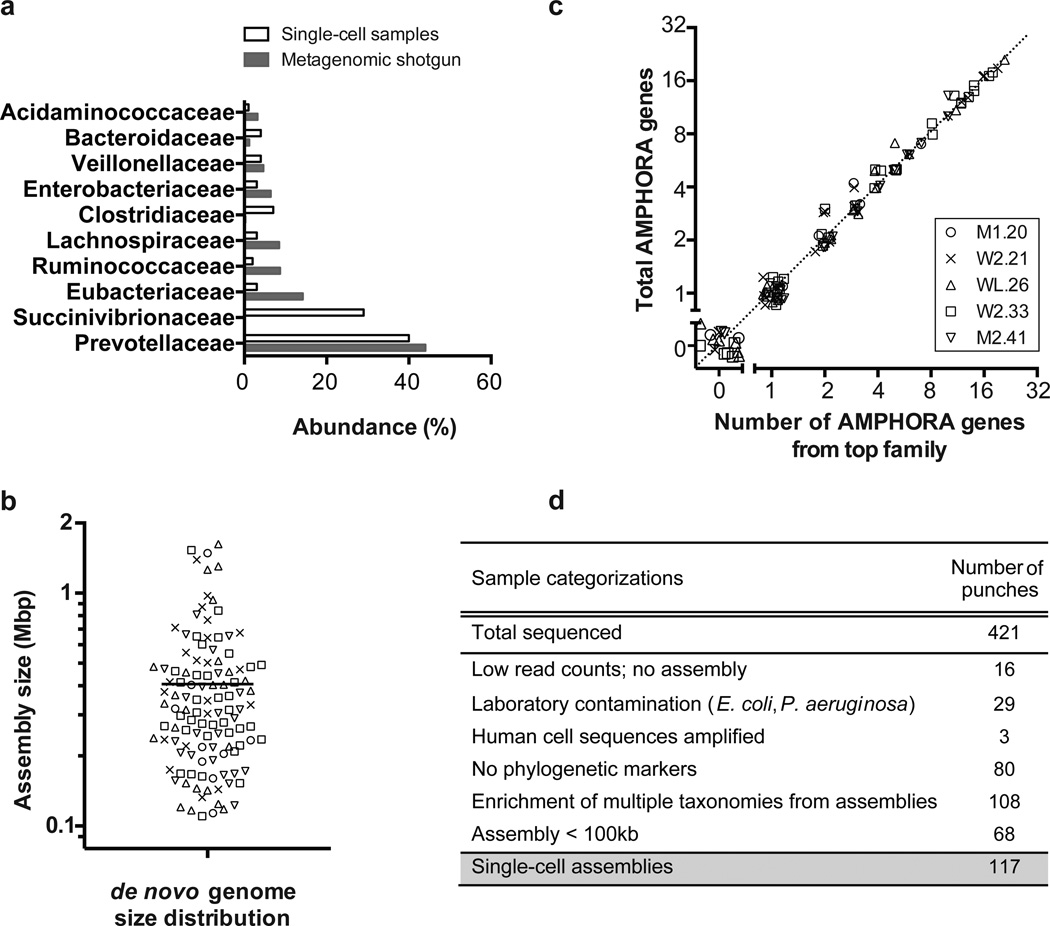
Fiji microbiome project single-cell whole genome sequencing (n = 117 single-cell datasets). (a). Single-cell and metagenome shotgun taxonomies. Here we compared the distributions of taxonomic families from single-cell assemblies that originated from 5 different donor individuals, with the distributions of microbial families determined from metagenome shotgun sequencing (Samples were weighted according to the number of single cells analyzed from each stool sample, see Supplementary Table 8). We were able to capture single-cell datasets from at least 9 of the top 10 bacterial families observed by shotgun metagenomic analysis of the Fijian samples. (b) de novo assembly size ranging from 100 kbp to 2 Mbp were obtained from single-cell sequencing data. The line indicates the mean assembly size. (c) AMPHORA gene analysis. We used BLAST to identify phylogenetically conserved single copy marker genes (AMPHORA genes) in the single-cell samples. Here we show the total number of AMPHORA genes and the number of AMPHORA genes from the top phylogenetic family for each sample. That these values are approximately equal (dotted line) supports the assertion that each dataset arises from an individual bacterial cell. A Gaussian-distributed random jitter (µ = 0, σ2 = 0.1) was added to enhance the visualization of these results. (d) Overview of FijiCOMP single-cell hydrogel samples.
References
-
- Rinke C, et al. Insights into the phylogeny and coding potential of microbial dark matter. Nature. 2013;499:431–437. - PubMed
MeSH terms
Substances
Grants and funding
LinkOut - more resources
Full Text Sources
Other Literature Sources
Molecular Biology Databases
