. 2016 Sep;34(9):962-72.
doi: 10.1038/nbt.3637. Epub 2016 Aug 1.

Analyzing tumor heterogeneity and driver genes in single myeloid leukemia cells with SBCapSeq

Affiliations

Analyzing tumor heterogeneity and driver genes in single myeloid leukemia cells with SBCapSeq

Karen M Mann et al. Nat Biotechnol. 2016 Sep.

Abstract

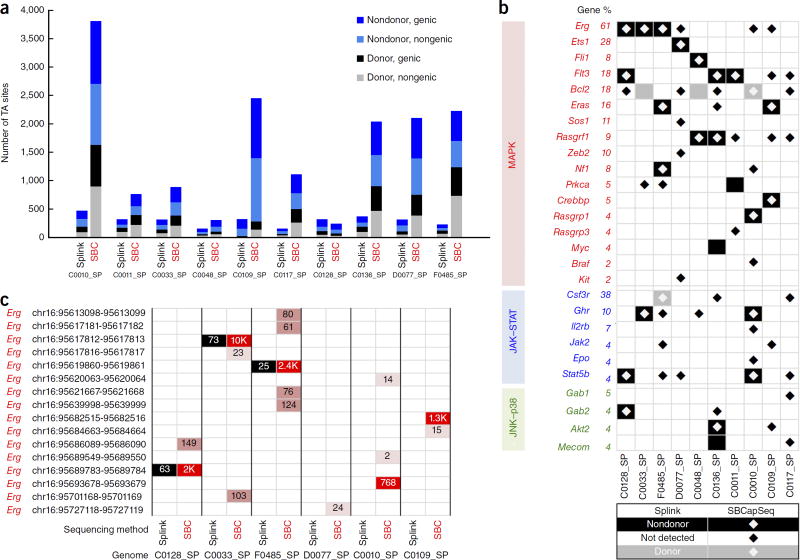
A central challenge in oncology is how to kill tumors containing heterogeneous cell populations defined by different combinations of mutated genes. Identifying these mutated genes and understanding how they cooperate requires single-cell analysis, but current single-cell analytic methods, such as PCR-based strategies or whole-exome sequencing, are biased, lack sequencing depth or are cost prohibitive. Transposon-based mutagenesis allows the identification of early cancer drivers, but current sequencing methods have limitations that prevent single-cell analysis. We report a liquid-phase, capture-based sequencing and bioinformatics pipeline, Sleeping Beauty (SB) capture hybridization sequencing (SBCapSeq), that facilitates sequencing of transposon insertion sites from single tumor cells in a SB mouse model of myeloid leukemia (ML). SBCapSeq analysis of just 26 cells from one tumor revealed the tumor's major clonal subpopulations, enabled detection of clonal insertion events not detected by other sequencing methods and led to the identification of dominant subclones, each containing a unique pair of interacting gene drivers along with three to six cooperating cancer genes with SB-driven expression changes.


Conflict of interest statement

COMPETING FINANCIAL INTERESTS

The authors declare no competing financial interests.

Figures

Figure 1
Figure 1
SB mutagenesis drives ML development in mice. (a) Three cohorts of mice with wild-type Trp53 (Trp53+/+), Trp53+/− or Trp53R172H/+ were generated and aged for tumors. All mice developed hematopoietic disease but Trp53+/− and Trp53R172H/+ mice had significantly decreased survival compared to the WT cohort (P < 0.0001, log-rank). (b,c) Histological analysis of tumor cell differentiation in the red pulp of the spleen (b) and in the subcapsular area (c), shown at 1,000x magnification. Histological analysis was performed on all mice in each cohort. Tumor cell differentiation representative of all cohorts is shown in (b) for the red pulp in a Trp53+/+ animal and (c) for the subcapsular area in a Trp53+/− animal. (d,e) MPO staining in poorly differentiated regions (d) and PAX5 staining of tumor cells in the subcapsular area (e), shown at 400x magnification. Scale bars, 100 µm (b–e). MPO and PAX5 staining was performed on all animals in each cohort and half showed positive MPO staining (d) in poorly differentiated regions and half showed positive PAX5 staining (e) in the subcapsular area. Representative images from Trp53+/+ mice are shown. (f) Statistical analysis of SB insertions present in ≥3 tumors at a read depth of ≥5 (based on splink 454 sequencing) identified 35 CCGs that are highly represented in SB-ML. Genes are plotted on the basis of mean read depth (y axis) relative to the median number of reads (x axis); SB insertions are predicted to activate 80% of these genes (blue) and inactivate 20% (red). CIS, common insertion site.
Figure 2
Figure 2
Trunk drivers are enriched in key signaling pathways and exhibit significant interactions. (a) Statistically defined ML trunk drivers are enriched in MAPK, JAK-STAT and JNK-p38 signaling. The incidence of SB insertions in CCGs across the ML tumor population is depicted as an oncoprint; CCGs are shown on the y axis; individual tumors are listed on the x-axis. Bars indicate the presence of an SB insertion on nondonor (black) or donor (gray) chromosomes. (b) Top, schematic of SB insertions in Erg, which are predicted to drive expression of a truncated transcript encoding the ETS domain. Bottom, microarray analysis of Erg expression in tumors with (yes) and without (no) SB insertions in Erg. Box boundaries indicate interquartile range; whiskers indicate maximum and minimum values; center lines indicate medians. (c) Statistically defined relationships among trunk drivers and other ML CCGs. Blue circles represent trunk drivers predicted to be activated by SB insertions; red circles represent genes predicted to be inactivated; gray circles represent genes predicted to co-occur with the trunk drivers. Trunk driver CCGs are shown in black text; ML CCGs not defined as trunk drivers are shown in blue. Solid lines depict co-occurrence relationships; dotted lines indicate mutually exclusive relationships. Line weights indicate the significance of the interaction (thick, P < 0.001, medium, P < 0.01, and thin, P < 0.05; Fisher’s exact test).
Figure 3
Figure 3
The SBCapSeq method for sequencing transposon insertions sites from tumors. (a) Capture hybridization probes (orange bars) were designed to hybridize to the first 120 nucleotides from the 5′end of the IRDRL transposon inverted repeat and the last 120 nucleotides from the 3′end of the IRDRR of the SB transposon. Capture probes contain biotin moieties that allow for capture by streptavidin beads. Blocking oligos (blue bars) were designed from vector sequence to minimize capture of unmobilized transposon remaining at the donor site where the transposon concatamer first integrated. Blocking oligos contain a bulky adduct (yellow circle) that prevents isolation by bead capture. IRDRL, inverted repeat direct repeat left; IRDRR, inverted repeat direct repeat right; SA, splice acceptor; MSCV, murine stem cell virus minimal promoter; SD, splice donor; En2-SA, engrailed 2 splice acceptor. (b) Liquid capture hybridization performed on DNA libraries prepared from sheared genomic tumor DNA enriched for DNA fragments containing transposon sequences. Fragments are isolated and sequenced on the Ion Torrent platform. A custom SBCapSeq bioinformatics pipeline then maps SB insertions to the mouse genome. (c) Sequence analysis of nine independent SB capture hybridization reactions from a single ML tumor library to assess reproducibility of the method for detecting reads (left) or fragments (right) with SB insertions in genes.
Figure 4
Figure 4
Comparison of SBCapSeq to SB splink 454. (a) Numbers of unique SB insertions detected with each method for ten ML tumors chosen randomly for direct comparison. (b) SB insertions in early progression drivers identified by splink 454 and/or SBCapSeq. (c) SBCapSeq and splink 454 analysis of SB insertions in Erg in multiple ML. The mapped locations of all insertions in the analyzed tumor genomes are shown on the left, and the presence of an insertion in a given tumor is denoted by a black bar if detected by splink 454 and a red or pink bar if identified by SBCapSeq. The number of sequencing reads supporting the insertion appear inside the bars. SBC, SBCapSeq.
Figure 5
Figure 5
WGS confirms SB insertions drive ML. (a) Distribution and representation of SB insertions throughout the D5 genome. Red bars indicate SB insertions identified by WGS with >1 read; pink bars represent SB insertions represented by a single read. Clonal insertions identified by SBCapSeq with ≥1,000 reads are represented by green bars; insertions with <1,000 reads are shown as orange bars. The cut-off was determined on the basis of the read depth at which the number of insertions in the tumor exceeded the number of insertions detected in tail DNA by fourfold. Data from ribo-depleted (whole-transcriptome sequencing, dark blue), and poly(A)-selected (mRNA, light blue) RNA-seq show coincidence of fusion transcripts with the SB insertions identified from DNA analysis and detection of fusion transcripts from subclonal SB insertion events. Genes with clonal SB insertion events are listed in the center of the plot. Black (significant after Bonferroni correction; P < 0.0.5) and gray bars highlight SB footprints identified by WGS. (b) Correlation of ML CCGs identified with high SB read counts by both SBCapSeq and WGS. Activated CCGs are depicted by blue dots; inactivated CCGs are depicted by red dots. Early progression drivers are shown in blue (activating mutations) or black (inactivating mutations) text. Asterisk denotes a secondary Notch1 SB insertion. SB insertions that are private to this tumor appear as gray dots if they map to the donor chromosome and black dots if they map to nondonor chromosomes. CIS, common insertion site. (c) SB insertion data from SBCapSeq and WGS for the D5 leukemic genome (D5_SP) and control tail (D6_TL). The number of CCGs was determined by comparing these genes to the 466 defined ML CCGs.
Figure 6
Figure 6
Single-cell analysis reveals mutually exclusive tumor cell populations. SBCapSeq analysis of 26 single cells isolated from the D5 leukemic spleen by FACS sorting using markers Ter119 (top red bars) or CD71 (top black bars). Hierarchical clustering of SB insertions found in ≥3 single cells at a read depth of ≥2 identified two distinct tumor subclones. One cluster (top left) is anchored by trunk drivers Erg and Ghr (green bars) and contains cells sorted with either cell surface marker. Other ML CCGs were identified in this cluster and are represented by blue bars. Many additional loci on both the donor chromosome (gray bars) and nondonor chromosomes (black bars) co-occur with these two drivers and may represent early passenger events or selected SB events that were not appreciated in earlier population-based analyses. Cells present in the other cluster (top right) were sorted with Ter119 and are anchored by insertions in Ets1 and Notch1. The cell CD71-D5_SP_SC95 grouped with both populations and may represent a failed single-cell sort. Bars at the right of the graph represent the same SB insertions identified in the bulk tumor by WGS and SBCapSeq.
Figure 7
Figure 7
Clonally selected SB insertion events affect gene expression in SB-ML. (a,b) RNA-seq analysis of SB-fusion transcripts confirmed the direct impact of clonally selected SB insertions identified in single cells on gene expression. Genes with SB insertions present in the single-cell cluster anchored by insertions in Erg and Ghr (a) or Ets1 and Notch1 (b) are shown. All genes contained an insertion found in ≥3 cells at a read depth of ≥2. Asterisks denote genes on the donor chromosome. Transcripts identified from bulk analysis of D5 leukemic spleen cells by RNA-seq are represented as the log10 ratio of SB-fusion transcripts compared to wild-type transcripts, defined by fragments per kilobase of transcript per million mapped reads from ribo-depleted (FsWTS) or poly(A)-selected (FsPolyA) RNA-seq. Green bars indicate enrichment of SB-fusion transcripts with SB inserted in the sense direction; yellow bars indicate SB fusion transcripts with SB inserted in the antisense direction. Gray bars represent genes for which the ratio of SB-fusion to normal transcripts was opposite to that predicted by the directionality of the SB insertion. Red and purple boxes denote evidence for SB insertions by WGS and SBCapSeq, respectively. Dark and light blue boxes denote evidence for RNA transcripts containing the splice donor or one of the splice acceptors present in the SB transposon for FsPolyA and FsWTS, respectively. Numbers indicate single cells sharing a single insertion for each gene.

References

    1. Mann MB, Jenkins NA, Copeland NG, Mann KM. Sleeping Beauty mutagenesis: exploiting forward genetic screens for cancer gene discovery. Curr. Opin. Genet. Dev. 2014;24:16–22. - PubMed
    1. Mann KM, Jenkins NA, Copeland NG, Mann MB. Transposon insertional mutagenesis models of cancer. Cold Spring Harb. Protoc. 2014;2014:235–247. - PubMed
    1. Mann MB, et al. Transposon mutagenesis identifies genetic drivers of BrafV600E melanoma. Nat. Genet. 2015;47:486–495. - PMC - PubMed
    1. Takeda H, et al. Transposon mutagenesis identifies genes and evolutionary forces driving gastrointestinal tract tumor progression. Nat. Genet. 2015;47:142–150. - PubMed
    1. Genovesi LA, et al. Sleeping Beauty mutagenesis in a mouse medulloblastoma model defines networks that discriminate between human molecular subgroups. Proc. Natl. Acad. Sci. USA. 2013;110:E4325–E4334. - PMC - PubMed

Publication types