. 2016 Aug 1;11(8):e0159292.
doi: 10.1371/journal.pone.0159292. eCollection 2016.

Sensitive and Quantitative Three-Color Protein Imaging in Fission Yeast Using Spectrally Diverse, Recoded Fluorescent Proteins with Experimentally-Characterized In Vivo Maturation Kinetics

Affiliations

Sensitive and Quantitative Three-Color Protein Imaging in Fission Yeast Using Spectrally Diverse, Recoded Fluorescent Proteins with Experimentally-Characterized In Vivo Maturation Kinetics

Bassem Al-Sady et al. PLoS One. .

Abstract

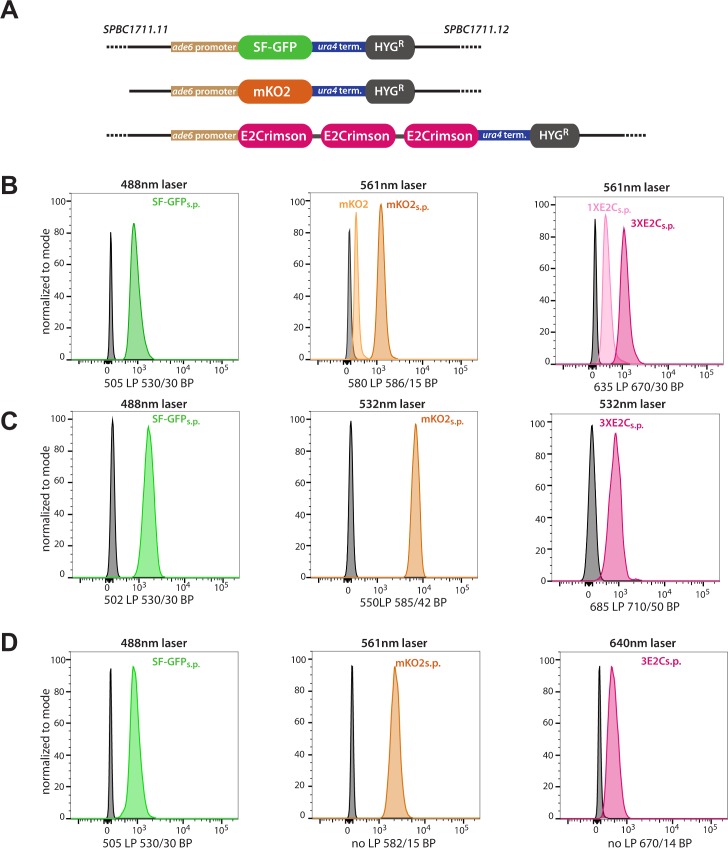
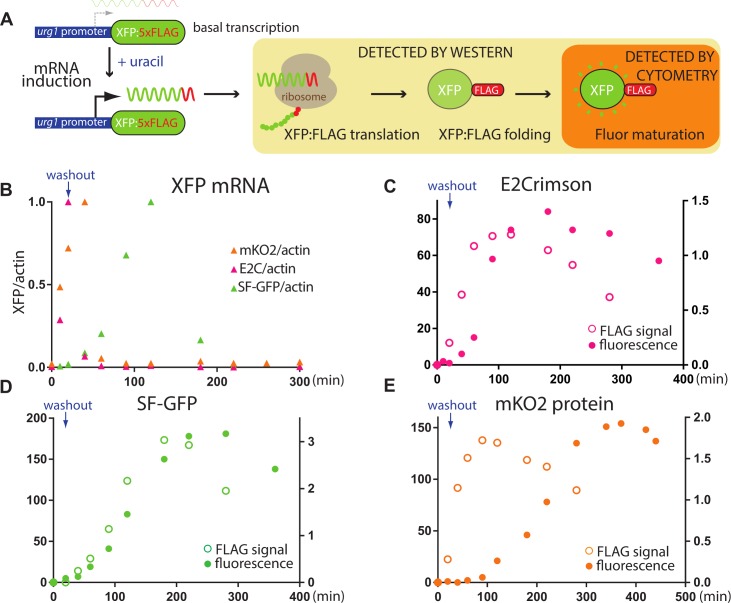
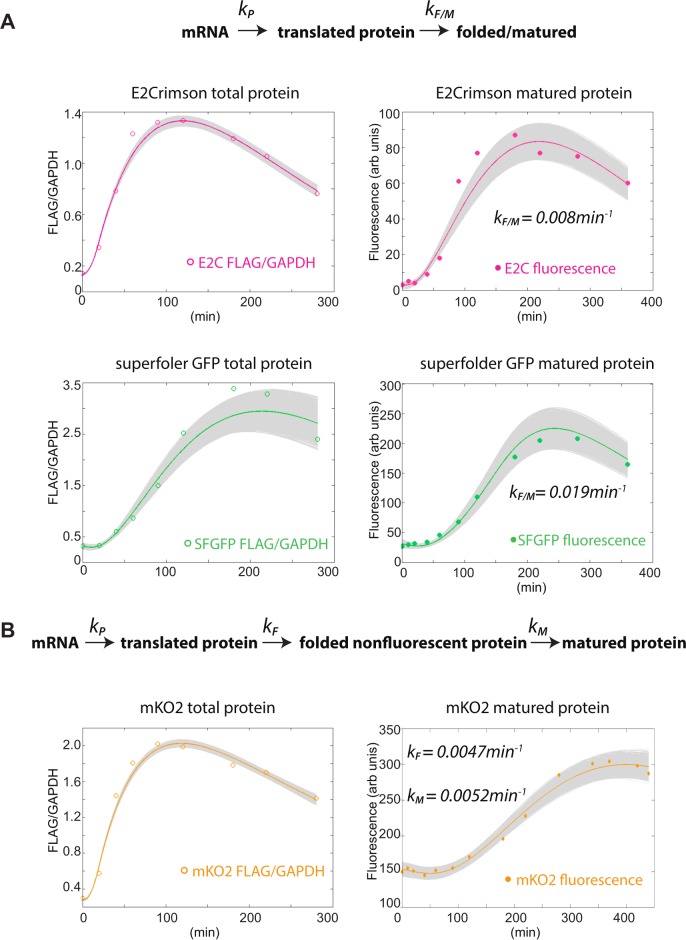
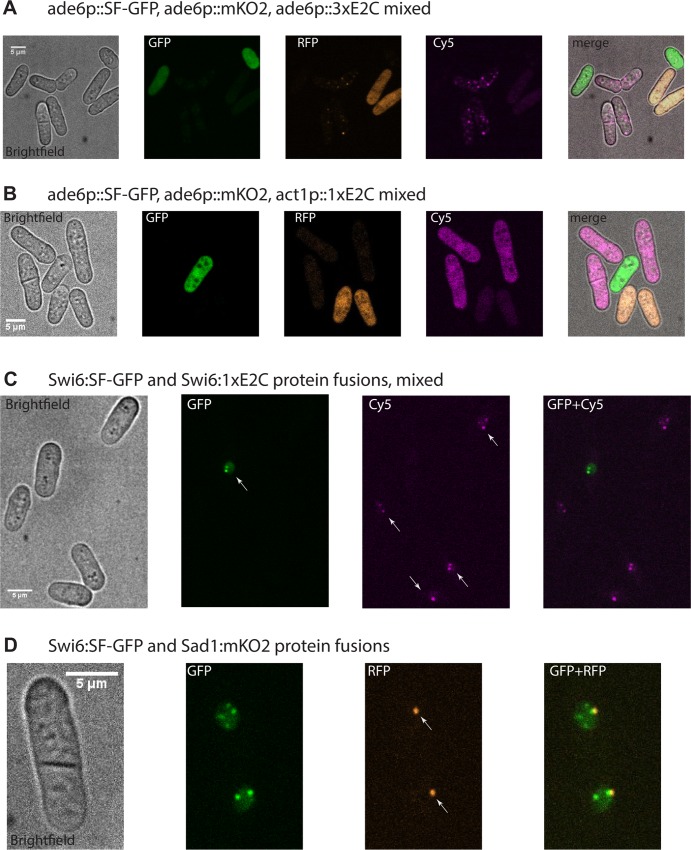
Schizosaccharomyces pombe is an outstanding model organism for cell biological investigations, yet the range of useful and well-characterized fluorescent proteins (XFPs) is limited. We generated and characterized three recoded fluorescent proteins for 3-color analysis in S.pombe, Super-folder GFP, monomeric Kusabira Orange 2 and E2Crimson. Upon optimization and expression in S. pombe, the three proteins enabled sensitive simultaneous 3-color detection capability. Furthermore, we describe a strategy that combines a pulse-chase approach and mathematical modeling to quantify the maturation kinetics of these proteins in vivo. We observed maturation kinetics in S. pombe that are expected from those described for these proteins in vitro and/or in other cell types, but also unpredicted behaviors. Our studies provide a kinetically-characterized, integrated three-color XFP toolbox for S. pombe.


Conflict of interest statement

Competing Interests: The authors have declared that no competing interests exist.

Figures

Fig 1
Fig 1. C-terminal tagging vectors for Schizosaccharomyces pombe optimized XFPs.
SF-GFP, mKO2 and E2C open reading frames were optimized for expression in S.pombe. The ORFs are preceded by a Gly rich linker (S.pombe codon frequency of linker amino acids below) and a PacI restriction site. The XFP is followed by the ura4 terminator and a hyg, nat or G418 MX resistance cassette, followed by a PmeI restriction site. For easy of cloning, a common forward (F) and reverse (R) can be used to amplify any of the 9 XFP:ura4t:MX constructs.
Fig 2
Fig 2. Detection of ade6 promoter-driven SF-GFPs.p., mKO2s.p. and 3XE2Cs.p. by flow cytometry.
A. Constructs driving on of the three XFPs from the weak ade6 promoter, terminated by the ura4 terminator and marked by a hyg resistance cassette were inserted on chromosome II between SPBC1711.11 and SPBC1711.12. A trimerized version of E2C was used. B. The three strains were examined using a 488nm to excite SF-GFPs.p. and 561nm laser to excite mKO2s.p. and 3XE2Cs.p. The effect of coding message optimization is shown for mKO2, where the non-optimized version (mKO2) is only 25% as bright as the optimized version (mKO2s.p.). A 2.7- fold increase in signal by trimerizing E2C (3XE2Cs.p.) versus the monomeric version ((1XE2Cs.p.). C. Excitation with 488nm for SF-GFPs.p. and 532nm for mKO2s.p. and 3XE2Cs.p.. 532 excitation results in a ~10 fold increase of mKOs.p. signal versus excitation at 561nm. D. Excitation with 488nm for SF-GFPs.p., 561nm for mKO2s.p. and 640nm for 3XE2Cs.p.. The analysis was performed using two flow cytometers, the emission filter sets are denoted below the histograms.
Fig 3
Fig 3
Determination of maturation kinetics in vivo of SF-GFPs.p., mKO2s.p. and E2Cs.p. A. Overview of approach. XFPs were placed downstream of the urg1 promoter and tagged with a 5XFLAG tag. Transcription was induced by uracil for 20min. Anti-FLAG westerns can detect all stages following translation including folding and maturation (light orange box), while follow cytometry measurements only detect the fully matured protein. B. The dynamics of XFP:5xFLAG transcripts following the removal of uracil. E2Cs.p. / actin, SF-GFPs.p. / actin and mKO2s.p. / actin mRNA rations are plotted as function of time and the peak set to 1 for each of the fluors. Uracil was administered from 0-20min. E2Cs.p. transcript peaks at 20min, mKO2s.p. peaks at 40min, while SF-GFPs.p. peaks at 120min. C.-E. Time courses of total protein and fluorescence. The GAPDH normalized FLAG western blot signal (ng protein) is plotted on the right axis, total fluorescence as measured by flow cytometry on the left axis.
Fig 4
Fig 4. Mathematical fitting of total protein (FLAG/GAPDH) and mature protein (fluorescence) data.
A. E2C and SF-GFP fits assume a two protein state model (translated and folded/matured). The SF-GFP protein fit assumed an equilibrium between a closed (non-uracil responsive) and open (uracil responsive) chromatin state at the urg1 locus. B. mKO2 fits assume a three protein state model (translated, folded and matured). The solid lines represents the mean of all possible fits to the model, the gray lines represent all the fits with parameter combinations yielding less than 5% mean fitting error.
Fig 5
Fig 5. Performance of SF-GFPs.p., mKO2s.p. and E2Cs.p. for low abundance protein detection by microscopy.
A. Untagged ade6 promoter driven XFPs. SF-GFPs.p., mKO2s.p. and 3XE2Cs.p. cells were mixed at 1:1:1 and imaged in brightfield and GFP, RFP and Cy5 channels. The merged imaged is shown on the right. Images were taken at 60x magnification. B. Untagged ade6p:SF-GFPs.p., ade6p:mKO2s.p. act1p:1xE2Cs.p. promoter driven XFPs. SF-GFPs.p., mKO2s.p. and 1XE2Cs.p. cells were mixed at 1:1:1 and imaged cells were visualized in brightfield, the GFP, RFP and Cy5 channels. The merged imaged is shown on the right. Images were taken at 60x magnification. C. Swi6 visualized by SF-GFPs.p. or 1XE2Cs.p. Cells containing either Swi6 C-terminally tagged by SF-GFPs.p. or 1XE2Cs.p. were mixed 1:1 and imaged in brightfield and GFP and Cy5 channels. Arrowheads point to cell nuclei. Images were taken at 60x magnification. D. Co-localization of Swi6:SF-GFPs.p. and Sad1:mKO2 s.p. in the same cell. Cells were visualized in brightfield, the GFP and RFP channels. Arrowheads point to Sad1:mKO2 s.p.-marked spindle pole bodies. Image were taken at 100x magnification.

References

    1. Shaner NC, Steinbach PA, Tsien RY. A guide to choosing fluorescent proteins. Nature methods. 2005;2(12):905–9. 10.1038/nmeth819 - DOI - PubMed
    1. Lee S, Lim WA, Thorn KS. Improved blue, green, and red fluorescent protein tagging vectors for S. cerevisiae. PloS one. 2013;8(7):e67902 10.1371/journal.pone.0067902 - DOI - PMC - PubMed
    1. Snaith HA, Anders A, Samejima I, Sawin KE. New and old reagents for fluorescent protein tagging of microtubules in fission yeast; experimental and critical evaluation. Methods Cell Biol. 2010;97:147–72. 10.1016/S0091-679X(10)97009-X . - DOI - PubMed
    1. Snaith HA, Samejima I, Sawin KE. Multistep and multimode cortical anchoring of tea1p at cell tips in fission yeast. The EMBO journal. 2005;24(21):3690–9. 10.1038/sj.emboj.7600838 - DOI - PMC - PubMed
    1. Bjerling P, Olsson I, Meng X. Quantitative live cell fluorescence-microscopy analysis of fission yeast. J Vis Exp. 2012;(59). 10.3791/3454 - DOI - PMC - PubMed

MeSH terms

Substances