. 2016 Nov;64(11):1925-37.
doi: 10.1002/glia.23033. Epub 2016 Aug 1.

TGFβ regulates persistent neuroinflammation by controlling Th1 polarization and ROS production via monocyte-derived dendritic cells

Affiliations

TGFβ regulates persistent neuroinflammation by controlling Th1 polarization and ROS production via monocyte-derived dendritic cells

Roham Parsa et al. Glia. 2016 Nov.

Abstract

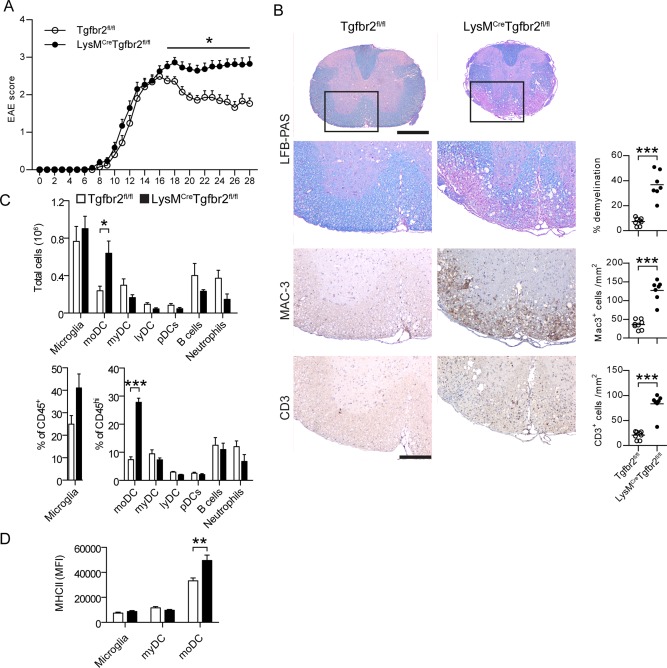
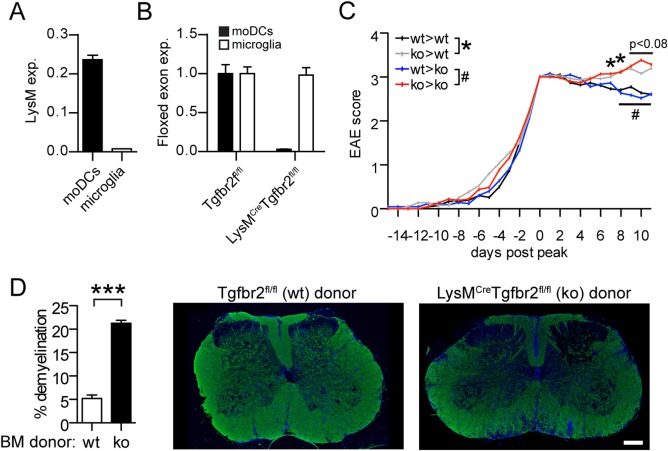
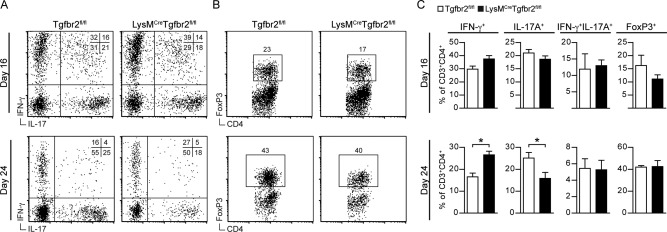
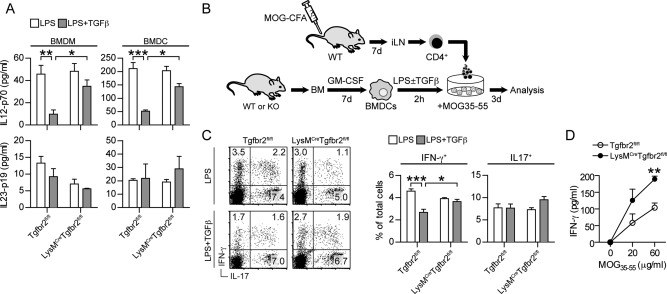
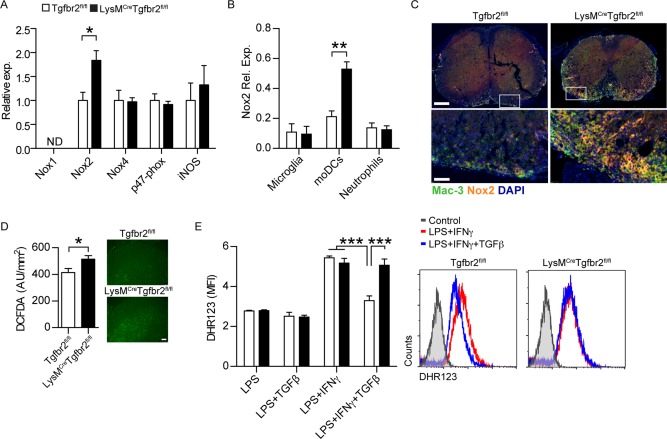
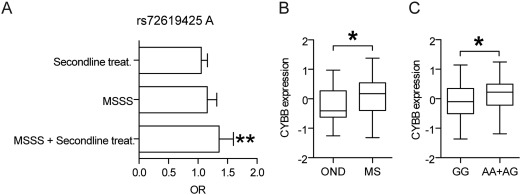
Intracerebral levels of Transforming Growth Factor beta (TGFβ) rise rapidly during the onset of experimental autoimmune encephalomyelitis (EAE), a mouse model of Multiple Sclerosis (MS). We addressed the role of TGFβ responsiveness in EAE by targeting the TGFβ receptor in myeloid cells, determining that Tgfbr2 was specifically targeted in monocyte-derived dendritic cells (moDCs) but not in CNS resident microglia by using bone-marrow chimeric mice. TGFβ responsiveness in moDCs was necessary for the remission phase since LysM(Cre) Tgfbr2(fl/fl) mice developed a chronic form of EAE characterized by severe demyelination and extensive infiltration of activated moDCs in the CNS. Tgfbr2 deficiency resulted in increased moDC IL-12 secretion that skewed T cells to produce IFN-γ, which in turn enhanced the production of moDC-derived reactive oxygen species that promote oxidative damage and demyelination. We identified SNPs in the human NOX2 (CYBB) gene that associated with the severity of MS, and significantly increased CYBB expression was recorded in PBMCs from both MS patients and from MS severity risk allele rs72619425-A carrying individuals. We thus identify a novel myeloid cell-T cell activation loop active in the CNS during chronic disease that could be therapeutically targeted. GLIA 2016;64:1925-1937.

Keywords: MOG-EAE; TGFβ; gene deletion; monocyte-derived dendritic cells; reactive oxygen species.


Figures

Figure 1
Figure 1
Loss of TGFβ‐signaling in myeloid cells results in chronic EAE without remission. EAE was induced by immunization with MOG emulsified in CFA. Clinical score was assessed on a daily basis (A). Data are pooled from three experiments. n = 25 (Tgfbr2fl/fl), 38 (LysMCreTgfbr2fl/fl). B: Spinal cords taken at day 28 post‐immunization stained with LFB‐PAS, anti‐Mac‐3, and anti‐CD3. n = 7‐8/group. C: Analysis of CNS cell subsets by flow cytometry at day 28 postimmunization n = 3–5/group. moDC monocyte‐derived DC, myDC conventional myeloid DC, lyDC lymphoid DC pDC plasmacytoid DC. D: Surface MHC II expression n = 9/group. Data in A, C, and D are presented as means ± SEM. * P < 0.05 *** P < 0.001 (A, Mann‐Whitney test; B–D, Student's unpaired t‐test). Scale bar = 500 μm (spinal cords) and 200 μm (magnifications). [Color figure can be viewed in the online issue, which is available at wileyonlinelibrary.com.]
Figure 2
Figure 2
Tgfbr2 deficiency in moDCs and not in microglia causes severe chronic EAE. moDCs (CD45hi CD11b+ F4/80+ CD11c+) and microglia (CD45intCD11b+) were sorted from the CNS of EAE animals and quantitative RT‐PCR analysis performed of mRNA encoding (A) LysM (relative to 18S RNA) and (B) of the floxed exon 3/4 boundary of Tgfbr2 in relation to the unfloxed exon 6/7 boundary to assess recombination efficiency. Data in A and B are presented as means ± SEM. n = 3 mice/group. C: EAE scores from Tgfbr2fl/fl (wt) and LysMCreTgfbr2fl/fl (ko) chimeras. Data are pooled from three separate experiments and analyzed from peak of disease (first time score ≥ 3) and presented as means. n = 18–21/group. D: Demyelination in chimeras determined by fluorescent anti‐PLP staining. n = 5/group. Scale bar 250 µm. * and # P < 0.05 *** P < 0.001 (C, Mann‐Whitney test; D, Student's unpaired t‐test). [Color figure can be viewed in the online issue, which is available at wileyonlinelibrary.com.]
Figure 3
Figure 3
Severe chronic EAE is characterized by IFN‐γ‐producing T cells in the CNS. CNS mononuclear cells were isolated at peak of EAE (day 16) or during the chronic stage (day 24) and stained for surface CD3, CD4, and intracellular IFN‐γ, IL‐17A, and FoxP3. Representative dot plots of CNS cells gated on CD3±CD4± (A, B) and corresponding frequencies of IFN‐γ+, IL‐17±, IFN‐γ+IL‐17±, and FoxP3± T‐cells at day 16 and day 24 (C). Data are presented as means ± SEM. n = 4‐5 mice/group. Data are representative of two (day 16) or three (day 24) independent experiments. * P < 0.05 (Student's unpaired t‐test).
Figure 4
Figure 4
Loss of Tgfbr2 in dendritic cells polarizes T cells to produce IFN‐γ. Levels of IL‐12p70 and IL‐23p19 in culture supernatants from (A) BMDMs and BMDCs stimulated for 24 h with the indicated cytokines. B: Experimental setup of BMDC and T cell coculture. C: Intracellular cytokine staining of CD4+ T cells from day 7 MOG‐CFA immunized mice after coculture with BMDCs and 20 µg MOG35‐55. BMDCs were pre‐stimulated for 2 h with the indicated cytokines. D: Soluble IFN‐γ in culture supernatants from LPS + TGFβ condition. Data are presented as means ± SEM. n = 3 mice/group. * P < 0.05 ** P < 0.01 *** P < 0.001 (A,C, one way ANOVA with Bonferroni post test; D, Student's unpaired t‐test).
Figure 5
Figure 5
IFN‐γ regulates ROS‐production in moDCs during EAE. qRT‐PCR analysis of mRNA encoding Nox1, Nox2, Nox4, p47‐phox, and iNOS in (A) spinal cord homogenate or Nox2 in (B) sorted microglia (CD45int CD11b+), moDCs (CD45hi CD11b+ F4/80+ CD11c+), and neutrophils (CD45hi CD11b+ Ly6G+) from chronic stage EAE animals. n = 3 experiments with 8–12 pooled animals/group and experiment. Expression is shown relative to 18S RNA. C: Immunofluorescent staining of chronic stage EAE spinal cords for Nox2 and Mac3. Scale bar 50 and 250 µm. D: ROS‐levels in chronic stage EAE spinal cord sections as determined by DCFDA staining. n = 5 mice/group. Scale bar 100 µm. E: ROS production as measured by DHR123‐incorporation in BMDMs stimulated 24 h with the indicated cytokines. n = 3 mice/group. Data are presented as means ± SEM. *P < 0.05 *** P < 0.001 (A–D: Student's unpaired t‐test, E: one‐way ANOVA with Bonferroni post‐test). [Color figure can be viewed in the online issue, which is available at wileyonlinelibrary.com.]
Figure 6
Figure 6
Effect of CYBB alleles on MS. A: Odds ratio for rs72619425 A for different measures of severity of MS. Second‐line treatment patients (Natalizumab, Rituximab, or Fingolimod n = 2189) were compared with standard treatments (n = 5500, ns). Patients with high MSSS value (highest quartile n = 1497, MSSS > 6.464) had a tendency for higher frequency of the A allele compared with those with low MSSS (lowest quartile n = 1711, MSSS < 1.282, P = 0.06). Patients who received second‐line treatment and had high MSSS (above median 4.022 n = 739) had a higher frequency of the A allele than patients receiving standard treatment and low MSSS (lowest quartile MSSS < 1.282; n = 1160; P = 0.003). B: Comparison of expression levels of CYBB in PBMC from MS patients (n = 120) compared with patients with other neurological disease (OND, n = 36). Expression was measured with RNAseq and quantified as residual values after correction for batch effects using a linear model fit. * P < 0.05 (Student's unpaired t‐test). C: Expression of CYBB in PBMC is increased among carriers of the rs72619425 A alleles. Expression was analyzed in patients with MS (n = 87), CIS (n = 19), and OND (n = 31) according to genotype; AA + AG (n = 41) and GG (n = 96). Expression was measured with RNA‐seq and quantified as residual values after correction for batch effect (RNA‐seq library preparation) and disease status (MS or OND) using a linear model fit. * P < 0.05 (Student's unpaired t‐test).

References

    1. Ajami B, Bennett JL, Krieger C, McNagny KM, Rossi FMV. 2011. Infiltrating monocytes trigger EAE progression, but do not contribute to the resident microglia pool. Nat Neurosci 14:1142–1149. - PubMed
    1. Becher B. 2001. The clinical course of experimental autoimmune encephalomyelitis and inflammation is controlled by the expression of CD40 within the central nervous system. J Exp Med 193:967–974. - PMC - PubMed
    1. Biollaz G, Bernasconi L, Cretton C, Püntener U, Frei K, Fontana A, Suter T. 2009. Site‐specific anti‐tumor immunity: Differences in DC function, TGF‐β production and numbers of intratumoral Foxp3+ Treg. Eur J Immunol 39:1323–1333. - PubMed
    1. Codarri L, Greter M, Becher B. 2013. Communication between pathogenic T cells and myeloid cells in neuroinflammatory disease. Trends Immunol 34:114–119. - PubMed
    1. Codarri L, Gyülvészi G, Tosevski V, Hesske L, Fontana A, Magnenat L, Suter T, Becher B. 2011. RORγt drives production of the cytokine GM‐CSF in helper T cells, which is essential for the effector phase of autoimmune neuroinflammation. Nat Immunol 12:560–567. - PubMed

Publication types

MeSH terms