. 2016 Aug 1:3:160061.
doi: 10.1038/sdata.2016.61.

A data set from flash X-ray imaging of carboxysomes

Affiliations

A data set from flash X-ray imaging of carboxysomes

Max F Hantke et al. Sci Data. .

Abstract

Ultra-intense femtosecond X-ray pulses from X-ray lasers permit structural studies on single particles and biomolecules without crystals. We present a large data set on inherently heterogeneous, polyhedral carboxysome particles. Carboxysomes are cell organelles that vary in size and facilitate up to 40% of Earth's carbon fixation by cyanobacteria and certain proteobacteria. Variation in size hinders crystallization. Carboxysomes appear icosahedral in the electron microscope. A protein shell encapsulates a large number of Rubisco molecules in paracrystalline arrays inside the organelle. We used carboxysomes with a mean diameter of 115±26 nm from Halothiobacillus neapolitanus. A new aerosol sample-injector allowed us to record 70,000 low-noise diffraction patterns in 12 min. Every diffraction pattern is a unique structure measurement and high-throughput imaging allows sampling the space of structural variability. The different structures can be separated and phased directly from the diffraction data and open a way for accurate, high-throughput studies on structures and structural heterogeneity in biology and elsewhere.


Conflict of interest statement

The authors declare no competing financial interests.

Figures
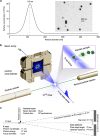
Figure 1
Figure 1. The experimental set up to image aerosolised carboxysomes.
Figure adapted from ref. 5. (a) Size distribution of purified carboxysome particles in solution prior to aerosolisation. The particle size was measured by nanoparticle tracking analysis (NTA). The single peak with 115±26 nm diameter, showing a broad Gaussian size distribution. The insert shows an electron micrograph of isolated carboxysomes. (b) An aerosol particle injector delivers a focused stream of carboxysomes into the beam of the X-ray laser. Particles are hit in unknown orientations by the X-ray pulses. Diffraction patterns are recorded with a pnCCD X-ray area detector downstream of the interaction region. The intense primary beam passes through a gap between the two detector halves and is absorbed in a beam dump at a distance behind the detectors. (c) Experimental parameters and geometry.
Figure 2
Figure 2. Determination of the threshold for hit finding.
Diffraction patterns were sorted according to their number of ‘lit’ pixels in increasing order. Blue data points indicate the manually determined hit ratio for a sequence of 100 consecutive patterns in the sorted array. An error function (green line) approximates the data points. We define the hit threshold (black vertical line) at its inflection point. This corresponds to 400 ‘lit’ pixels and an overall hit ratio of 79%.
Figure 3
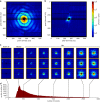
Figure 3. Diffraction images.
(a) Single-particle diffraction pattern (persistent photon background subtracted). (b) Detector read out when no particle was in the beam (no subtraction of the persistent photon background applied). Black regions in the diffraction images indicate missing data. (c) Sets of diffraction patterns with similar numbers of lit pixels. (d) Histogram of the signal strength from all recorded diffraction patterns.
Figure 4
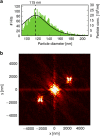
Figure 4. Pattern classification.
Figure adapted from ref. 5. (a) Size distribution as measured in solution by nano particle tracking analysis (solid black line) and the reconstructed size distribution from the diffraction patterns (green histogram). (b) The autocorrelation function with two cross terms indicate the presence of two particles in the field of view.
Figure 5
Figure 5. Missing mode analysis.
(a) Top: Singular values s for the first 39 modes that are least constrained by the support constraint and the measured amplitudes. Bottom: For the same modes we plot the theoretical amplification factor 1/(1-s) of the noise level that corresponds to the effect from missing data. (b) Real space and Fourier space image of a sphere model. (c) Real and Fourier space images of the four least constrained modes. The hue corresponds to the phase and the brightness to the amplitude of each pixel. The area between the white lines outlines the missing data region.

Comment in

References

Data Citations

    1. Hantke M. F. 2014. Coherent X-ray Imaging Data Bank. http://dx.doi.org/10.11577/1169545 - DOI

References

    1. Neutze R., Wouts R., van der Spoel D., Weckert E. & Hajdu J. Potential for biomolecular imaging with femtosecond X-ray pulses. Nature 406, 752–757 (2000). - PubMed
    1. Chapman H. N. et al. Femtosecond diffractive imaging with a soft-X-ray free-electron laser. Nat. Phys 2, 839–843 (2006).
    1. Bergh M., Huldt G., Timneanu N., Maia F. R. N. C. & Hajdu J. Feasibility of imaging living cells at subnanometer resolutions by ultrafast X-ray diffraction. Q. Rev. Biophys. 41, 181–204 (2008). - PubMed
    1. Seibert M. M. et al. Single mimivirus particles intercepted and imaged with an X-ray laser. Nature 470, 78–U86 (2011). - PMC - PubMed
    1. Hantke M. F. et al. High-throughput imaging of heterogeneous cell organelles with an X-ray laser. Nat. Photonics 8, 943–949 (2014).

Publication types

LinkOut - more resources