. 2017 Jan;36(1):98-110.
doi: 10.1109/TMI.2016.2595329. Epub 2016 Jul 27.

Dynamic Electrical Source Imaging (DESI) of Seizures and Interictal Epileptic Discharges Without Ensemble Averaging

Dynamic Electrical Source Imaging (DESI) of Seizures and Interictal Epileptic Discharges Without Ensemble Averaging

Burak Erem et al. IEEE Trans Med Imaging. 2017 Jan.

Abstract

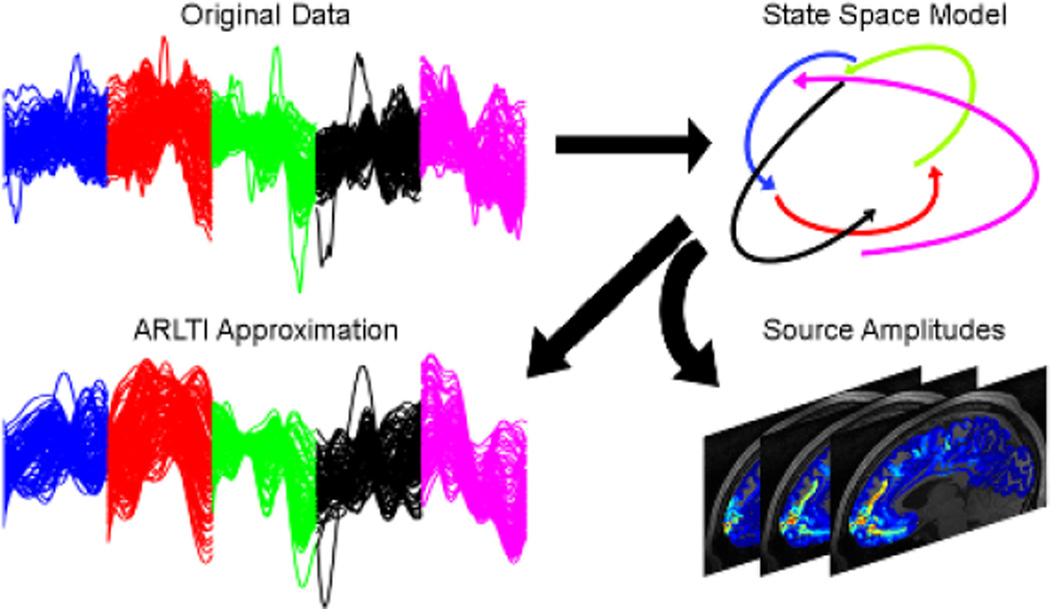
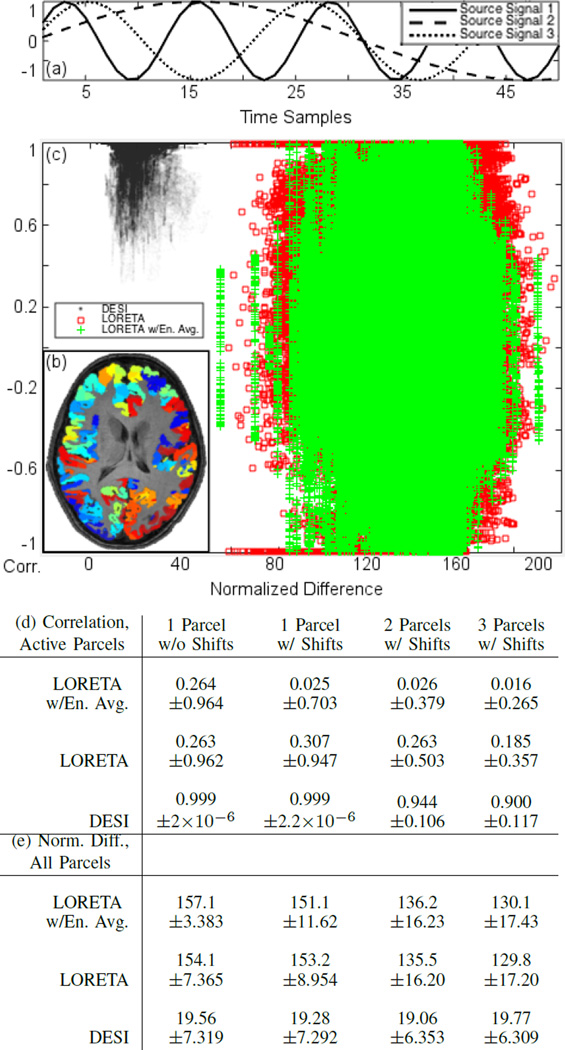
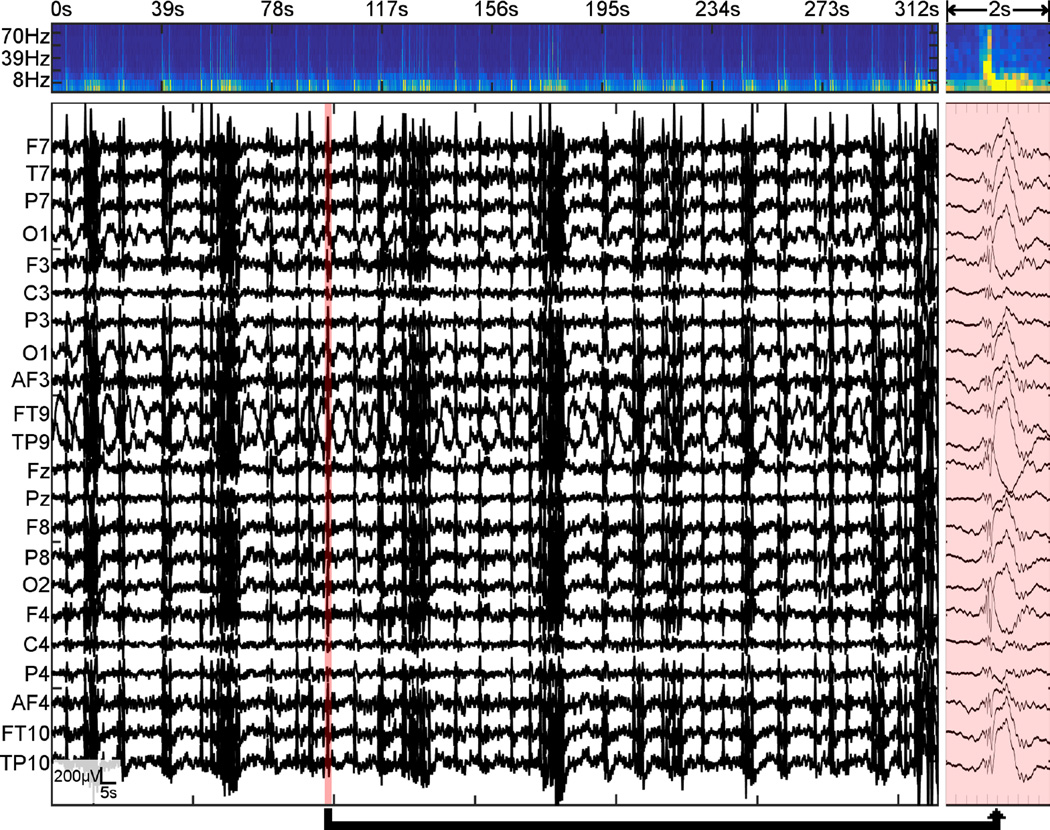
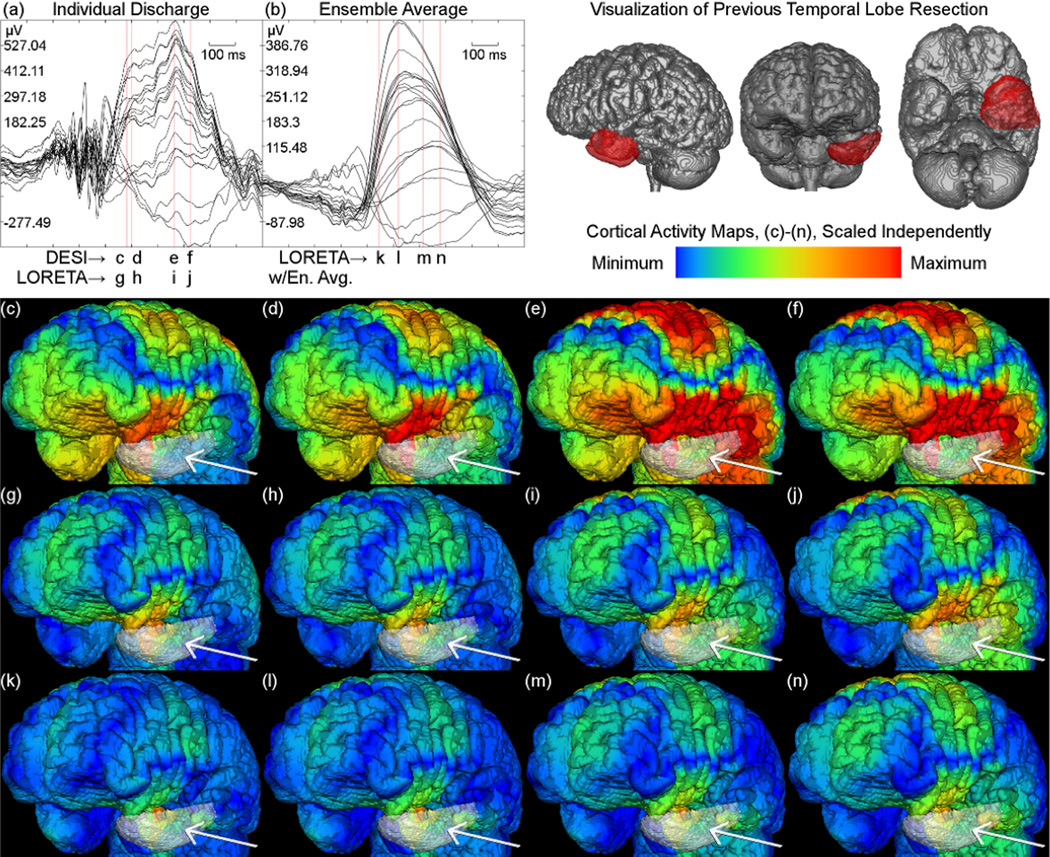
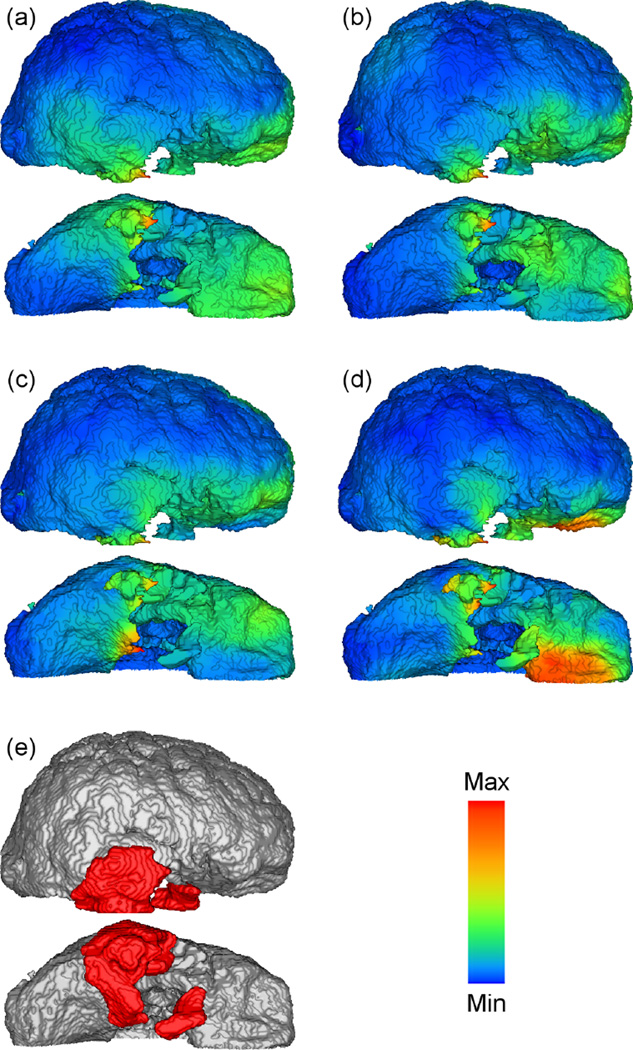
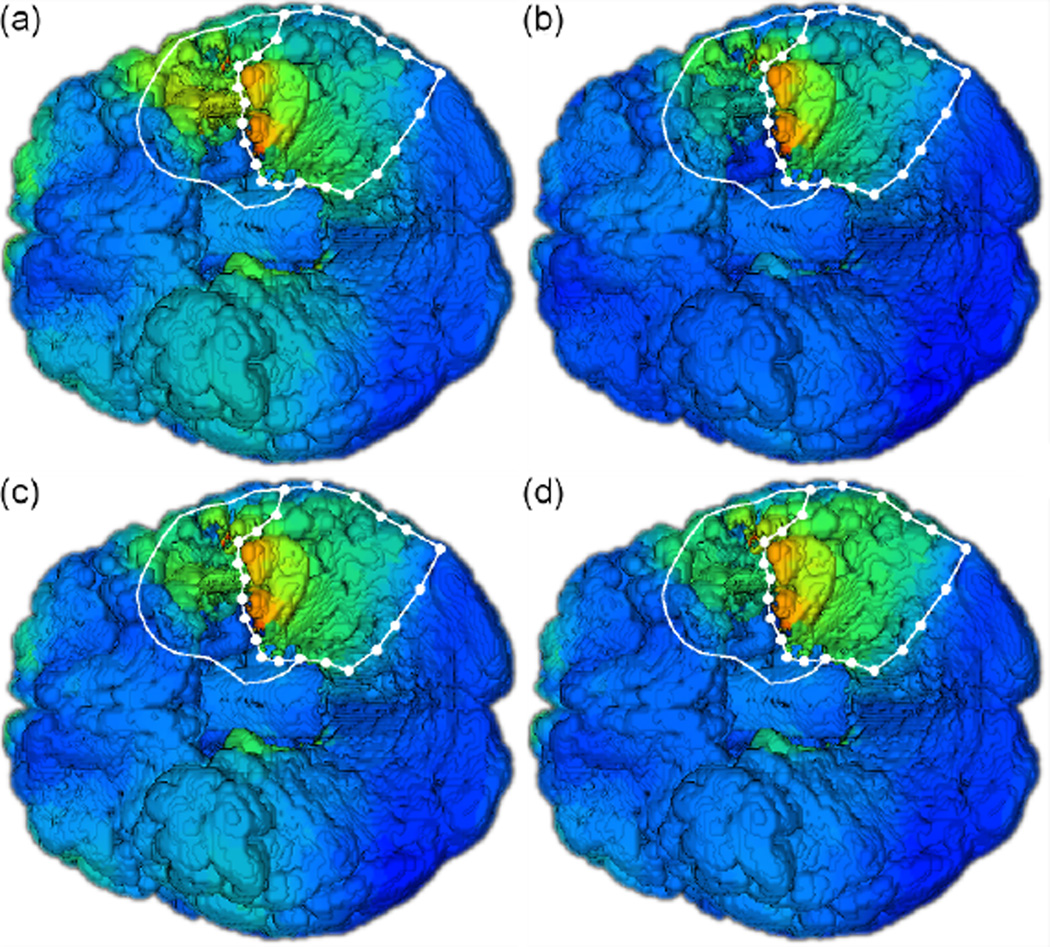
We propose an algorithm for electrical source imaging of epileptic discharges that takes a data-driven approach to regularizing the dynamics of solutions. The method is based on linear system identification on short time segments, combined with a classical inverse solution approach. Whereas ensemble averaging of segments or epochs discards inter-segment variations by averaging across them, our approach explicitly models them. Indeed, it may even be possible to avoid the need for the time-consuming process of marking epochs containing discharges altogether. We demonstrate that this approach can produce both stable and accurate inverse solutions in experiments using simulated data and real data from epilepsy patients. In an illustrative example, we show that we are able to image propagation using this approach. We show that when applied to imaging seizure data, our approach reproducibly localized frequent seizure activity to within the margins of surgeries that led to patients' seizure freedom. The same approach could be used in the planning of epilepsy surgeries, as a way to localize potentially epileptogenic tissue that should be resected.


Figures

Fig. 1
Fig. 1
Overview of DESI algorithm: The original data are divided into short time segments, such as the example epochs shown here (blue, red, green, black, and magenta), and then an ARLTI dynamical system over short time segments is estimated using a modified Ho-Kalman algorithm, which produces state space trajectories for each segment. The electrode observation model generates the ARLTI approximation to the original data. The source observation matrix is estimated using Tikhonov regularization, and then it generates source amplitudes.
Fig. 2
Fig. 2
Patient 1: A visualization of inter-epoch variations of time-aligned discharges that are discarded by ensemble averaging, compared with variations induced by approximating with the proposed algorithm in Sec. III-B. We show the signal (solid black line) from one electrode during an example epoch containing a discharge, its ARLTI approximation by the proposed modified Ho-Kalman algorithm (dashed black line), and the ensemble average of this electrode over all epochs (dotted black line). The large shaded area around the dotted line shows the standard deviation about the ensemble average. The smaller shaded area around the dashed line shows the standard deviation over trials of the proposed algorithm.
Fig. 3
Fig. 3
Patient 1: Summary plot of correlations between epochs of scalp EEG data containing interictal discharges and their approximations. Magnified views of the means (colored lines) and standard deviations (error bars) show that the correlation of the ARLTI approximation was robust to a wide range of parameter choices and random subsampling (100 trials per pair of parameter choices). These correlation values were also substantially higher than those of the ensemble average (horizontal dashed lines), which shows that a substantial amount of inter-epoch variations are discarded by ensemble averaging.
Fig. 4
Fig. 4
Patient 1: Stability of DESI over approximation variations induced by parameter variations and trials of random subsampling (100 trials per pair of parameter choices). Here we show the (a) means and (b) standard deviations of correlations of DESI solutions with a reference solution computed using parameter choices corresponding to the location of the black dot above (model order of 50, and number of delay samples of 40). High correlations and low standard deviations indicate that DESI inverse solutions are stable with respect to the induced approximation variations in the algorithm.
Fig. 5
Fig. 5
Summary of simulations with DESI, LORETA, and LORETA with ensemble averaging (En. Avg.). The source signals in (a) were applied to either 1, 2, or 3 parcels of cortex, visualized in (b), to generate epochs. Inter-epoch variations were simulated with random phase shifts for each epoch and each parcel. Source activity was estimated from simulated scalp EEG, and each estimate was compared to the ground truth in terms of correlation in the true active parcels, and the norm of the normalized difference between the entire estimate and the ground truth. Simulations for each set of test conditions (i.e., 1–3 active parcels, with or without phase shifts) were performed N = 1000 times. The scatter plot in (c) shows the combined correlation and normalized difference results for all test conditions. For each condition, we also reported (d) correlation and (e) normalized difference (table format: mean ± standard deviation). A two-tailed t-test determined DESI had a greater correlation than LORETA with ensemble averaging (p < 0.0001) and LORETA (p < 0.0001), and a lesser normalized difference than LORETA with ensemble averaging (p < 0.0001) and LORETA (p < 0.0001).
Fig. 6
Fig. 6
Patient 2: Plots of scalp EEG from electrodes positioned and labeled according to the International 10–20 system and their corresponding spectrogram. Discharges do not occur at regular intervals and they cannot be isolated to a narrow frequency band. The entire time series was supplied as input to DESI and LORETA. We also ensemble averaged 65 epochs containing generalized discharges, and computed LORETA with ensemble averaging. An example epoch is shown shaded red and magnified. Its detailed DESI and LORETA results are shown and compared to LORETA with ensemble averaging results in Fig. 7.
Fig. 7
Fig. 7
Patient 2: Comparison of DESI and LORETA solutions of the same discharge, and LORETA on the ensemble average of epochs containing discharges. In the top right corner we show three orthogonal volumetric views of brain and the region of the left temporal lobe that was resected prior to EEG recordings. Butterfly plots of (a) the example epoch and (b) the ensemble average of epochs from Fig. 6 show the effects of ensemble averaging these generalized discharges. DESI solutions in (c)–(f), LORETA solutions in (g)–(j), and LORETA with ensemble averaging solutions in (k)–(n) show how the solutions differ in their temporal evolutions. The DESI solution shows propagation of activations originating from a patch of cortex adjacent to the previously resected region of the temporal lobe. The LORETA and LORETA with ensemble averaging solutions localize to similar regions of cortex, but they change very little over time, and do not spread to the spatial extent of activation that is consistent with a generalized discharge.
Fig. 8
Fig. 8
Patient 2: Cumulative activity map computed from DESI solutions for all time points shown in the plots in Fig. 6. This map shows that the DESI solution contained frequent activity in this patch of cortex. This may be due to activations consistently propagating from this initial area, which was shown for an example discharge in Fig. 7(c)–(f).
Fig. 9
Fig. 9
Patient 3: Cumulative activity maps (a)–(d) computed from DESI solutions of four different seizures recorded prior to epilepsy surgery. The margins of the subsequent surgical resection, which resulted in seizure freedom, are visualized as a red volume in (e). The first three seizures (a)–(c) were estimated to have their most frequent activity in the right temporal lobe within the margins of what was later resected. The fourth seizure (d) was also estimated to have frequent activity in the right temporal lobe, but additionally had a broad region of frequent activity in the mesial frontal lobe.
Fig. 10
Fig. 10
Patient 4: Cumulative activity maps (a)–(d) computed from DESI solutions of four different seizures recorded prior to their most recent epilepsy surgery. The colormap is the same as the one used in Fig. 9. The margins of this surgical resection, which resulted in seizure freedom, are visualized as dotted white lines superimposed on each map. The margins of the patient’s previous unsuccessful surgery are similarly visualized but with solid white lines. All four seizures were estimated to have their most frequent activity in the remaining anterior tip of the left temporal lobe, within the margins of what was subsequently resected.

Similar articles

References

    1. Brodbeck V, Spinelli L, Lascano AM, Wissmeier M, Vargas M-I, Vulliemoz S, Pollo C, Schaller K, Michel CM, Seeck M. Electroencephalographic source imaging: a prospective study of 152 operated epileptic patients. Brain. 2011;134(10):2887–2897. - PMC - PubMed
    1. Erem B, Hyde D, Peters J, Duffy F, Brooks D, Warfield S. Combined delay and graph embedding of epileptic discharges in EEG reveals complex and recurrent nonlinear dynamics; Biomedical Imaging (ISBI), 2015 IEEE 12th International Symposium on; April 2015; pp. 347–350. - PMC - PubMed
    1. Rubin J, Wechselberger M. The selection of mixed-mode oscillations in a Hodgkin-Huxley model with multiple timescales. Chaos: An Interdisciplinary Journal of Nonlinear Science. 2008;18(1):015105. - PubMed
    1. Erem B, Orellana RM, Hyde DE, Peters JM, Duffy FH, Stovicek P, Warfield SK, MacLeod RS, Tadmor G, Brooks DH. Extensions to a manifold learning framework for time-series analysis on dynamic manifolds in bioelectric signals. Physical Review E. 2016;93(4):042218. - PMC - PubMed
    1. De Munck JC, Bijma F, Gaura P, Sieluzycki CA, Branco MI, Heethaar RM. A maximum-likelihood estimator for trial-to-trial variations in noisy meg/eeg data sets. IEEE Transactions on Biomedical Engineering. 2004;51(12):2123–2128. - PubMed