. 2016 Sep 22;128(12):1609-13.
doi: 10.1182/blood-2016-04-709519. Epub 2016 Aug 1.

Ibrutinib inhibits CD20 upregulation on CLL B cells mediated by the CXCR4/SDF-1 axis

Affiliations

Ibrutinib inhibits CD20 upregulation on CLL B cells mediated by the CXCR4/SDF-1 axis

Gabriela Pavlasova et al. Blood. .

Abstract

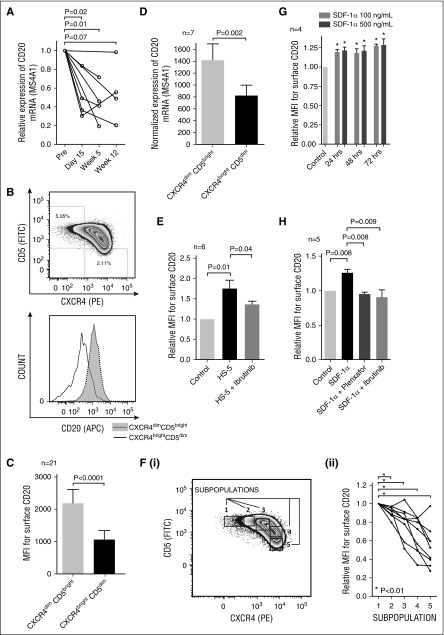
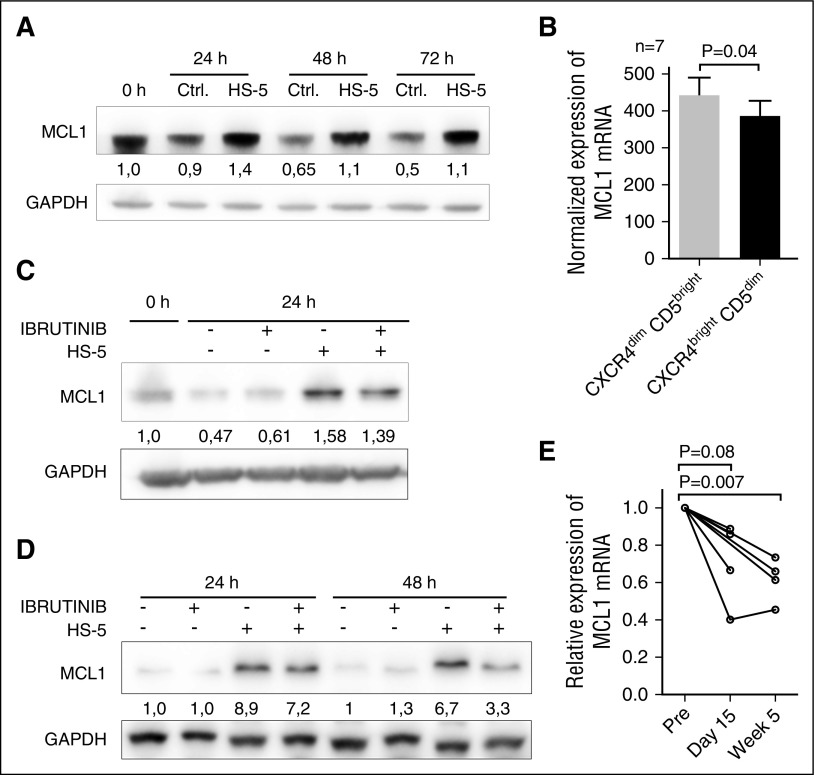
Agents targeting B-cell receptor (BCR) signaling-associated kinases such as Bruton tyrosine kinase (BTK) or phosphatidylinositol 3-kinase can induce mobilization of neoplastic B cells from the lymphoid tissues into the blood, which makes them potentially ideal to combine with anti-CD20 monoclonal antibodies (such as rituximab, obinutuzumab, or ofatumumab) for treatment of B-cell lymphomas and chronic lymphocytic leukemia (CLL). Here we show that interactions between leukemia cells and stromal cells (HS-5) upregulate CD20 on CLL cells and that administering ibrutinib downmodulates CD20 (MS4A1) expression in vivo. We observed that CLL cells that have recently exited the lymph node microenvironment and moved into the peripheral blood (CXCR4(dim)CD5(bright) subpopulation) have higher cell surface levels of CD20 than the cells circulating in the bloodstream for a longer time (CXCR4(bright)CD5(dim) cells). We found that CD20 is directly upregulated by CXCR4 ligand stromal cell-derived factor 1 (SDF-1α, CXCL12) produced by stromal cells, and BTK-inhibitor ibrutinib and CXCR4-inhibitor plerixafor block SDF-1α-mediated CD20 upregulation. Ibrutinib also downmodulated Mcl1 levels in CLL cells in vivo and in coculture with stromal cells. Overall, our study provides a first detailed mechanistic explanation of CD20 expression regulation in the context of chemokine signaling and microenvironmental interactions, which may have important implications for microenvironment-targeting therapies.


Figures

Figure 1
Figure 1
The effect of microenvironmental interactions on CD20 expression in CLL cells. (A) Relative CD20 mRNA (MS4A1) expression in samples obtained before and during ibrutinib treatment of CLL patients (N = 8 patients; for characterization of CLL samples, see supplemental Table 1, sample no. CLL102-109). Samples were acquired the day before the first administration of ibrutinib (Pre), and on day 15, and/or week 5 and/or week 12 after the first ibrutinib administration. (B) A representative example of the gating of CXCR4dimCD5bright and CXCR4brightCD5dim CLL cell populations analyzed using flow cytometry (top). The histogram of the surface CD20 expression on CLL cells gated in the top panel (bottom). (C) The mean fluorescence intensity (MFI) for the surface CD20 on CXCR4dimCD5bright and CXCR4brightCD5dim CLL cells (N = 21 pairs; for characterization of CLL samples, see supplemental Table 2). The statistical difference was tested by paired Student t test. (D) Normalized CD20 mRNA (MS4A1) expression in sorted CXCR4dimCD5bright and CXCR4brightCD5dim CLL cells (N = 7 pairs; purity >99% CD5+CD19+ cells; for characterization of CLL samples, see supplemental Table 2). The statistical difference was tested by paired Student t test. (E) Freshly obtained CLL cells (N = 6, purity >99% CD5+CD19+ cells; for characterization of CLL samples, see supplemental Table 2) were seeded (2.5 × 10⁶ cells per mL) on plastic (control) or an HS-5 monolayer. CLL cells were pretreated with vehicle (labeled HS-5) or ibrutinib (HS-5 + ibrutinib) for 2 hours prior to being seeded on the HS-5 stromal cells. The CLL cells were treated with ibrutinib (1 μM) prior to seeding on stromal cells to ensure full BTK inhibition before the contact of B cells with HS-5 cells. The control stands for CLL cells treated with vehicle and cultured on plastic with no contact with stromal cells. After 48 hours in cultivation, all cells in the wells were harvested and labeled with anti-CD20 antibody and Annexin-V, and CD20 MFI was analyzed on viable CD105-negative cells (ie, CLL cells) by flow cytometry. CD105 was used as a stromal cell marker. (F) A representative plot showing gating strategy of 5 subpopulations based on CXCR4 and CD5 expression (i). The relative surface CD20 expression in CLL subpopulations gated according to CXCR4/CD5 levels (ii; N = 9 CLL samples). The statistical difference was tested by paired Student t test. (G) Freshly obtained CLL cells (N = 4, purity >99% CD5+CD19+ cells; for characterization of CLL samples, see supplemental Table 2) were seeded on a plastic surface at a concentration of 2.5 × 10⁶ cells per mL and treated with recombinant human SDF-1α (100 or 500 ng/mL), or vehicle (control) and cultured for 24/48/72 hours. After the indicated cultivation period, the CLL cells were harvested and labeled with anti-CD20 antibody and Annexin-V, and CD20 MFI was analyzed on viable cells using flow cytometry. MFI on the control cells was set as 1. *P ≤ .05. (H) Freshly obtained primary CLL cells (N = 5, purity >99% CD5+CD19+ cells; for characterization of CLL samples, see supplemental Table 2) were seeded on plastic (2.5 × 10⁶ cells per mL) and treated with SDF-1α (labeled SDF-1α) or plerixafor and SDF-1α (SDF-1α + plerixafor) or ibrutinib and SDF-1α (SDF-1α + ibrutinib). Ibrutinib (1 μM) or plerixafor (5 μg/mL) was added to the cell culture 2 hours prior to SDF-1α treatment (500 ng/mL) to ensure full BTK/CXCR4 inhibition before the contact of B cells with the SDF-1α chemokine. The control stands for cells that were treated with vehicle and cultured on plastic with no inhibitor or SDF-1α treatment. After 48 hours in cultivation, all cells in the wells were harvested and labeled with anti-CD20 antibody and Annexin-V, and CD20 MFI was analyzed on viable cells using flow cytometry.
Figure 2
Figure 2
The effect of microenvironmental interactions and ibrutinib treatment on Mcl1 expression. (A) Representative immunoblot analysis of Mcl1 expression in CLL cells (purity >95% CD5+CD19+ cells) after culture on plastic (Ctrl.) or coculture with HS-5 cells (HS-5) for 24/48/72 hours. The purification of CLL cells after coculture with HS-5 cells was performed using magnetic anti-CD105 MicroBeads (purity >95% CD5+CD19+ cells). The blot images were quantified with UVItec Alliance 4.7 (UVItec Cambridge), and the Mcl1/glyceraldehyde-3-phosphate dehydrogenase (GAPDH) in the first sample was arbitrarily set at 1. (B) Normalized Mcl1 mRNA expression in sorted CXCR4dimCD5bright and CXCR4brightCD5dim CLL cells (N = 7 pairs, purity >99% CD5+CD19+ cells). (C) Representative immunoblot analysis of Mcl1 expression in CLL cells after culture on plastic or coculture with HS-5 (with or without ibrutinib treatment). The presence of ibrutinib target BTK in CLL was confirmed by immunoblotting (supplemental Figure 8). The CLL cells were pretreated with ibrutinib (10 μM) or vehicle for 2 hours and then washed and seeded on plastic or confluent monolayer of HS-5 cells. The pretreatment of 2 hours with ibrutinib followed by washing was performed to minimize the off-target effects caused by the continuous ibrutinib presence. After the indicated cultivation period, all cells in the wells were harvested, and B-cell purification after coculture with HS-5 cells was performed using magnetic anti-CD105 MicroBeads (purity >95% CD5+CD19+ cells). The blot images were quantified with UVItec Alliance 4.7, and the Mcl1/GAPDH in the first sample was arbitrarily set at 1. Above each panel is a “+” or a “-” in the row labeled “ibrutinib” and/or “HS-5“ to indicate the samples that were exposed to ibrutinib or cocultured with stromal cells. (D) Representative immunoblot analysis of Mcl1 in the OSU-CLL cell line after culture on plastic or coculture with HS-5 (with or without treatment with ibrutinib). The presence of ibrutinib target BTK in OSU-CLL cell line was confirmed by immunoblotting (supplemental Figure 8). The experiment was performed identically as described in panel C for CLL cells. The Mcl1/GAPDH in the control sample was arbitrarily set at 1. (E) Relative Mcl1 mRNA expression in samples obtained before (Pre) and during ibrutinib treatment of CLL patients (time of sampling indicated). The gene expression was analyzed in samples with enough RNA material available (N = 7 patients; for characterization of CLL samples, see supplemental Table 1, sample no. CLL101-103 and 106-109 [other samples did not have enough RNA available]).

References

    1. Byrd JC, Furman RR, Coutre SE, et al. Targeting BTK with ibrutinib in relapsed chronic lymphocytic leukemia. N Engl J Med. 2013;369(1):32–42. - PMC - PubMed
    1. Furman RR, Sharman JP, Coutre SE, et al. Idelalisib and rituximab in relapsed chronic lymphocytic leukemia. N Engl J Med. 2014;370(11):997–1007. - PMC - PubMed
    1. de Rooij MFM, Kuil A, Geest CR, et al. The clinically active BTK inhibitor PCI-32765 targets B-cell receptor- and chemokine-controlled adhesion and migration in chronic lymphocytic leukemia. Blood. 2012;119(11):2590–2594. - PubMed
    1. Ponader S, Chen S-S, Buggy JJ, et al. The Bruton tyrosine kinase inhibitor PCI-32765 thwarts chronic lymphocytic leukemia cell survival and tissue homing in vitro and in vivo. Blood. 2012;119(5):1182–1189. - PMC - PubMed
    1. Seda V, Mraz M. B-cell receptor signalling and its crosstalk with other pathways in normal and malignant cells. Eur J Haematol. 2015;94(3):193–205. - PubMed

MeSH terms