

Serum metabonomics of acute leukemia using nuclear magnetic resonance spectroscopy
- PMID: 27480133
- PMCID: PMC4969755
- DOI: 10.1038/srep30693
Serum metabonomics of acute leukemia using nuclear magnetic resonance spectroscopy
Abstract
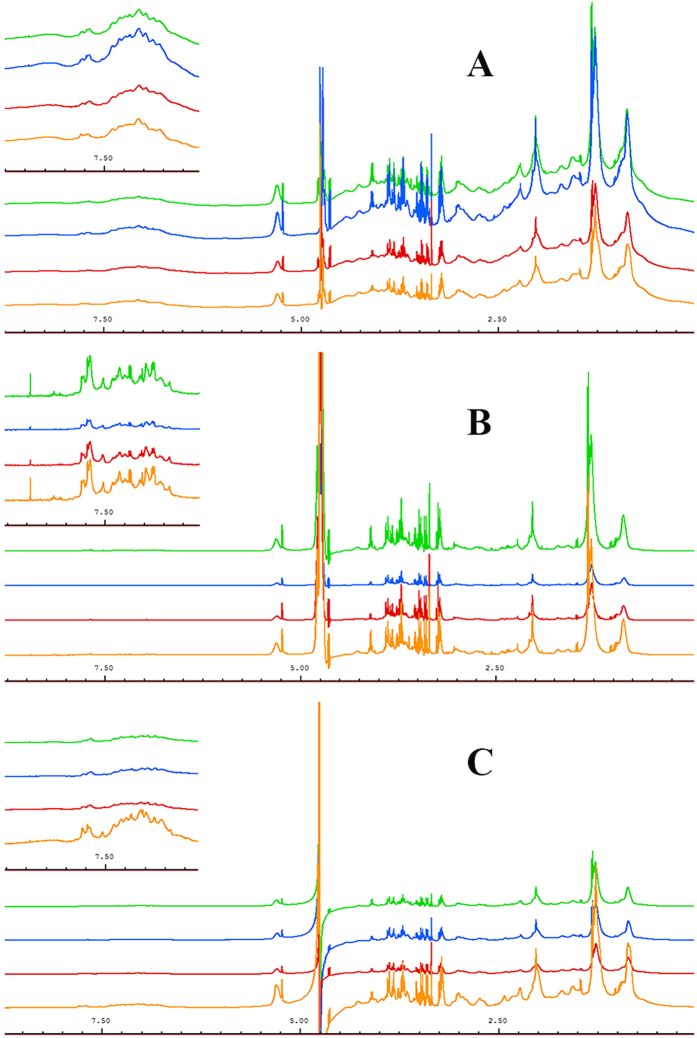
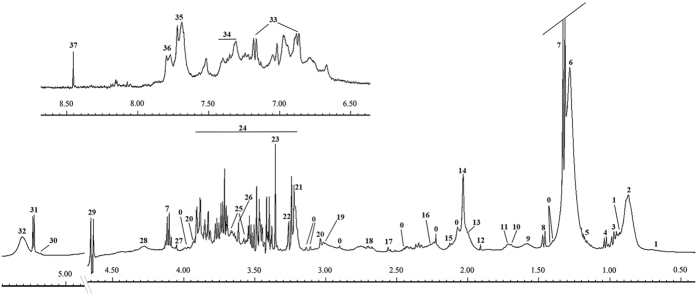
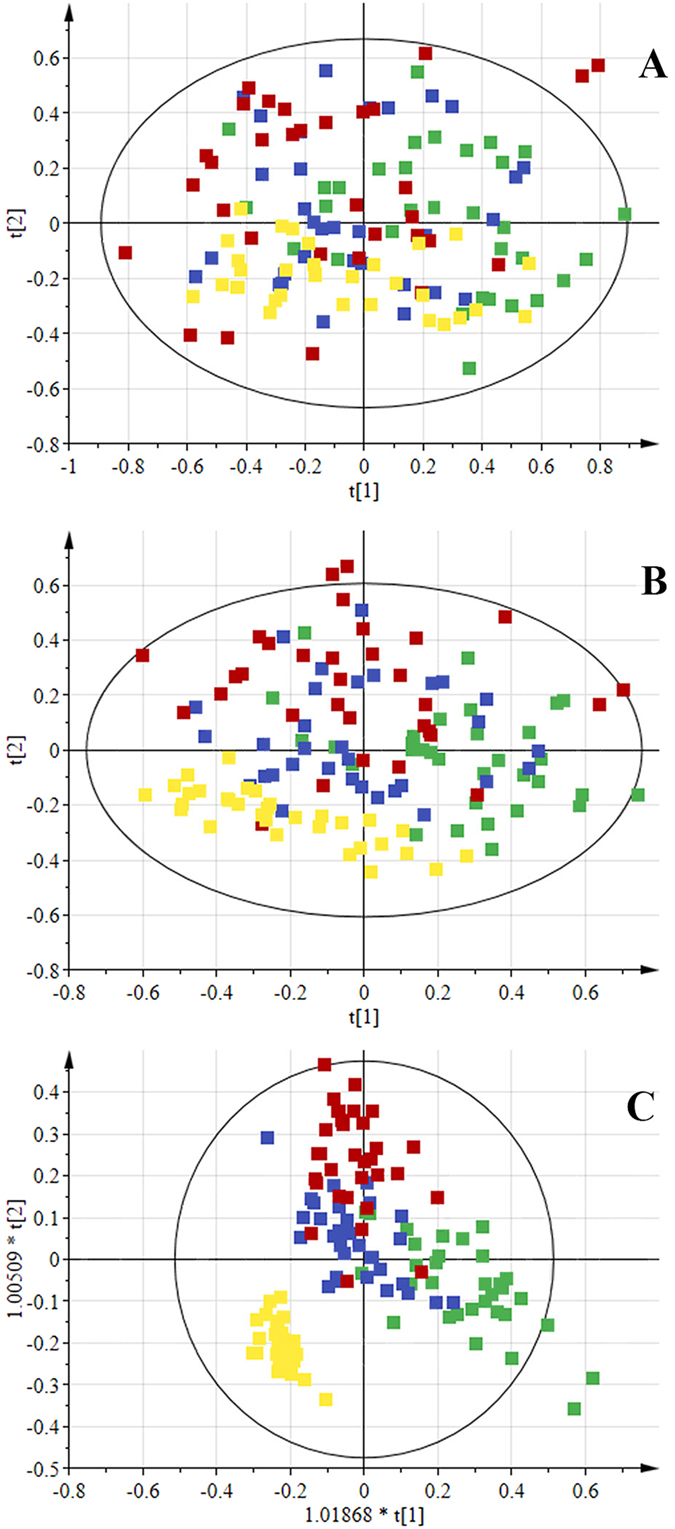
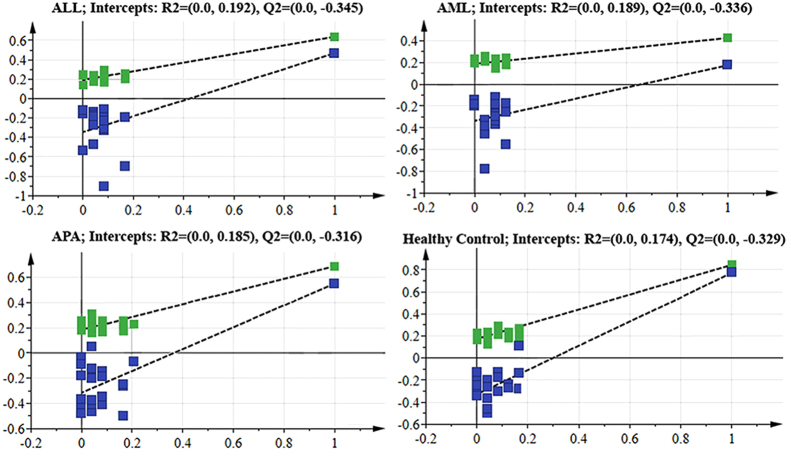
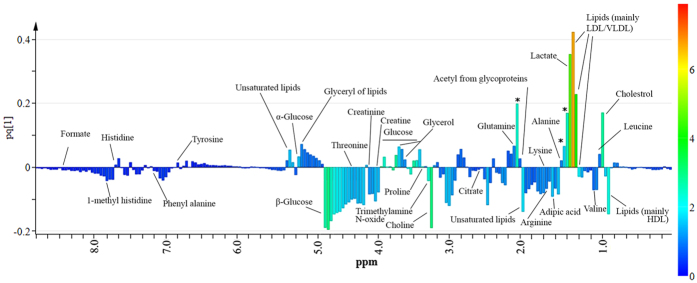
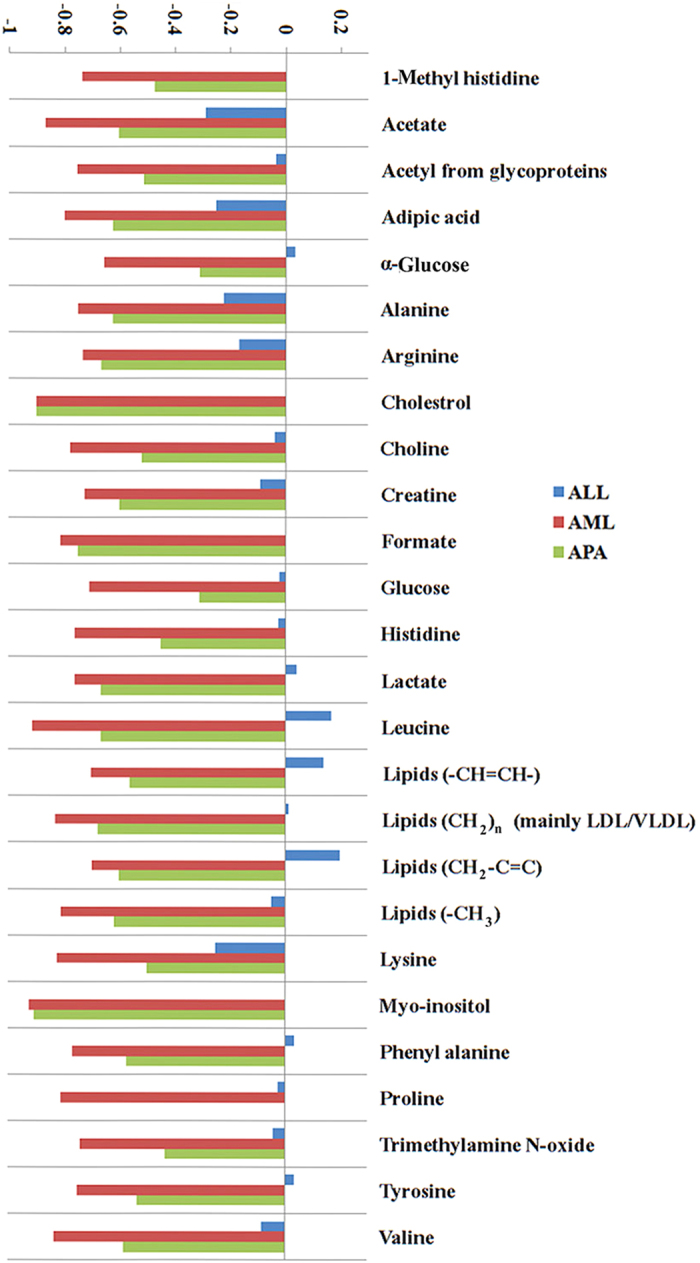
Acute leukemia is a critical neoplasm of white blood cells. In order to differentiate between the metabolic alterations associated with two subtypes of acute leukemia, acute lymphoblastic leukemia (ALL) and acute myeloid leukemia (AML), we investigated the serum of ALL and AML patients and compared with two controls (healthy and aplastic anemia) using (1)H NMR (nuclear magnetic resonance) spectroscopy. Thirty-seven putative metabolites were identified using Carr-Purcell-Meiboom-Gill (CPMG) sequence. The use of PLS-DA and OPLS-DA models gave results with 84.38% and 90.63% classification rate, respectively. The metabolites responsible for classification are mainly lipids, lactate and glucose. Compared with controls, ALL and AML patients showed serum metabonomic differences involving aberrant metabolism pathways including glycolysis, TCA cycle, lipoprotein changes, choline and fatty acid metabolisms.
Figures
References
-
- Jiang N. et al.. Identification of prognostic protein biomarkers in childhood acute lymphoblastic leukemia (ALL). Journal of Proteomics 74, 843–857 (2011). - PubMed
-
- Jemal A., Siegel R., Xu J. & Ward E. Cancer Statistics, 2010. CA: A Cancer Journal for Clinicians 60, 277–300 (2010). - PubMed
-
- Ferlay J. et al.. Globocan 2012 v1.0. Vol. 15 October 2014 (2013).
-
- Lai R., Hirsch-Ginsberg C. F. & Bueso-Ramos C. Pathologic daignosis of acute lymphocytic leukemia. Hematology/Oncology Clinics of North America 14, 1209–1235 (2000). - PubMed
-
- Catovsky D. et al.. A classification of acute leukaemia for the 1990s. Annals of hematology 62, 16–21 (1991). - PubMed
Publication types
MeSH terms
LinkOut - more resources
Full Text Sources
Other Literature Sources
Medical
