. 2016 Nov;129(11):2043-2053.
doi: 10.1007/s00122-016-2756-5. Epub 2016 Aug 1.

Model training across multiple breeding cycles significantly improves genomic prediction accuracy in rye (Secale cereale L.)

Affiliations

Model training across multiple breeding cycles significantly improves genomic prediction accuracy in rye (Secale cereale L.)

Hans-Jürgen Auinger et al. Theor Appl Genet. 2016 Nov.

Abstract

Genomic prediction accuracy can be significantly increased by model calibration across multiple breeding cycles as long as selection cycles are connected by common ancestors. In hybrid rye breeding, application of genome-based prediction is expected to increase selection gain because of long selection cycles in population improvement and development of hybrid components. Essentially two prediction scenarios arise: (1) prediction of the genetic value of lines from the same breeding cycle in which model training is performed and (2) prediction of lines from subsequent cycles. It is the latter from which a reduction in cycle length and consequently the strongest impact on selection gain is expected. We empirically investigated genome-based prediction of grain yield, plant height and thousand kernel weight within and across four selection cycles of a hybrid rye breeding program. Prediction performance was assessed using genomic and pedigree-based best linear unbiased prediction (GBLUP and PBLUP). A total of 1040 S2 lines were genotyped with 16 k SNPs and each year testcrosses of 260 S2 lines were phenotyped in seven or eight locations. The performance gap between GBLUP and PBLUP increased significantly for all traits when model calibration was performed on aggregated data from several cycles. Prediction accuracies obtained from cross-validation were in the order of 0.70 for all traits when data from all cycles (N CS = 832) were used for model training and exceeded within-cycle accuracies in all cases. As long as selection cycles are connected by a sufficient number of common ancestors and prediction accuracy has not reached a plateau when increasing sample size, aggregating data from several preceding cycles is recommended for predicting genetic values in subsequent cycles despite decreasing relatedness over time.


Conflict of interest statement

The authors declare that they have no conflict of interest. Ethical standards The authors declare that the experiments comply with the current laws of Germany.

Figures

Fig. 1
Fig. 1
Cross-validation (CV) scenarios. CV1 within-cycle CV with lines in calibration and validation from the same breeding cycle (grey boxes). Eighty percent of the lines from one cycle were used for calibration and twenty percent for validation. CV2 across-cycle CV, where the calibration set comprised lines from other cycles than the validation set. CV2 calibration sets consisted of lines from one (CV2.1), two (CV2.2) or three (CV2.3) cycles (different shades of blue) with equal numbers of S2 lines from each cycle. CV3 joint across- and within-cycle CV, where lines from all four cycles constituted the calibration set (blue and grey boxes), and lines from one of the cycles (grey) constituted the validation set. Lines from the validation set were not represented in the calibration set (color figure online)
Fig. 2
Fig. 2
Within-cycle (CV1) prediction accuracies of four breeding cycles for a grain dry matter yield (GDY), b plant height (PHT) and c thousand kernel weight (TKW) obtained with PBLUP (left) and GBLUP (right). Boxplots show the median (horizontal line), mean (×), upper and lower quartile, and whiskers (vertical bars) of 10 × 5 fold cross-validation with random sampling and a constant calibration (N = 208) and validation set (N = 52) size. Points above and below the whiskers indicate values ±1.5 times the interquartile range
Fig. 3
Fig. 3
Within-(CV1, diagonal elements) and across-(CV2.1 off-diagonal elements) cycle prediction accuracies for a grain dry matter yield (GDY), b plant height (PHT) and c thousand kernel weight (TKW) from GBLUP performing 10 × 5 fold cross-validation with constant calibration (N = 208) and validation set (N = 52) sizes. Upper (lower) triangular matrices constitute the forward (backward) across-cycle prediction direction
Fig. 4
Fig. 4
Across-cycle (CV2.1) prediction accuracies for grain dry matter yield (GDY) from GBLUP plotted against the average maximum kinship U¯max (r, p < 0.01). Shaded triangles indicate cycles in calibration/validation set and forward/backward (formula image
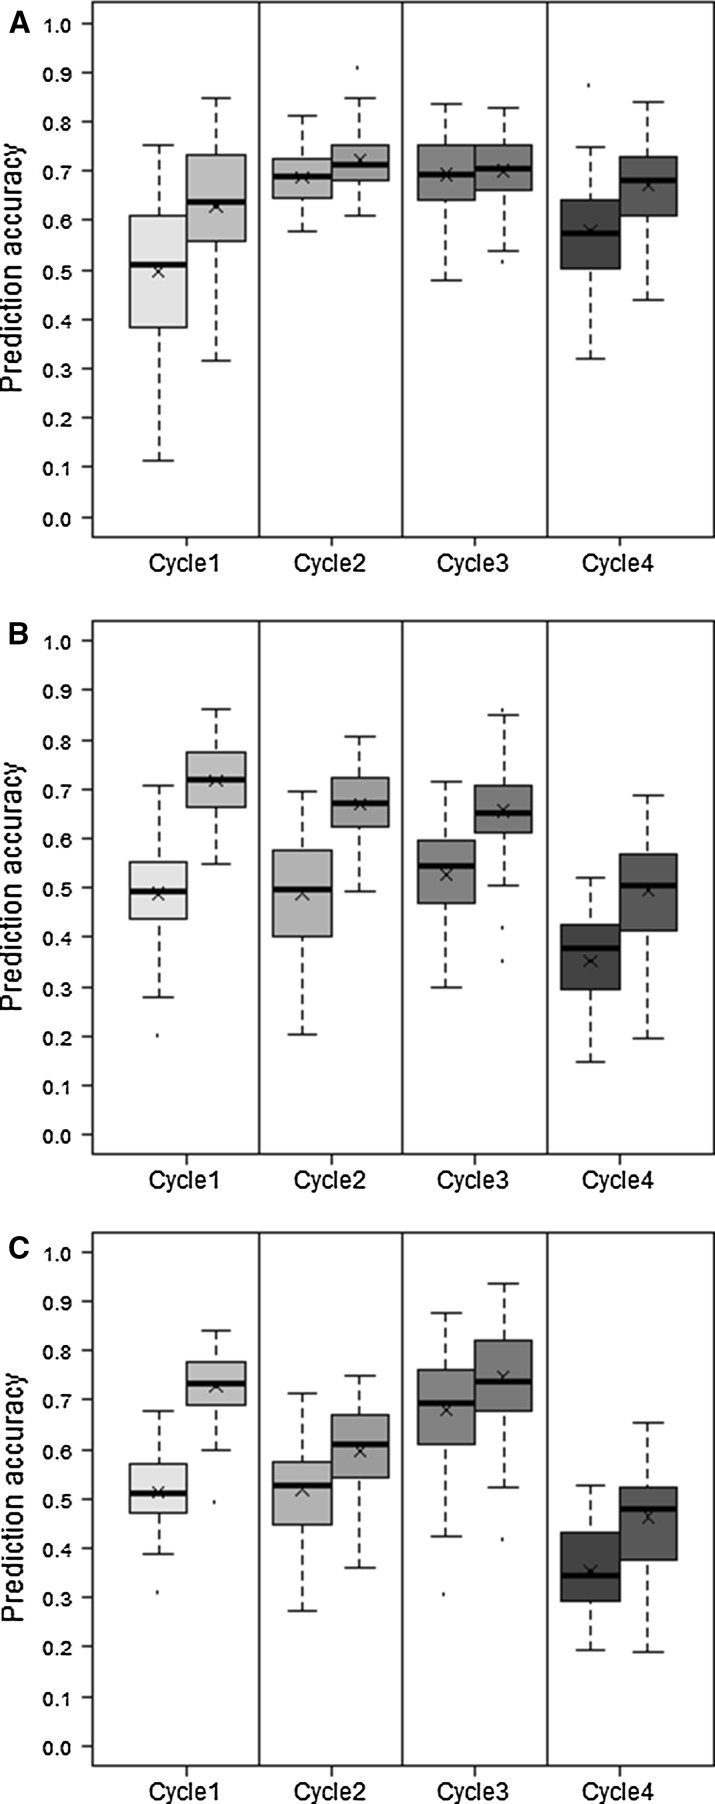
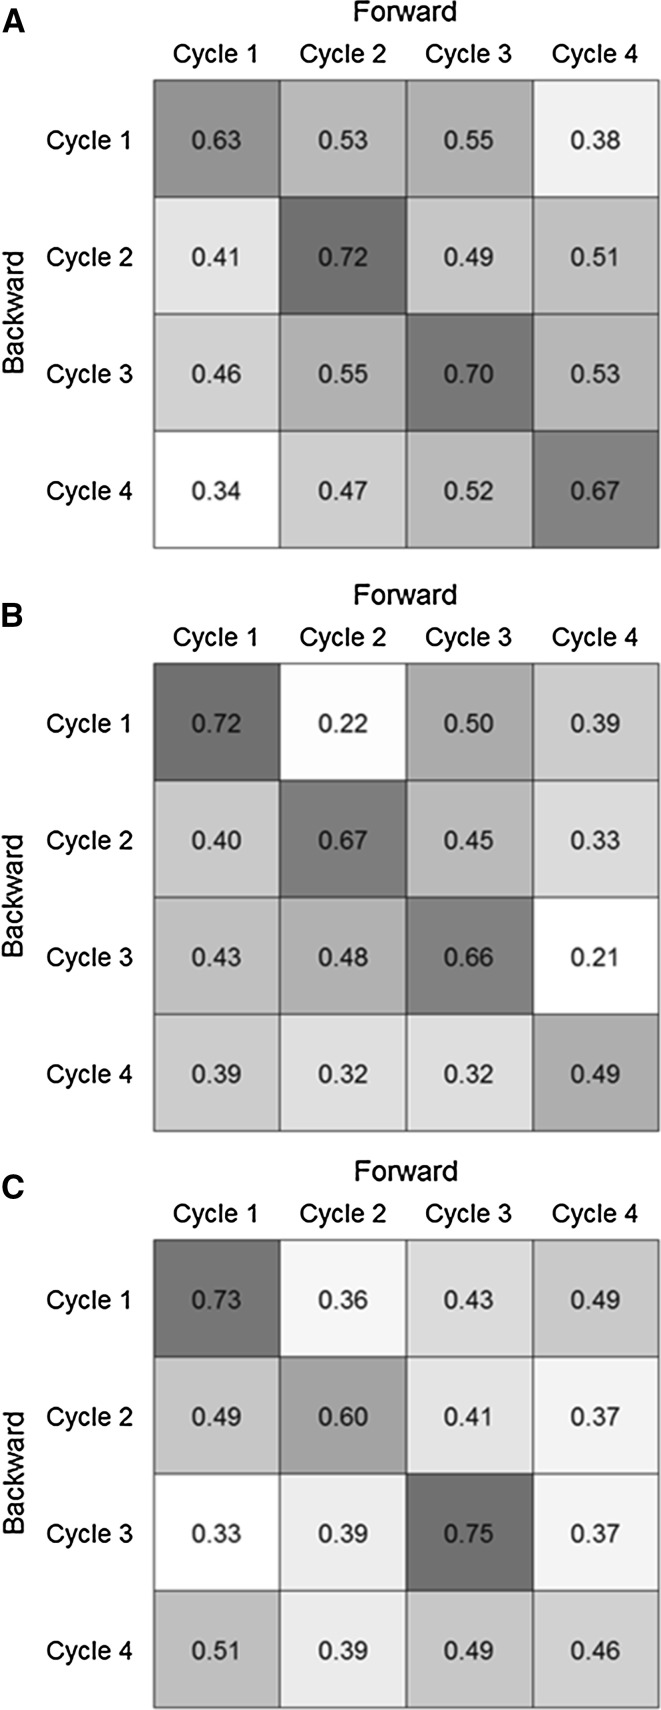
) prediction direction. Results are shown for all possible pairwise cycle combinations, with one cycle forming the calibration (N = 208) and one cycle the validation set (N = 52), respectively
Fig. 5
Fig. 5
Across-cycle (CV2.3) prediction accuracies for grain dry matter yield (GDY), plant height (PHT), and thousand kernel weight (TKW) obtained with PBLUP and GBLUP with lines from three cycles forming the calibration set. Boxplots show the median (horizontal line), mean (×), upper and lower quartile, and whiskers (vertical bars) from 10 × 5 fold cross-validation with random sampling and increasing calibration set sizes of N = 208, 416 and 624 lines at constant validation set sizes of N = 52. For each pair of boxplots the left shows PBLUP and the right GBLUP. Points above and below the whiskers indicate values ± 1.5 times the interquartile range

References

    1. Albrecht T, Wimmer V, Auinger HJ, Erbe M, Knaak C, Ouzunova M, Simianer H, Schön C-C. Genome-based prediction of testcross values in maize. Theor Appl Genet. 2011;123:339–350. doi: 10.1007/s00122-011-1587-7. - DOI - PubMed
    1. Albrecht T, Auinger HJ, Wimmer V, Ogutu JO, Knaak C, Ouzunova M, Piepho H-P, Schön C-C. Genome-based prediction of maize hybrid performance across genetic groups, testers, locations, and years. Theor Appl Genet. 2014;127:1375–1386. doi: 10.1007/s00122-014-2305-z. - DOI - PubMed
    1. Bauer E, Barilar I, Gundlach H, Hackauf B, Korzun V, Martis M, Mayer KFX, Schmid K, Schmutzer T, Schön C-C, Scholz U, Trost E (2015) Rye-don’t be afraid of an 8 Gb genome jigsaw. EUCARPIA-International Conference on Rye Breeding and Genetics, 24–26 June 2015, Wroclaw, Poland, pp 32–33
    1. Bernal-Vasquez A-M, Möhring J, Schmidt M, Schönleben M, Schön C-C, Piepho H-P. The importance of phenotypic data analysis for genomic prediction—a case study comparing different spatial models in rye. BMC Genom. 2014;15:646. doi: 10.1186/1471-2164-15-646. - DOI - PMC - PubMed
    1. Browning BL, Browning SR. A unified approach to genotype imputation and haplotype-phase inference for large data sets of trios and unrelated individuals. Am J Hum Genet. 2009;84:210–223. doi: 10.1016/j.ajhg.2009.01.005. - DOI - PMC - PubMed

LinkOut - more resources