. 2016 Sep 19;84(10):3034-46.
doi: 10.1128/IAI.00312-16. Print 2016 Oct.

Secretion Chaperones PrsA2 and HtrA Are Required for Listeria monocytogenes Replication following Intracellular Induction of Virulence Factor Secretion

Affiliations

Secretion Chaperones PrsA2 and HtrA Are Required for Listeria monocytogenes Replication following Intracellular Induction of Virulence Factor Secretion

Jana K Ahmed et al. Infect Immun. .

Abstract

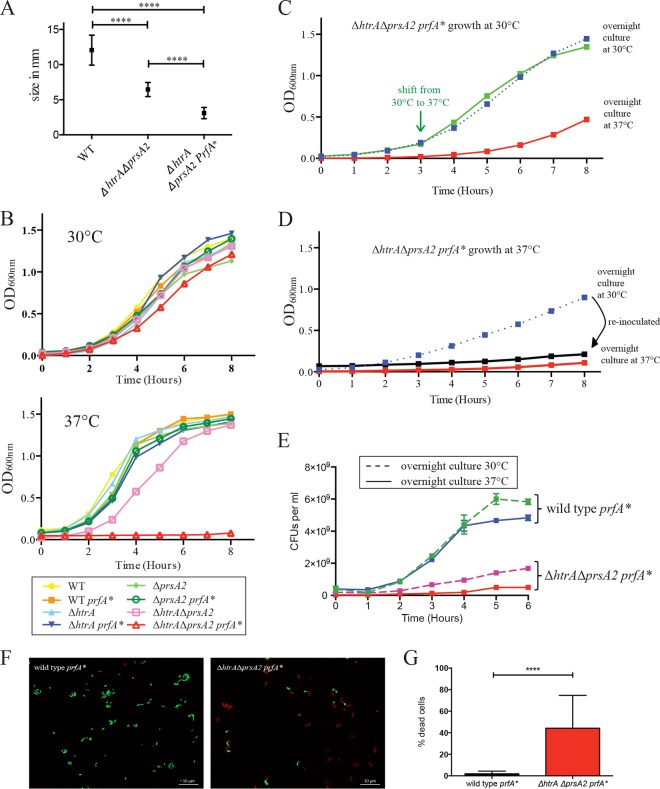
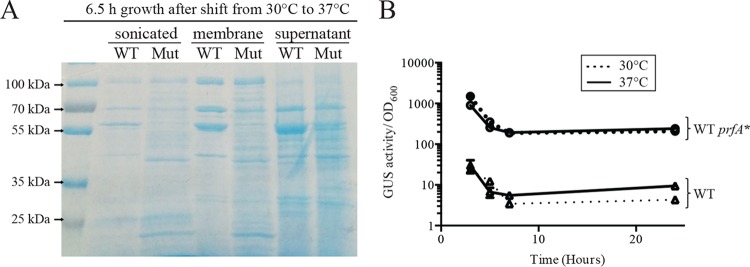
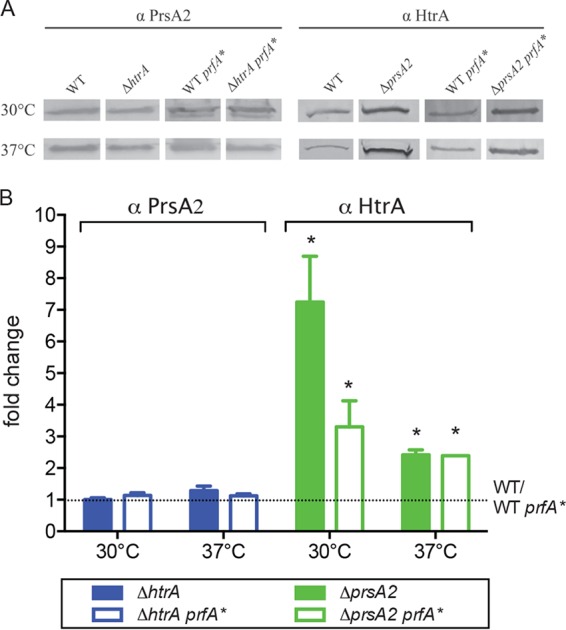
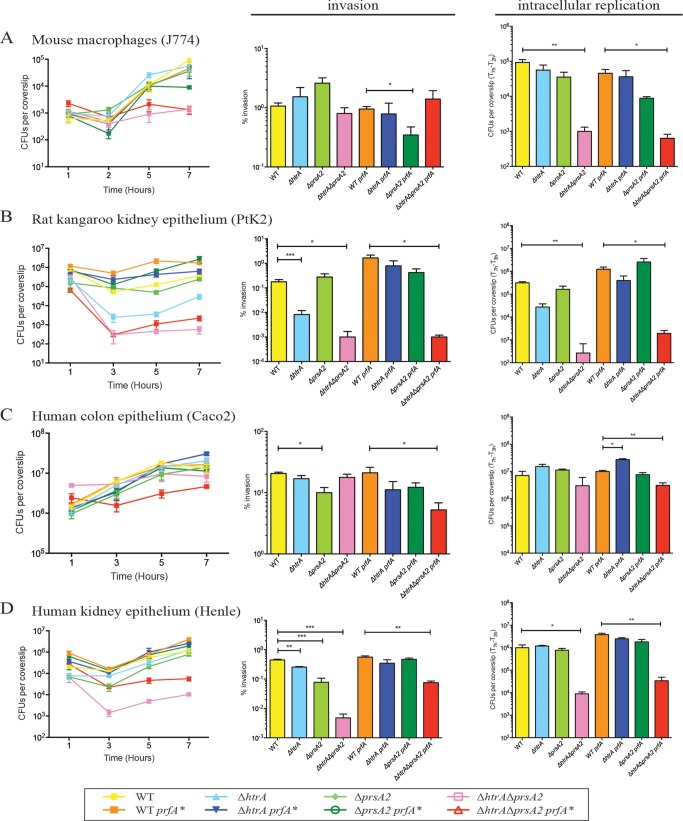
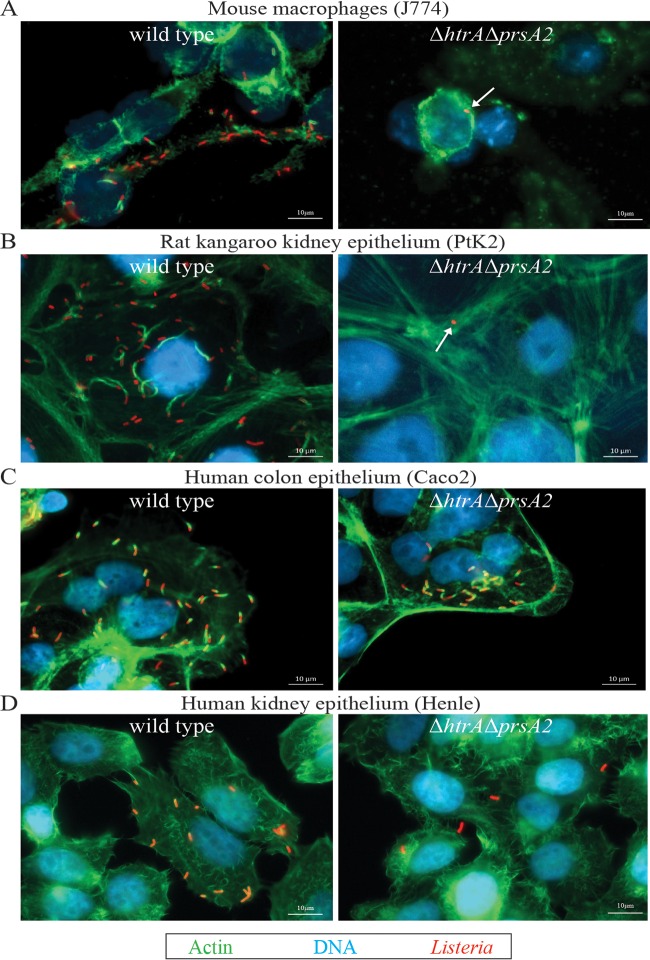
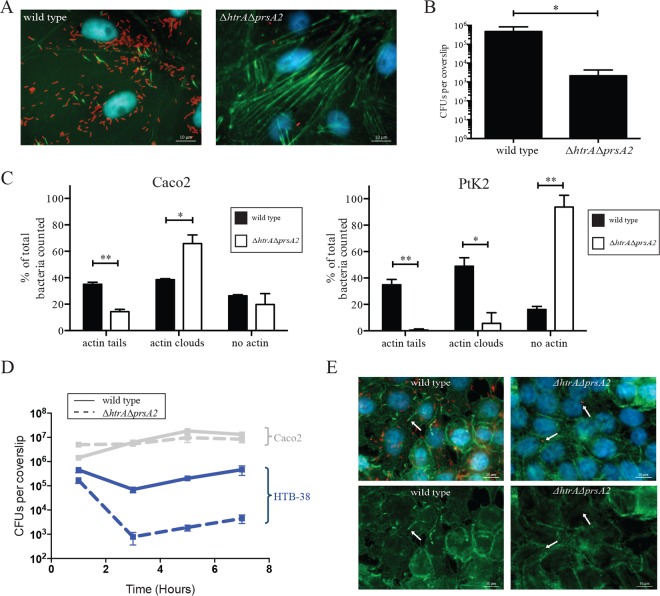
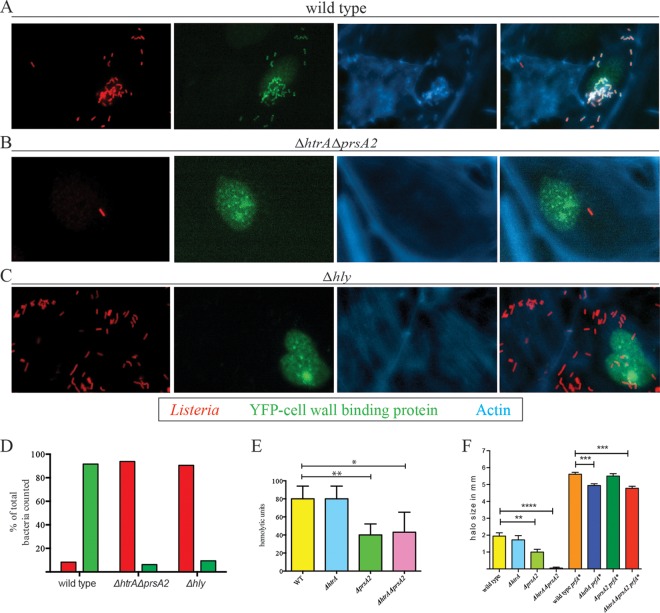
The Gram-positive bacterium Listeria monocytogenes transitions from an environmental organism to an intracellular pathogen following its ingestion by susceptible mammalian hosts. Bacterial replication within the cytosol of infected cells requires activation of the central virulence regulator PrfA followed by a PrfA-dependent induction of secreted virulence factors. The PrfA-induced secreted chaperone PrsA2 and the chaperone/protease HtrA contribute to the folding and stability of select proteins translocated across the bacterial membrane. L. monocytogenes strains that lack both prsA2 and htrA exhibit near-normal patterns of growth in broth culture but are severely attenuated in vivo We hypothesized that, in the absence of PrsA2 and HtrA, the increase in PrfA-dependent protein secretion that occurs following bacterial entry into the cytosol results in misfolded proteins accumulating at the bacterial membrane with a subsequent reduction in intracellular bacterial viability. Consistent with this hypothesis, the introduction of a constitutively activated allele of prfA (prfA*) into ΔprsA2 ΔhtrA strains was found to essentially inhibit bacterial growth at 37°C in broth culture. ΔprsA2 ΔhtrA strains were additionally found to be defective for cell invasion and vacuole escape in selected cell types, steps that precede full PrfA activation. These data establish the essential requirement for PrsA2 and HtrA in maintaining bacterial growth under conditions of PrfA activation. In addition, chaperone function is required for efficient bacterial invasion and rapid vacuole lysis within select host cell types, indicating roles for PrsA2/HtrA prior to cytosolic PrfA activation and the subsequent induction of virulence factor secretion.


Figures

FIG 1
FIG 1
L. monocytogenes ΔhtrA ΔprsA2::erm prfA* mutants exhibit pronounced growth defects at 37°C. (A) Colony sizes determined on BHI agar after 24 h of growth at 37°C. At least five colonies were measured from two independent experiments. Values that were statistically significantly different (P < 0.0001) by the t test are indicated by a bar and four asterisks. WT, wild type. (B) Bacterial growth as determined by optical density measurement at 600 nm at 30°C and 37°C at the indicated time points. (C and D) Bacterial growth of ΔhtrA ΔprsA2::erm prfA* at 30°C (C) and 37°C (D). (C) Growth at 30°C from an overnight inoculum culture grown at 37°C or 30°C and a temperature shift from 30°C to 37°C at 3 h. (D) Continuous growth at 37°C from an overnight inoculum culture grown at 37°C or 30°C are shown. The latter culture (blue line) was diluted 1:20 and grown again for 8 h at 37°C (black line). (E) Overnight cultures of the wild-type prfA* strain and the ΔhtrA ΔprsA2::erm prfA* mutant were grown at 30°C or 37°C, diluted 1:20, and grown at 37°C for 6 h. Every hour, a sample was taken, serially diluted, and plated for enumeration of CFU per milliliter. Data are representative of the data from two independent experiments. (F) Live/Dead staining of wild-type prfA* and ΔhtrA ΔprsA2::erm prfA* mutants. Overnight cultures were grown at 30°C, diluted 1:20 into fresh medium, and grown for 6 h at 37°C. Micrographs are representative of at least three independent experiments. (G) Enumeration of bacteria from Live/Dead staining. Data summarize results from at least three independent experiments. For each experiment, at least 30 bacteria were counted from 5 to 10 independent fields.
FIG 2
FIG 2
Changes in surface-associated proteins in the absence of the secretion chaperones and assessment of activation of PrfA at 37°C and 30°C. (A) Proteins isolated from lysed bacterial cells (sonicated), surface-associated proteins, and secreted proteins from supernatants. All cultures were normalized to an equal volume of a solution with an OD600 of 0.5 before treatment. The cultures were then subjected to fractionation, separation of proteins by SDS-PAGE, and staining with Coomassie blue. Overnight cultures were grown at 30°C, diluted 1:20 into fresh medium, and grown for 6.5 h at 37°C; the growth defect of the ΔhtrA ΔprsA2::erm prfA* mutant at 37°C prevented the use of this temperature for the growth of overnight cultures for these assays. Images shown are representative of at least three independent experiments. WT, wild type; Mut, ΔhtrA ΔprsA2::erm prfA* mutant. (B) PrfA activity was assessed based on the expression of a transcriptional fusion reporter gene (gus, encoding β-glucuronidase [GUS]) located between actA and plcB. Both actA and plcB are directly dependent on PrfA for expression, and thus, GUS activity serves as a readout of PrfA activity. The assay was performed with the wild-type (WT) and prfA L140F (WT prfA*) strains grown at 30°C and 37°C at the time points indicated. Two independent experiments were performed, and means are shown with error bars representing the standard deviations.
FIG 3
FIG 3
HtrA abundance increases in strains lacking PrsA2. (A) Western blot analysis of surface-associated HtrA and PrsA2 proteins from ΔprsA2 and ΔhtrA mutants, respectively. Proteins were isolated from mid-log-phase cultures grown for 3 to 4 h with shaking at 30°C or 37°C. Bacterial cultures were normalized to equal volumes of a solution with an OD600 of 0.5 before protein extraction. The HtrA and PrsA2 proteins were detected with antibodies against PrsA2 (α PrsA2) or HtrA (α HtrA). Images shown in panel A are representative of at least three independent experiments. The density of protein bands was measured using ImageJ software. (B) Fold change of HtrA and PrsA2 expression in mutants compared to the wild type (WT) or prfA* (WT prfA*). The values for the mutants that were significantly different (P < 0.05) from the values for the wild type are indicated by an asterisk.
FIG 4
FIG 4
L. monocytogenes strains lacking htrA and prsA2 are deficient for cell invasion and bacterial replication in assorted tissue culture cell lines. (A to D) Intracellular growth of the wild type (WT) and the indicated mutants was assessed in J774 (A), PtK2 (B), Caco2 (C), and Henle (D) cell lines. The cell lines were grown as monolayers on glass coverslips and infected with an MOI of 0.1:1 for J774 cells and an MOI 100:1 for all other cells. Gentamicin was added 1 h postinfection to kill extracellular bacteria. Three coverslips were removed at each of the indicated time points, host cells were lysed, and the CFU of intracellular bacteria were enumerated. Data are representative of at least three independent experiments. The values that are significantly different are indicated by bars and asterisks as follows: *, P < 0.05; **, P < 0.005; ***, P < 0.0005.
FIG 5
FIG 5
L. monocytogenes mutants lacking HtrA and PrsA2 are defective for recruitment of host cell actin in multiple cell lines. (A to D) Intracellular growth of the wild type (WT) and ΔhtrA ΔprsA2::erm mutant in J774 (A), PtK2 (B), Caco2 (C) and Henle (D) cell lines was visualized by fluorescence microscopy at 5 h postinfection. Pictures shown are representative of at least two experiments. In the pictures, Listeria is shown in red, host cell actin is shown in green, and DNA is shown in blue.
FIG 6
FIG 6
L. monocytogenes ΔhtrA ΔprsA2::erm mutants exhibit delayed actin assembly in a cell type-dependent manner even following prolonged incubation. (A) Fluorescence-based microscopy of PtK2 cell monolayers after 24-h infection with the wild type and the ΔhtrA ΔprsA2::erm mutant. In the micrographs, Listeria is shown in red, host cell filamentous actin is shown in green, and DNA is shown in blue. Micrographs shown are representative of images obtained from at least two experiments. (B) Enumeration of bacteria inside PtK2 host cells after 24 h of infection. Bacteria were counted from three coverslips per experiment from at least five independent fields, and experiments were repeated four times. The values that are significantly different are indicated by bars and asterisks as follows: *, P < 0.05; **, P < 0.005. (C) Quantification of host cell actin tails and clouds associated with L. monocytogenes wild-type and ΔhtrA ΔprsA2::erm mutant in Caco2 and PtK2 cell lines at 5 h postinfection. Between 50 and 500 bacteria were enumerated in 10 to 30 independent fields. Experiments were repeated twice. *, P < 0.05; **, P < 0.005. (D) Intracellular growth of the wild type and ΔhtrA ΔprsA2::erm mutant was assessed in HTB-38 cells, a human colon cell line. Host cells were grown to monolayers on glass coverslips and infected with an MOI of 100:1. Gentamicin was added 1 h postinfection to kill extracellular bacteria. Three coverslips were removed at each of the indicated time points, host cells were lysed, and the numbers of intracellular bacteria were enumerated. The experiment was repeated three times. For comparison reasons, intracellular growth in Caco2 cells is shown in gray (Caco2 data is the same data as in Fig. 4C). (E) Fluorescence-based microscopy of HTB-38 cell monolayers after 5 h of infection with the wild type or the ΔhtrA ΔprsA2::erm mutant. In the micrographs, Listeria is shown in red, host cell filamentous actin is shown in green, and DNA is shown in blue. Pictures shown are representative of at least two independent experiments.
FIG 7
FIG 7
Loss of HtrA and PrsA2 inhibits membrane perforation of host cell vacuoles. PtK2 cells were transfected with a mammalian expression vector expressing a fusion of the yellow fluorescent protein (YFP) to a cell wall binding domain of the phage endolysin Ply118 that binds specifically to the L. monocytogenes cell wall. (A to C) Five hours postinfection of transfected cells with the wild type (A), ΔhtrA ΔprsA2::erm mutant (B), or Δhly mutant (C), the coverslips were removed and stained for fluorescence-based microscopy. Note that the MOI used for the ΔhtrA ΔprsA2::erm and Δhly mutants was 8-fold higher than that for the wild type to increase the numbers of intracellular bacteria for which vacuole perforation might be observed. The increased number of Δhly bacteria seen in association with cells in comparison to ΔhtrA ΔprsA2::erm reflects the increased invasive capacity of the Δhly mutant for PtK2 cells compared to the ΔhtrA ΔprsA2::erm mutant. In the micrographs, Listeria is shown in red, phage cell wall binding domain fused to YFP is shown in green, and host cell filamentous actin is shown in blue. The images shown are representative of two experiments. (D) Quantitation of bacteria in PtK2 host cells with (green) and without (red) colocalization with phage cell wall binding protein from the host cytosol. (E) Measurement of LLO-associated bacterial hemolytic activity. Dilutions of bacterial culture supernatants were assessed for their ability to lyse sheep's red blood cells (RBCs) in vitro. The reciprocal of the supernatant dilution that resulted in 50% lysis of RBCs (hemolytic units) was determined in a minimum of three independent experiments. The values are averages plus standard deviations (error bars). (F) The production of PlcB-dependent phospholipase was assessed on Brilliance selective agar plates. Bacteria were spotted onto agar plates and incubated overnight at 30°C. The halo or zone of opacity surrounding bacterial growth is indicative of PlcB activity. The experiment was repeated independently three times. The values that are significantly different are indicated by bars and asterisks as follows: *, P < 0.05; **, P < 0.005; ***, P < 0.0005; ****, P < 0.0001.

References

    1. Sauders BD, Overdevest J, Fortes E, Windham K, Schukken Y, Lembo A, Wiedmann M. 2012. Diversity of Listeria species in urban and natural environments. Appl Environ Microbiol 78:4420–4433. doi:10.1128/AEM.00282-12. - DOI - PMC - PubMed
    1. Sauders BD, Durak MZ, Fortes E, Windham K, Schukken Y, Lembo AJ Jr, Akey B, Nightingale KK, Wiedmann M. 2006. Molecular characterization of Listeria monocytogenes from natural and urban environments. J Food Prot 69:93–105. - PubMed
    1. Weis J, Seeliger HP. 1975. Incidence of Listeria monocytogenes in nature. Appl Microbiol 30:29–32. - PMC - PubMed
    1. Centers for Disease Control and Prevention. 2011. Multistate outbreak of listeriosis associated with Jensen Farms cantaloupe–United States, August-September 2011. MMWR Morb Mortal Wkly Rep 60:1357–1358. - PubMed
    1. Olsen SJ, Patrick M, Hunter SB, Reddy V, Kornstein L, MacKenzie WR, Lane K, Bidol S, Stoltman GA, Frye DM, Lee I, Hurd S, Jones TF, LaPorte TN, Dewitt W, Graves L, Wiedmann M, Schoonmaker-Bopp DJ, Huang AJ, Vincent C, Bugenhagen A, Corby J, Carloni ER, Holcomb ME, Woron RF, Zansky SM, Dowdle G, Smith F, Ahrabi-Fard S, Ong AR, Tucker N, Hynes NA, Mead P. 2005. Multistate outbreak of Listeria monocytogenes infection linked to delicatessen turkey meat. Clin Infect Dis 40:962–967. doi:10.1086/428575. - DOI - PubMed

Publication types

MeSH terms

LinkOut - more resources