

Comparative Evaluation of Three TSPO PET Radiotracers in a LPS-Induced Model of Mild Neuroinflammation in Rats
- PMID: 27481358
- PMCID: PMC5209405
- DOI: 10.1007/s11307-016-0984-3
Comparative Evaluation of Three TSPO PET Radiotracers in a LPS-Induced Model of Mild Neuroinflammation in Rats
Abstract
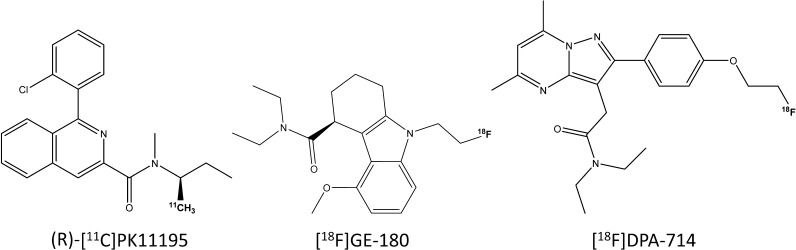
Purpose: Over the past 20 years, neuroinflammation (NI) has increasingly been recognised as having an important role in many neurodegenerative diseases, including Alzheimer's disease. As such, being able to image NI non-invasively in patients is critical to monitor pathological processes and potential therapies targeting neuroinflammation. The translocator protein (TSPO) has proven a reliable NI biomarker for positron emission tomography (PET) imaging. However, if TSPO imaging in acute conditions such as stroke provides strong and reliable signals, TSPO imaging in neurodegenerative diseases has proven more challenging. Here, we report results comparing the recently developed TSPO tracers [18F]GE-180 and [18F]DPA-714 with (R)-[11C]PK11195 in a rodent model of subtle focal inflammation.
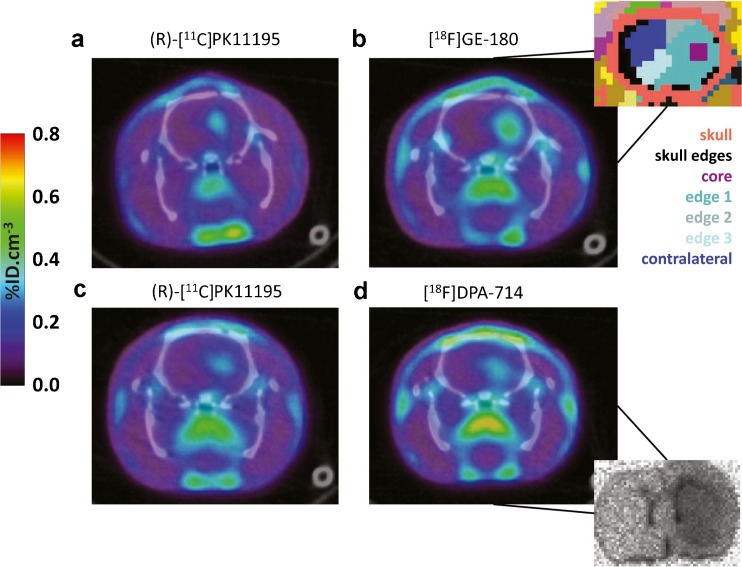
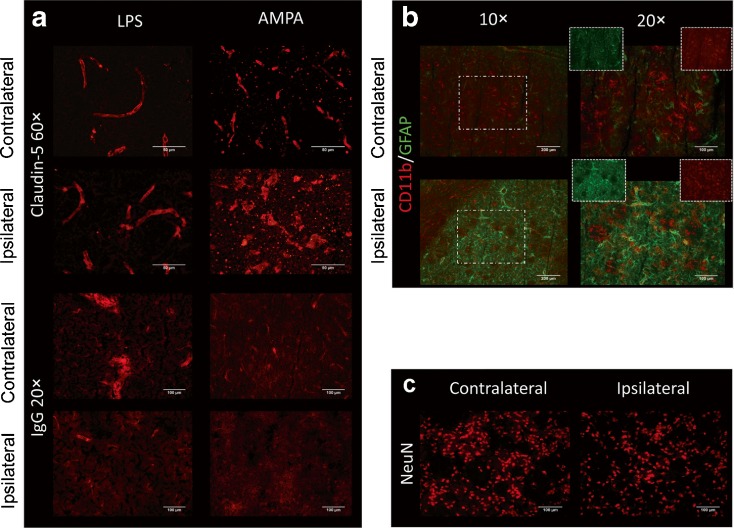
Procedures: Adult male Wistar rats were stereotactically injected with 1 μg lipopolysaccharide in the right striatum. Three days later, animals underwent a 60-min PET scan with (R)-[11C]PK11195 and [18F]GE-180 (n = 6) or [18F]DPA-714 (n = 6). Ten animals were scanned with either [18F]GE-180 (n = 5) or [18F]DPA-714 (n = 5) only. Kinetic analysis of PET data was performed using the simplified reference tissue model (SRTM) with a contralateral reference region or a novel data-driven input to estimate binding potential BPND. Autoradiography and immunohistochemistry were performed to confirm in vivo results.
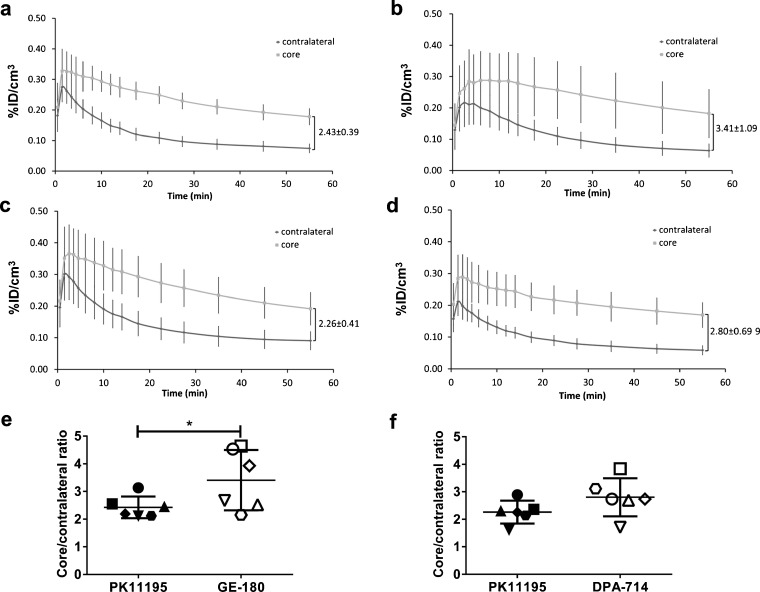
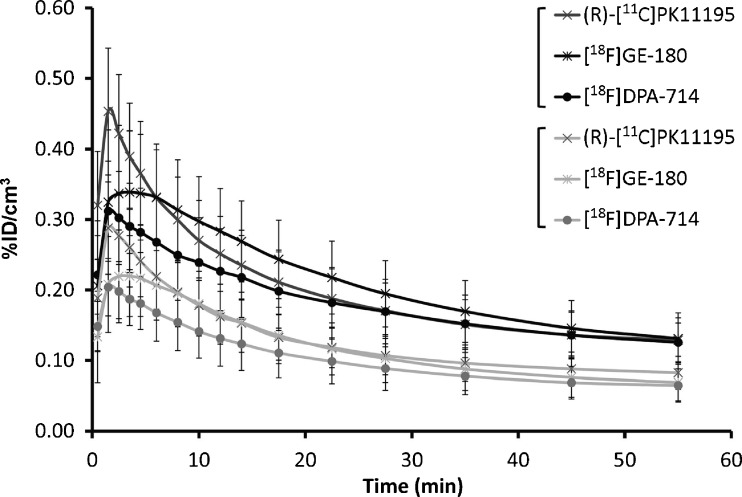
Results: At 40-60 min post-injection, [18F]GE-180 dual-scanned animals showed a significantly increased core/contralateral uptake ratio vs. the same animals scanned with (R)-[11C]PK11195 (3.41 ± 1.09 vs. 2.43 ± 0.39, p = 0.03); [18]DPA-714 did not (2.80 ± 0.69 vs. 2.26 ± 0.41). Kinetic modelling with a contralateral reference region identified significantly higher binding potential (BPND) in the core of the LPS injection site with [18F]GE-180 but not with [18F]DPA-714 vs. (R)-[11C]PK11195. A cerebellar reference region and novel data-driven input to the SRTM were unable to distinguish differences in tracer BPND.
Conclusions: Second-generation TSPO-PET tracers are able to accurately detect mild-level NI. In this model, [18F]GE-180 shows a higher core/contralateral ratio and BPND when compared to (R)-[11C]PK11195, while [18F]DPA-714 did not.
Keywords: Inflammation; LPS; Preclinical kinetic modelling; Second-generation tracers; TSPO.
Conflict of interest statement
SS is the recipient of an EPSRC CASE PhD studentship with GE Healthcare. GE Healthcare was not involved in the design of the study. All other authors declare no conflicts of interest.
Figures
References
-
- Gerhard A, Banati RB, Cagnin A, Brooks DJ. In vivo imaging of activated microglia with [C-11]PK11195 positron emission tomography (PET) in idiopathic and atypical Parkinson’s disease. Neurology. 2001;56:A270–A270. doi: 10.1212/WNL.56.2.270. - DOI
Publication types
MeSH terms
Substances
LinkOut - more resources
Full Text Sources
Other Literature Sources
Medical
Miscellaneous
