Review
. 2016 Aug 1;6(8):a026583.
doi: 10.1101/cshperspect.a026583.

Spatial Heterogeneity in the Tumor Microenvironment

Affiliations
Review

Spatial Heterogeneity in the Tumor Microenvironment

Yinyin Yuan. Cold Spring Harb Perspect Med. .

Abstract

Recent developments in studies of tumor heterogeneity have provoked new thoughts on cancer management. There is a desperate need to understand influence of the tumor microenvironment on cancer development and evolution. Applying principles and quantitative methods from ecology can suggest novel solutions to fulfil this need. We discuss spatial heterogeneity as a fundamental biological feature of the microenvironment, which has been largely ignored. Histological samples can provide spatial context of diverse cell types coexisting within the microenvironment. Advanced computer-vision techniques have been developed for spatial mapping of cells in histological samples. This has enabled the applications of experimental and analytical tools from ecology to cancer research, generating system-level knowledge of microenvironmental spatial heterogeneity. We focus on studies of immune infiltrate and tumor resource distribution, and highlight statistical approaches for addressing the emerging challenges based on these new approaches.


Figures

Figure 1.
Figure 1.
Spatial heterogeneity of the tumor microenvironment illustrated with an ovarian cancer histological hematoxylin and eosin (H&E) tumor section, where regional differences with respect to vessel distribution can be seen.
Figure 2.
Figure 2.
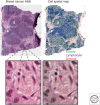
Spatial mapping of cancer and normal cells in histological images using automated image analysis techniques. Shown are a breast cancer hematoxylin and eosin (H&E)-stained image and a spatial distribution map of cell types identified by automated image analysis, including cancer cells (green), stromal cells (red), and lymphocytes (blue).
Figure 3.
Figure 3.
Schematic representation of cell spatial patterns captured by three statistical methods with histology image examples: (A) Morisita index, (B) Getis–Ord hotspot analysis, and (C) intratumor lymphocyte ratio (ITLR).
Figure 4.
Figure 4.
Quantifying cancer-immune cell colocalization using histological images. From left to right: hematoxylin and eosin (H&E) image of a breast cancer; classified cells in this image (cancer in green, lymphocyte in blue, and stromal cells in red); Voronoi tessellation over this image using random cancer cells as seeds; measuring cell colocalization based on the proportional data in the Voronoi grids (high colocalization in dark purple, and low colocalization in light blue).
Figure 5.
Figure 5.
Quantifying intratumor immune infiltration with intratumor lymphocyte ratio (ITLR). (A) Building a cancer density map using a kernel estimator, and (B) cancer density map with lymphocytes as spatial points. The density of cancer cells at the location of a lymphocyte can be used as a direct measurement of spatial proximity of this lymphocyte to cancer. (C) A higher resolution map of a tumor region. (D) Clustering lymphocytes based on their spatial relationships to cancer using Gaussian mixture clustering revealed three subclasses of lymphocytes.
Figure 6.
Figure 6.
Comparison of prognostic value of two immune spatial measures, the Morisita–Horn index and intratumor lymphocyte ratio (ITLR), in two independent patient cohorts (site 1 and 2) in breast cancer subtype (A) Her2-positive (Her2+), and (B) triple-negative breast cancer (TNBC), defined as ER-negative/Her2-negative.
Figure 7.
Figure 7.
Different spatial tessellation methods to provide spatial resolution for histological sample analysis: (A) Voronoi tessellation for a hematoxylin and eosin (H&E) slide and corresponding immune cell density heatmap as polygons, and (B) square tessellation for an H&E slide and corresponding immune cell density heatmap as polygons.

Similar articles

Cited by

References

    1. Alfarouk KO, Ibrahim ME, Gatenby RA, Brown JS. 2013. Riparian ecosystems in human cancers. Evol Appl 6: 46–53. - PMC - PubMed
    1. Anderberg C, Li H, Fredriksson L, Andrae J, Betsholtz C, Li X, Eriksson U, Pietras K. 2009. Paracrine signaling by platelet-derived growth factor-CC promotes tumor growth by recruitment of cancer-associated fibroblasts. Cancer Res 69: 369–378. - PMC - PubMed
    1. Arena S, Bellosillo B, Siravegna G, Martinez A, Canadas I, Lazzari L, Ferruz N, Russo M, Misale S, Gonzalez I, et al. 2015. Emergence of multiple EGFR extracellular mutations during cetuximab treatment in colorectal cancer. Clin Cancer Res 21: 2157–2166. - PubMed
    1. Balsat C, Blacher S, Signolle N, Beliard A, Munaut C, Goffin F, Noel A, Foidart JM, Kridelka F. 2011. Whole slide quantification of stromal lymphatic vessel distribution and peritumoral lymphatic vessel density in early invasive cervical cancer: A method description. ISRN Obstet Gynecol 2011: 354861. - PMC - PubMed
    1. Balsat C, Signolle N, Goffin F, Delbecque K, Plancoulaine B, Sauthier P, Samouelian V, Beliard A, Munaut C, Foidart JM, et al. 2014. Improved computer-assisted analysis of the global lymphatic network in human cervical tissues. Mod Pathol 27: 887–898. - PubMed

Publication types