. 2016 Aug 16;113(33):9345-50.
doi: 10.1073/pnas.1606631113. Epub 2016 Aug 1.

Early gut colonizers shape parasite susceptibility and microbiota composition in honey bee workers

Affiliations

Early gut colonizers shape parasite susceptibility and microbiota composition in honey bee workers

Ryan S Schwarz et al. Proc Natl Acad Sci U S A. .

Abstract

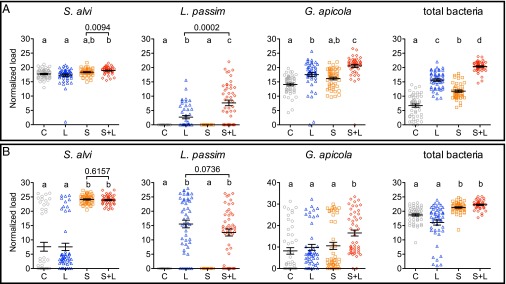
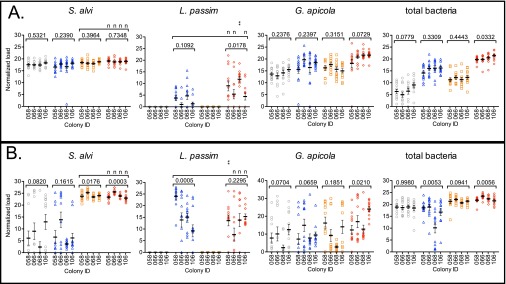
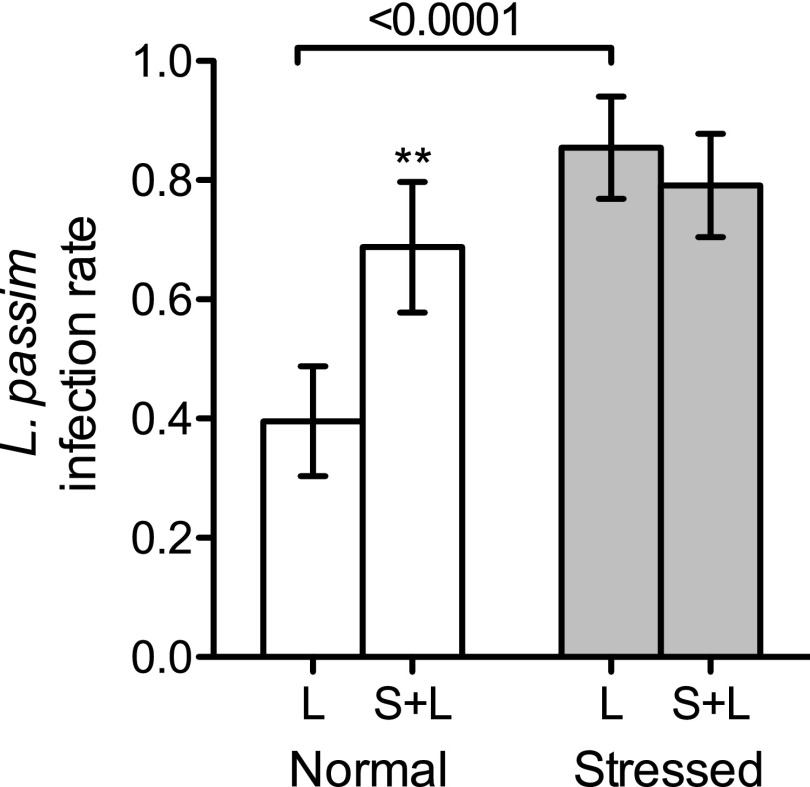
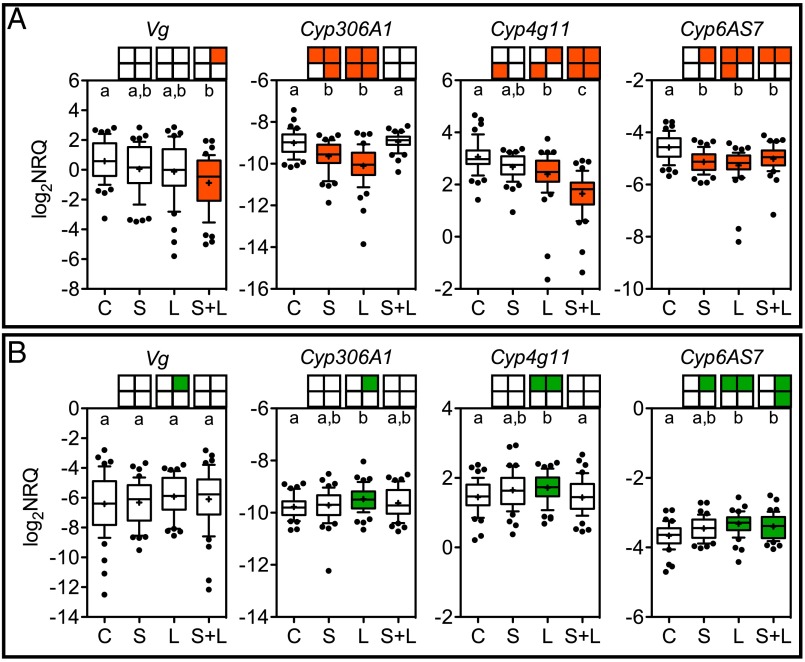
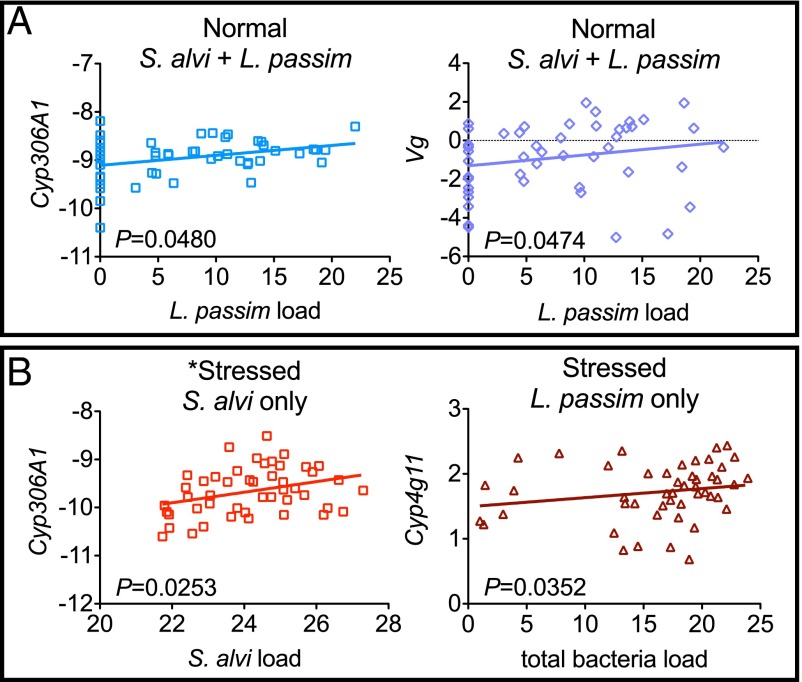
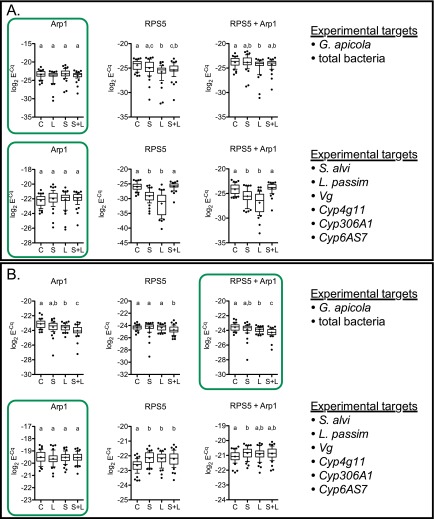
Microbial symbionts living within animal guts are largely composed of resident bacterial species, forming communities that often provide benefits to the host. Gut microbiomes of adult honey bees (Apis mellifera) include core residents such as the betaproteobacterium Snodgrassella alvi, alongside transient parasites such as the protozoan Lotmaria passim To test how these species affect microbiome composition and host physiology, we administered S alvi and/or L passim inocula to newly emerged worker bees from four genetic backgrounds (GH) and reared them in normal (within hives) or stressed (protein-deficient, asocial) conditions. Microbiota acquired by normal bees were abundant but quantitatively differed across treatments, indicating treatment-associated dysbiosis. Pretreatment with S. alvi made normal bees more susceptible to L. passim and altered developmental and detoxification gene expression. Stressed bees were more susceptible to L. passim and were depauperate in core microbiota, yet supplementation with S. alvi did not alter this susceptibility. Microbiomes were generally more variable by GH in stressed bees, which also showed opposing and comparatively reduced modulation of gene expression responses to treatments compared with normal bees. These data provide experimental support for a link between altered gut microbiota and increased parasite and pathogen prevalence, as observed from honey bee colony collapse disorder.

Keywords: cytochrome P450; dysbiosis; microbial interaction; parasitism; vitellogenin.


Conflict of interest statement

The authors declare no conflict of interest.

Figures

Fig. 1.
Fig. 1.
Microbial loads in bees during normal (A) and stressed (B) rearing. Means ± SEM are shown by the black bars and whiskers. Treatments (n = 48 each): sugar water control (C, gray circles); L. passim only (L, blue triangles); S. alvi only (S, orange squares); and S. alvi and L. passim (S+L, red diamonds). Different letters above treatment groups indicate significantly different loads (one-way ANOVA with Dunn’s multiple comparison tests). P values above brackets are from planned comparisons using two-tailed Mann–Whitney U tests. Data presented by each of four colonies in Fig. S1.
Fig. S1.
Fig. S1.
Microbial loads (targets noted above each graph) during normal (A) and stressed (B) rearing presented by GH for four parental honey bee colonies. Means ± SEM are shown by the black bars and whiskers. Treatments (n = 12 per colony): sugar water control (gray circles), L. passim (blue triangles), S. alvi (orange squares), and S. alvi + L. passim (red diamonds). P values above brackets are from planned comparisons using nonparametric one-way ANOVA with Kruskal–Wallis tests. Multiple comparisons by colony and treatment are from two-way ANOVA with Bonferroni posttests, shown above bracketed treatment groups: nP > 0.05, **P < 0.05.
Fig. 2.
Fig. 2.
Box plots of L. passim infection rates from bees with normal and stressed rearing. Bar height indicates the mean (n = 48) with SEM (error bars). **Significant difference between L. passim-challenged bees with S. alvi (S+L) vs. without (L); P = 0.0074, Fisher’s exact test of independence.
Fig. 3.
Fig. 3.
Gene expression in bees (n = 48 each) reared under normal (A) or stressed (B) conditions. Boxes above each plot summarize GH data by quadrant: upper left, colony 58; upper right, colony 66; lower left, colony 68; and lower right, colony 106. Significant changes compared with control are shaded: green, induced and red, suppressed. Groups that do not share a letter are significantly different (P < 0.05; Kruskal–Wallis with Dunn’s multiple comparison tests). Data are presented after reference gene normalization and primer efficiency correction. Whiskers span the 10th–90th percentile. Outliers are shown as dots. + indicates expression mean. Treatments: S. alvi (S), L. passim (L), both S. alvi and L. passim (S+L), and sugar water control (C).
Fig. 4.
Fig. 4.
Significant correlations between microbial loads and host gene expression during normal (A) and stressed (B) rearing. Treatment groups are given above each graph. Best-fit lines are plotted and P values are from two-tailed Spearman nonparametric correlation tests. Data presented are normalized to internal references. One outlier was removed from this dataset (*); removal made the correlation less significant (shown).
Fig. S2.
Fig. S2.
Reference gene data from normal (A) and stressed (B) honey bees. Boxed results in green indicated reference data statistically determined as optimal for normalization of experimental targets (listed at right). Datasets that share a letter above plotted data indicate no significant difference between those treatments. Variability was typically greater in RPS5 expression compared with Arp1. In one case, where both Arp1 and RPS5 expression varied by treatment group, the average of both reference genes was used according to standard protocol for qPCR analysis. Statistics: one-way ANOVA (Kruskal–Wallis, nonparametric) with Dunn’s multiple comparison tests. Whiskers indicate 10th–90th percentile; dots indicate outliers.

Comment in

References

    1. Sommer F, Bäckhed F. The gut microbiota--masters of host development and physiology. Nat Rev Microbiol. 2013;11(4):227–238. - PubMed
    1. Eleftherianos I, Atri J, Accetta J, Castillo JC. Endosymbiotic bacteria in insects: Guardians of the immune system? Front Physiol. 2013;4:46. - PMC - PubMed
    1. McFall-Ngai M, et al. Animals in a bacterial world, a new imperative for the life sciences. Proc Natl Acad Sci USA. 2013;110(9):3229–3236. - PMC - PubMed
    1. Engel P, Moran NA. The gut microbiota of insects - diversity in structure and function. FEMS Microbiol Rev. 2013;37(5):699–735. - PubMed
    1. Douglas AE. Symbiosis as a general principle in eukaryotic evolution. Cold Spring Harb Perspect Biol. 2014;6(2):a016113–a016113. - PMC - PubMed

Publication types

Substances