. 2016 Aug 16;113(33):9339-44.
doi: 10.1073/pnas.1604520113. Epub 2016 Aug 1.

Axitinib blocks Wnt/β-catenin signaling and directs asymmetric cell division in cancer

Affiliations

Axitinib blocks Wnt/β-catenin signaling and directs asymmetric cell division in cancer

Yi Qu et al. Proc Natl Acad Sci U S A. .

Abstract

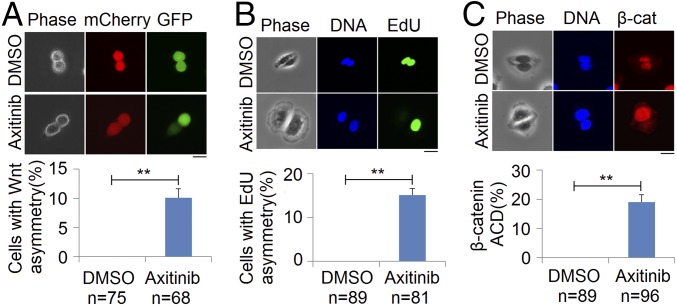
Oncogenic mutations of the Wnt (wingless)/β-catenin pathway are frequently observed in major cancer types. Thus far, however, no therapeutic agent targeting Wnt/β-catenin signaling is available for clinical use. Here we demonstrate that axitinib, a clinically approved drug, strikingly blocks Wnt/β-catenin signaling in cancer cells, zebrafish, and Apc(min/+) mice. Notably, axitinib dramatically induces Wnt asymmetry and nonrandom DNA segregation in cancer cells by promoting nuclear β-catenin degradation independent of the GSK3β (glycogen synthase kinase3β)/APC (adenomatous polyposis coli) complex. Using a DARTS (drug affinity-responsive target stability) assay coupled to 2D-DIGE (2D difference in gel electrophoresis) and mass spectrometry, we have identified the E3 ubiquitin ligase SHPRH (SNF2, histone-linker, PHD and RING finger domain-containing helicase) as the direct target of axitinib in blocking Wnt/β-catenin signaling. Treatment with axitinib stabilizes SHPRH and thereby increases the ubiquitination and degradation of β-catenin. Our findings suggest a previously unreported mechanism of nuclear β-catenin regulation and indicate that axitinib, a clinically approved drug, would provide therapeutic benefits for cancer patients with aberrant nuclear β-catenin activation.

Keywords: SHPRH; asymmetric cell division; axitinib; β-catenin.


Conflict of interest statement

The Technology Transfer Organization of University of Bergen (BTO) has filed a patent application (pending) for the use of axitinib as a WNT/β-catenin inhibitor in selected cancer types. None of the authors are affiliated with BTO. X.K., Y.Q., K.-H.K., and A.M.Ø are the inventors of the patent.

Figures

Fig. 1.
Fig. 1.
Axitinib inhibits Wnt/β-catenin signaling in zebrafish. (A) Chemical structure of axitinib. (B) Zebrafish embryos at 6 h post fertilization (hpf) were treated with 6BIO and axitinib at the indicated concentrations, and the eyeless phenotype was assessed 24 h later. n = total number of assessed embryos over four independent experiments. Embryos that died during treatment (n = 0, 4, 2, 0, 1, and 2 in the groups from left to right) were excluded from assessment. (C, Left) Representative images at 28 hpf of TCF-GFP transgenic zebrafish embryos treated with DMSO or axitinib (5 µM) for 2 d. n = 40 in each group; no embryos died. (Right) Representative images at 76 days post fertilization (dpf). The middle–hindbrain boundary (white arrows) and caudal fin mesenchyme are enlarged at the left and right, respectively. (D) Representative images of tailfin regeneration in TCF-GFP transgenic zebrafish (13 wk, n = 5 fish per group) treated with DMSO or axitinib (5 µM) for 6 d post amputation (dpa). Scale bars, 200 µm.
Fig. S1.
Fig. S1.
Screen of FDA-approved drugs inhibiting Wnt/β-catenin signaling. (A) TOPFlash assay of 293FT cells treated with 6BIO for 24 h. A FOPFlash reporter with mutant TCF-binding sites was used as negative control. The graph presents the mean ± SD of TOPFlash or FOPFlash activity normalized to Renilla luciferase activity. (B) RT-PCR analysis of Wnt target genes in 293FT cells treated as indicated for 24 h. Data shown represent the mean ± SD of the relative mRNA expression of the indicated genes in real-time quantitative PCR reactions performed in triplicate. (C) Schematic diagram of the Wnt inhibitor screening strategy. Wnt/β-catenin signaling in 293FT cells is activated by treatment with the GSK3 inhibitor 6BIO and is measured by the TOPFlash reporter. Candidates were further tested in 293FT cells overexpressing the β-catenin 4A mutant that is resistant to the AXIN/GSK3β/APC destruction complex. (D) TOPFlash assay of an FDA-approved drug library. 293FT cells in 96-well plates were treated with 6BIO (1 μM) or with 460 FDA-approved drugs (10 μM) for 24 h before the TOPFlash assay. The data present TOPFlash activity normalized to Renilla luciferase activity. The drug (axitinib) showing strongest inhibition of TOPFlash activity is indicated. (E) TOPFlash assay of 293FT cells treated as indicated for 24 h. Data (mean ± SD) represent TOPFlash or FOPFlash activity normalized to Renilla activity in three independent experiments. (F) Schematic diagram of the generation of the 7TC reporter by removing the GFP and SV40 promoter modules from the 7TGC reporter. (G) Representative images of prostate EPT1-7TGC (Upper) or EPT3-7TC (Lower) cells treated as indicated for 24 h. (H) TOPFlash assay of 293FT cells transfected with β-catenin variants and treated with axitinib at the indicated concentrations for 24 h. *P < 0.05, **P < 0.01.
Fig. S2.
Fig. S2.
Axitinib inhibits Wnt/β-catenin signaling in cancer cells. (A) TOPFlash assay of SW480, HCT116, and RKO cancer cells. (B) TOPFlash assay of SW480 and HCT116 cells treated with axitinib at the indicated concentrations for 24 h. (C) Flow cytometry analysis of cells carrying lentiviral Wnt 7TGC reporter. The expression of mCherry and GFP indicates positive reporter transduction and activation of Wnt/β-catenin signaling, respectively. In SW480 and RKO cells, the proportions of TCF-GFP+ cells were 98% and 0.5%, respectively, confirming the high specificity of the 7TGC reporter. (D, Left) Flow cytometry analysis of SW480-7TGC cells treated with the indicated concentrations of axitinib for 24 h followed by incubation with Hoechst33342 (10 μM) for 20 min. (Right) The graph represents the changes in TCF-GFPlow cells with different Hoechst intensities. High Hoechst intensity indicates apoptosis. (E) Soft agar assay of colon cancer cells. SW480, HCT116, and RKO cells were seeded in soft agar, treated with axitinib at the indicated concentrations, and imaged 10 d later. Colony growth was quantified by measurement of OD at 590 nm; the graph presents the OD590 ratios in experiments performed in triplicate. Scale bars, 100 µm. (F) DNA microarray analysis and heat map of the top 10 repressed genes in SW480 cells treated with axitinib at 5 μM for 24 h (1d) or 72 h (3d). Genes that are direct targets of β-catenin and TCF4-occupied/β-catenin–dependent genes (44, 45) are named in red and blue, respectively. (G). Percentages of genes that are direct targets of Wnt that are changed in SW480 cells treated with axitinib (5 μM) for 3 d. (H) Quantification of the repressed expression of genes that are direct targets of Wnt in SW480 cells treated with axitinib (5 μM) for 3 d.
Fig. S3.
Fig. S3.
Axitinib inhibits Wnt/β-catenin signaling in tumors but not in normal tissues. (A) Representative H&E and IHC staining of intestinal adenomas in 12-wk-old Apcmin/+ mice. A strong increase in β-catenin was found in all multivillus adenomas and microadenomas. (B) Quantification of small intestinal adenomas in Apcmin/+ mice treated with vehicle or axitinib for 5 wk (n = 5 mice per group). **P < 0.01. (C) Representative IHC staining of Ki67 in adenomas of Apcmin/+ mice. (D) Representative images of Apc mutant organoids treated with axitinib. Mouse Apc (VilCreER Apcfl/fl) intestinal organoids were seeded in Matrigel and treated with axitinib at the indicated concentrations for 7 d before imaging. (E) Representative images of H&E staining (Left) and IHC staining of Ki67 (Right) in normal-looking small intestine of adult (12-wk-old) Apcmin/+ mice. No obvious differences in epithelial morphology or distribution of Ki67+ cells were observed between tissues treated with vehicle or axitinib for 5 wk (n = 5 mice per group). (F) Representative H&E (Left) and bromodeoxyuridine (BrdU) (Right) staining of the intestinal tract of adult (13-wk-old) zebrafish. Fish were treated with DMSO or axitinib (5 μM) continuously for 6 d and were incubated with 1 mM BrdU for 2 h at the end of treatment. The intestinal architecture and BrdU incorporation were comparable in axitinib- and DMSO-treated fish (n = 5 fish per group). Scale bars, 50 µm in A; 100 µm in CF.
Fig. 2.
Fig. 2.
Axitinib directs ACD. Microscope images and quantitation of paired cells treated with DMSO or 5 μM axitinib. (A) SW480-7TGC cells were treated for 24 h to detect TCF-GFP expression. (B) SW480 cells were treated for 72 h for the EdU label-release assay. (C) SW480 cells were treated for 24 h for β-catenin (β-cat) staining. **P < 0.01. n = total paired counted cells over three independent experiments. Scale bars, 20 μm.
Fig. S4.
Fig. S4.
Axitinib directs Wnt asymmetry and nonrandom DNA segregation. (A) Representative live-cell images of SW480-7TGC cells treated with DMSO or axitinib (5 μM). Images were acquired in the GFP channel. In axitinib-treated cells, unequal TCF-GFP expression in daughter cells was shown during cell division. (B) Axitinib induces Wnt ACD in EPT3-7TGC cells. EPT3 are prostate cancer cells in which TCF-GFP is silenced but readily activated by 6BIO. EPT3-7TGC cells were treated with 6BIO (1 μM) alone or together with axitinib (5 μM) for 24 h, and paired cells were scored for TCF-GFP expression. n = number of paired cells. (C) Axitinib induces Wnt ACD in SW480 cells containing the 7TC reporter. Cells at G1/S phase were plated singly and treated with DMSO or axitinib (5 μM). After 12 h the TCF-mCherry expression in paired cells was scored. (D) Schematic diagram of the EdU label-release assay. Two pairs of chromosomes are shown for clarity. In a pulse of EdU label, the newly synthesized DNA is incorporated with EdU during DNA replication. Cells containing EdU-labeled DNA are marked by green color. At the second cell division, DNA segregation is random in symmetrically dividing cells, so that both daughter cells contain EdU-labeled DNA, but in asymmetrically dividing cells DNA segregation is nonrandom, and thus one daughter cell contains EdU-labeled DNA and the other does not. The protocol of the EdU label-release assay is indicated as steps 1, 2, and 3. Step 1: Cells are treated with DMSO or drug overnight before 30-min incubation with 10-µM EdU. Step 2: Following EdU labeling, cells are washed three times with PBS before being seeded singly on new plates and treated immediately with DMSO or drug. Step 3: Three days later cells are fixed for EdU detection. Paired cells are scored for EdU staining and quantification. (E) EdU label-release assay of HCT116 and RKO cells treated as indicated for 3 d. (Left), Representative images of EdU staining of HCT116 and RKO cells. (Right), Quantitative analysis of the EdU ACD in HCT116 and RKO cells. **P < 0.01. Scale bars, 20 μm.
Fig. S5.
Fig. S5.
Correlation of Wnt ACD, β-catenin ACD, and nonrandom DNA segregation in axitinib-treated SW480 cells. All cells were treated with DMSO or 5 μM axitinib for 24 h unless noted otherwise; n = total paired cells counted during three independent experiments. (A) Immunofluorescence staining of Ki67 in axitinib-treated SW480-7TC cells with unequal TCF-mCherry expression (n = 170). Doub pos, double positive (both cells are Ki67+); Neg corr, negative correlation (only Wntlow cells were Ki67+); Pos corr, positive correlation (only Wnthigh cells were Ki67+). (B) Correlation of unequal TCF-mCherry (Wnt ACD) and nonrandom DNA segregation (EdU ACD) in axitinib-treated SW480-7TC cells (n = 195). (C) Correlation of unequal β-catenin (β-cat ACD) and Wnt ACD in axitinib-treated SW480-7TC cells (n = 134). (D) Correlation of β-cat ACD and EdU ACD in SW480 cells treated with 5 μM axitinib for 3 d (n = 212). **P < 0.01. Scale bars, 20 μm.
Fig. S6.
Fig. S6.
Axitinib promotes nuclear β-catenin degradation. (A) Western blots of SW480 cells treated with axitinib in a dose course for 24 h (Upper) and a time course at 5 μM (Lower) using antibodies against β-catenin and GAPDH (load control). Both the dose- and time-course experiments were performed in triplicate with high reproducibility. (B) In vivo ubiquitination assay of SW480 cells treated with MG132 together with DMSO or axitinib for 6 h. (C) Immunofluorescence staining (Left) and Western blot (Right) analysis of SW480 cells treated with the nuclear export inhibitor leptomycin B (LMB) together with DMSO or axitinib (5 μM) for 24 h. (D) Representative IHC staining of β-catenin in intestinal adenomas of Apcmin/+ mice described in Fig. S3B. (E) Western blots (Left) and RT-PCR (Right) examination of the expression of β-catenin (CTNNB1) in SW480 cells transfected with shRNA vectors for 24 h. Sh-βcat-1, -2, and -3 were Addgene plasmids number 19761, 19762, and 42543, respectively. **P < 0.01. (F) Fluorescence microscopy images of SW480-7TGC cells (Left) and EdU staining of wild-type SW480 cells (Center) transfected with control or β-catenin shRNAs. (Right) The graph shows the quantification of asymmetric cells. (G) Western blots of SW480 cells treated with axitinib at the indicated concentrations for 24 h using antibodies against active (nonphosphorylated) β-catenin (ABC), β-catenin phosphorylated at Ser33/Ser37 (pS33/37), at Ser45 (pS45), and total β-catenin. GAPDH served as the loading control. (H) Western blots of 293FT (Left) and SW480 (Right) cells treated with XAV939 (2 μM) and IWR1 (10 μM) for 24 h. 293FT cells were transfected with wild-type β-catenin or β-catenin with the 4A (Ser33A/Ser37 A/Thr41A/Ser45A) mutation at the time of compound treatment. The slight decrease in β-catenin in the XAV939/IWR1-treated SW480-4A samples could reflect the decrease of endogenous β-catenin in 293FT cells. (I) XAV939 and IWR1 did not induce Wnt ACD in SW480 cells. SW480-7TGC cells were treated with indicated compounds for 24 h before quantification of Wnt ACD. (J) Western blots of 293FT cells transfected with FLAG- or HA-tagged β-catenin mutants (4A, 2A, 3A) and treated with axitinib as indicated for 24 h. 4A, Ser33A/Ser37 A/Thr41A/Ser45A; 2A: W504A/I507A; 3A: W504A/I507A/S715A. Scale bars, 20 µm in C and F; 100 μm in D.
Fig. S7.
Fig. S7.
Axitinib inhibits Wnt/β-catenin independently of VEGFRs. (A) In vitro enzyme-activity assays. Axitinib inhibition of VEGFR1, VEGFR3, and FLT3 was determined using the Adapta Universal Kinase Assay. Kinases CDK1 and CDK5 were used as negative controls. (B) DNA microarray profiling of SW480 cells and ranking of the genes based on the expression levels. Gene expression value (log2) was generated and normalized by the J-Express program; the highest log2 value was 16, and the lowest log2 value was 5. The top 50% and 30% of genes were considered expressed and highly expressed genes, respectively (46, 47). The expression of known axitinib kinase targets (FLT1, KDR, FLT4, KIT, FLT3, PDGFRA, and PDGFRB), kinases known to be present in all cycling cells (CDK2 and EGFR), and SHPRH are indicated. (C) TOPFlash assay of VEGFR inhibitors. 293FT cells were treated with 6BIO (1 μM) together with DMSO or a VEGFR inhibitor (axitinib, sunitinib, vandetanib, or apatinib) for 24 h. (D) RT-PCR analysis of the expression of Wnt target genes AXIN2 and LEF1. 293FT cells were treated with 6BIO and VEGFR inhibitors (10 μM) as indicated for 24 h before total RNA purification. **P < 0.01.
Fig. 3.
Fig. 3.
Identification of proteins binding directly to axitinib. (A) 2D-DIGE images of the DARTS samples. SW480 protein lysates were incubated with axitinib (150 μM) or an equal volume of DMSO and were digested with pronase before 2D-DIGE. (B) MST analysis of axitinib binding to GFP-SHPRH (four replicates) or free GFP (negative control; two replicates) in SW480 cell lysates. The fitted binding curve gives a Kd of 10.4 ± 3.3 µM. (C) Western blots of intact cell CETSA samples. SW480 cells were incubated with axitinib (10 μM) or an equal volume of DMSO for 2 h at 37 °C followed by heating at the indicated temperatures. Cells were lysed, and the soluble portion was analyzed using Western blot. The abundance of SHPRH normalized to GAPDH is shown.
Fig. S8.
Fig. S8.
Identification of proteins that directly bind axitinib. (A) Schematic diagram of the DARTS assay coupled with 2D-DIGE and mass spectrometry. Cell lysates were divided precisely and incubated with equal volumes of DMSO and axitinib, respectively. After proteolysis with the same amount pronase, DMSO- and axitinib-treated cell lysates were labeled with Cy3 and Cy5, respectively, and mixed for 2D-DIGE. Protein spots with significant differences between two samples were selected for mass spectrometry analysis. (B) Enlarged 2D-DIGE images of the protein spots most differently retained in SW480 DARTS samples treated with DMSO and axitinib. (C) Intensity ratios of the spots assigned in B with more than 10 between DMSO- and axitinib-treated samples. (D) List of the proteins detected among the assigned spots by mass spectrometry analysis. MW, molecule weight. (E) Western blot confirmed the stabilization of SHPRH by axitinib in SW480 cell lysates in the DARTS assay. (F) RT-PCR analysis of the MED23 mRNA expression in SW480 cells overexpressing control (sh-ctrl) or MED23 shRNAs (D3, D4, and D5). (G) Western blot of SW480 cells overexpressing control (sh-ctrl) or MED23 shRNA (D3) with indicated antibodies.
Fig. 4.
Fig. 4.
SHPRH is required for axitinib degradation of β-catenin. (A) Representative β-catenin staining in SW480 cells transfected with GFP-tagged SHPRH or control GFP vector for 24 h. Endogenous β-catenin was reduced in cells overexpressing SHPRH. Experiments were performed in triplicate with high reproducibility. Scale bar, 20 µm. (B) Overexpression of GFP-SHPRH or axitinib treatment in SW480 cells reduced β-catenin in wild-type cells and in cells with the indicated mutations. FL, full length. (C) SHPRH increases the ubiquitination and turnover of β-catenin. SW480 cells were transfected with GFP (control, Ctrl) or with wild-type or mutant (MT) GFP-SHPRH for 24 h (Upper) and in addition were treated with MG132 (20 µM) for 6 h (Lower). C, control. (D) Western blots of SW480 cells transfected with siRNAs and treated with axitinib (5 µM) as indicated for 24 h. C, control; 73, si-SHPRH-73; 75, si-SHPRH-75. (E) Ubiquitination assay of β-catenin. SW480 cells were transfected with control (C) or SHPRH (73) siRNAs for 24 h and were treated with MG132 (20 µM) together with DMSO or axitinib (5 µM) for 6 h. The quantification of ubiquitylated β-catenin is shown in C and E.
Fig. S9.
Fig. S9.
SHPRH is a functional target of axitinib in inhibiting Wnt signaling. (A) Overexpression of GFP-SHPRH or treatment of axitinib in SW480 cells reduced HA-tagged wild-type or ΔC β-catenin. (B) Western blots (Left) and RT-PCR (Right) analysis of SW480 cells transfected with indicated amounts of GFP-SHPRH in six-well plates for 24 h. The ratio of GFP-SHPRH (exo) to endogenous SHPRH (endo) is shown. (C) Western blots of SW480 cells treated with DMSO or axitinib (5 μM) for 6 h together with cycloheximide (Chx) at the indicated times. (D) Western blots (Left) and RT-PCR (Right) examination of SHPRH expression in SW480 cells transfected with siRNAs for 24 h. *P < 0.05. (E) Analysis of the overlap in the top 400 down-regulated (Left) and up-regulated (Right) genes in SW480 cells treated with axitinib and cells overexpressing SHPRH. (F) Heat map of commonly repressed genes that are direct targets of Wnt in SW480 cells treated with axitinib (5 μM) and in cells transfected with SHPRH for 24 h. The expression of SHPRH is shown as well.
Fig. 5.
Fig. 5.
SHPRH negatively regulates Wnt signaling. (A) TOPFlash assay of SW480 cells transfected with wild-type or mutant (MT) GFP-SHPRH, nontransfected control (control) or empty vector (vector). (B) Representative microscope images of TCF-mCherry expression in SW480-7TC cells transfected with the indicated vectors. Cells were seeded singly on new plates 24 h later, and images were captured after 10 h. In some dividing cells plasmids were lost cells during cell division. (C) SW480-7TC cells were transfected as indicated for 24 h and passaged twice in 6 d. Paired cells retaining plasmids (marked by GFP expression) in both daughter cells were imaged and scored for the TCF-mCherry expression. **P < 0.01. Scale bar, 20 µm. (D) Representative images (Left) and quantification (Right) of colony formation in SW480 cells overexpressing wild-type or mutant (MT) SHPRH for 2 wk. Colony growth was quantified by measurement of OD590. The graph presents the normalized OD590 ratios of experiments performed in triplicate. *P < 0.05.

Similar articles

Cited by

References

    1. Kahn M. Can we safely target the WNT pathway? Nat Rev Drug Discov. 2014;13(7):513–532. - PMC - PubMed
    1. Clevers H, Nusse R. Wnt/β-catenin signaling and disease. Cell. 2012;149(6):1192–1205. - PubMed
    1. Lenz HJ, Kahn M. Safely targeting cancer stem cells via selective catenin coactivator antagonism. Cancer Sci. 2014;105(9):1087–1092. - PMC - PubMed
    1. Morrison SJ, Kimble J. Asymmetric and symmetric stem-cell divisions in development and cancer. Nature. 2006;441(7097):1068–1074. - PubMed
    1. Bajaj J, Zimdahl B, Reya T. Fearful symmetry: Subversion of asymmetric division in cancer development and progression. Cancer Res. 2015;75(5):792–797. - PMC - PubMed

Publication types