. 2016 Aug 16;113(33):9210-5.
doi: 10.1073/pnas.1603908113. Epub 2016 Aug 1.

Partial squeeze film levitation modulates fingertip friction

Affiliations

Partial squeeze film levitation modulates fingertip friction

Michaël Wiertlewski et al. Proc Natl Acad Sci U S A. .

Abstract

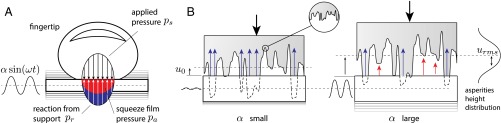
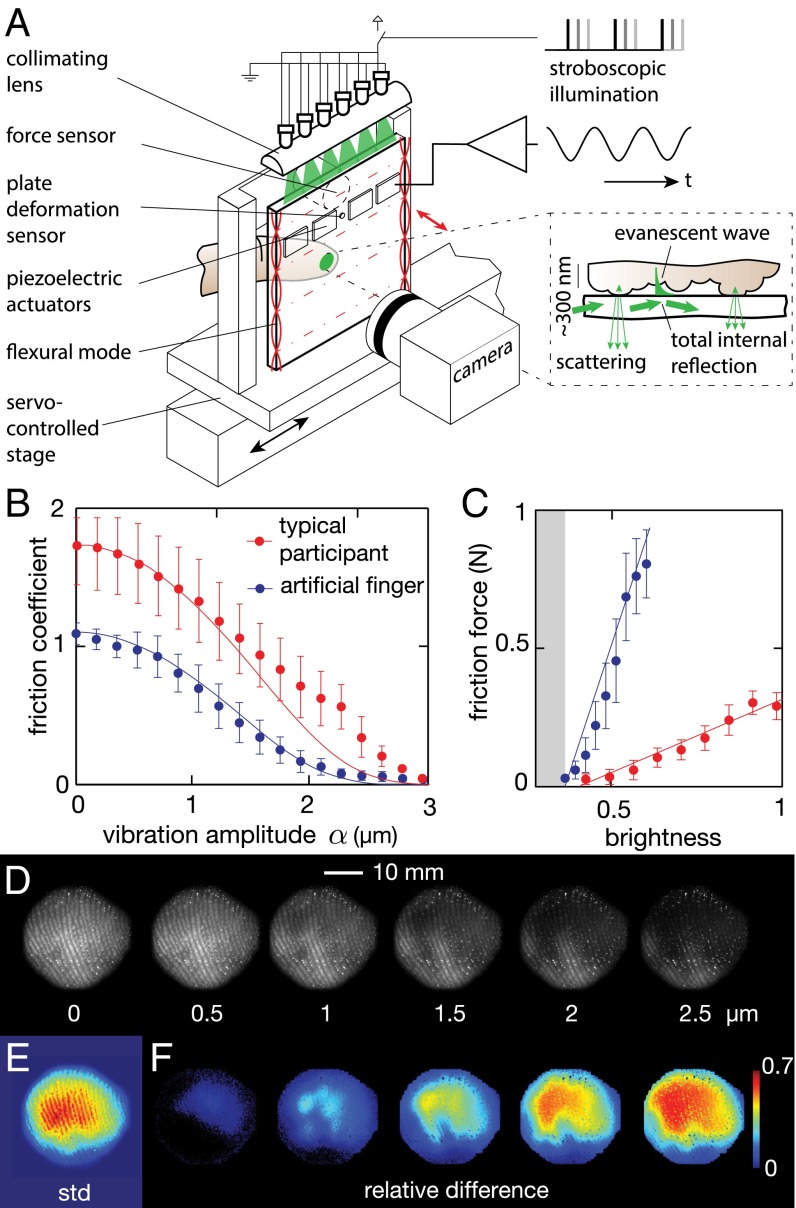
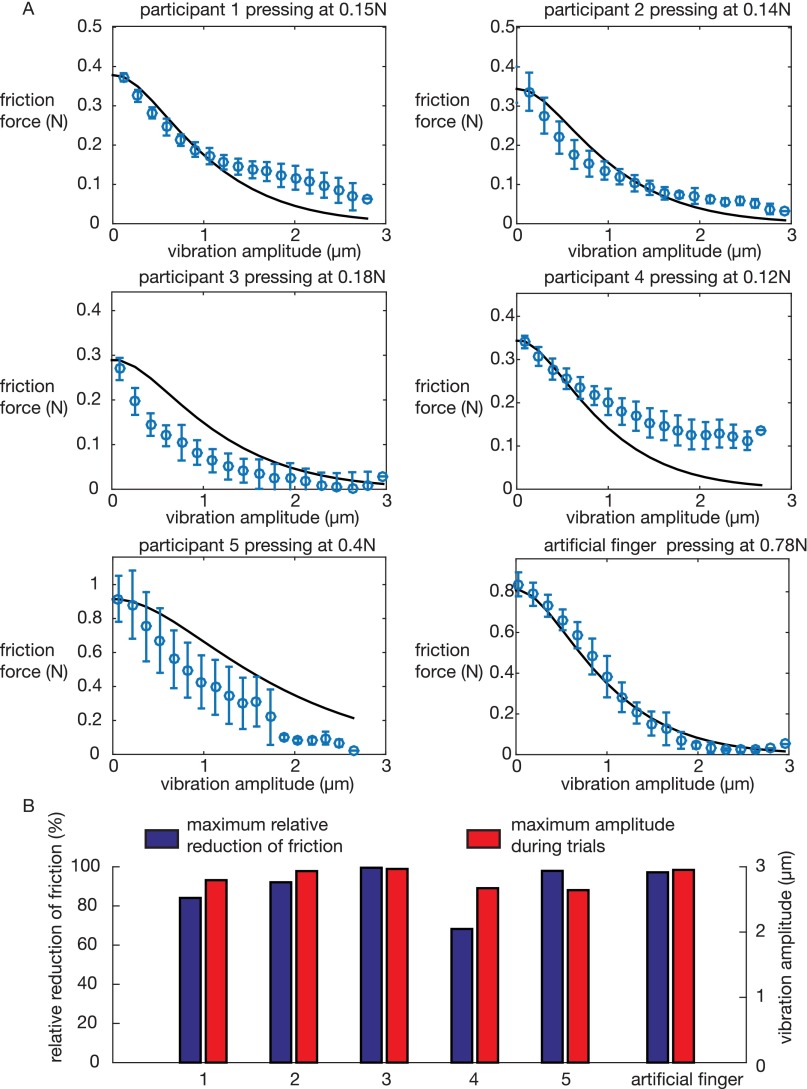
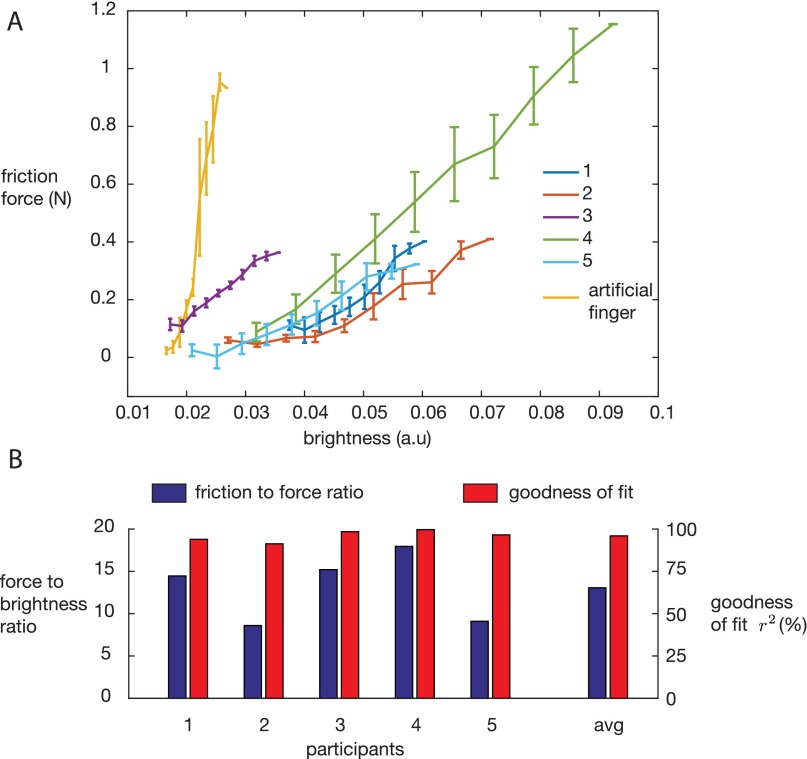
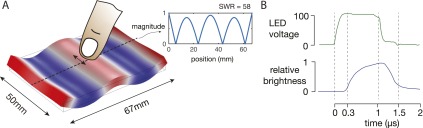
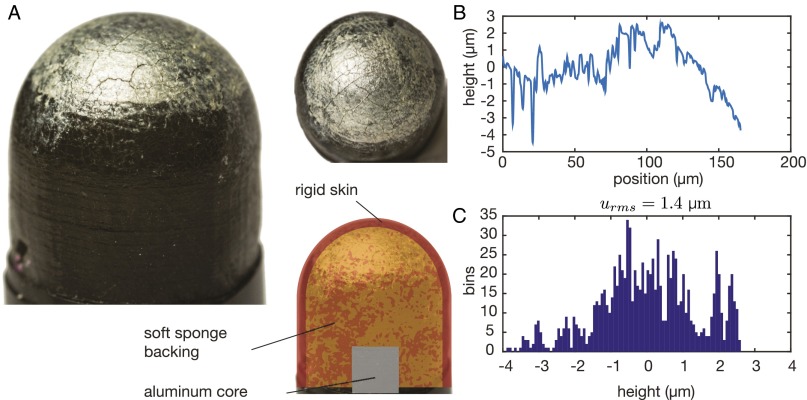
When touched, a glass plate excited with ultrasonic transverse waves feels notably more slippery than it does at rest. To study this phenomenon, we use frustrated total internal reflection to image the asperities of the skin that are in intimate contact with a glass plate. We observed that the load at the interface is shared between the elastic compression of the asperities of the skin and a squeeze film of air. Stroboscopic investigation reveals that the time evolution of the interfacial gap is partially out of phase with the plate vibration. Taken together, these results suggest that the skin bounces against the vibrating plate but that the bounces are cushioned by a squeeze film of air that does not have time to escape the interfacial separation. This behavior results in dynamic levitation, in which the average number of asperities in intimate contact is reduced, thereby reducing friction. This improved understanding of the physics of friction reduction provides key guidelines for designing interfaces that can dynamically modulate friction with soft materials and biological tissues, such as human fingertips.

Keywords: acoustic; biotribology; haptics; roughness; squeeze film.


Conflict of interest statement

J.E.C. is a founder of Tanvas, Inc., which holds license to variable friction technology.

Figures

Fig. 1.
Fig. 1.
(A) Balance of time-averaged pressure when the plate undergoes ultrasonic vibrations. (B) View of the asperities. At low amplitude, the reaction from the support balances the pressing force completely. At high amplitude, both the reaction from the support and the squeeze film pressure contribute to balancing the pressing force. In addition, the average interfacial separation is increased.
Fig. 2.
Fig. 2.
(A) Experimental setup. The vibrating plate is mounted on a servo-controlled stage equipped with a six-axis force sensor. Illumination from the side of the plate provides a uniform illumination of the true contact area through frustrated total internal reflection (A, Inset). (B) The sliding friction force gradually decreases with increasing vibration amplitude. The line represents the (C) brightness and friction force correlation. The illumination technique reveals those asperities that are within a few hundred nanometers of the plate; therefore, the spatial average of the brightness received by the camera is linearly correlated with the friction force and under the adhesive theory of friction, linearly correlated with the true area of contact. (D) Images of the contact area under ultrasonic vibration amplitudes of 0–2.5 μm. (E) Spatial distribution of the variation of brightness over a cycle where the amplitude of stimulation is slowly varying. The center of the contact experiences the most variation, whereas the edge remains unaffected. (F) The difference between the brightness at selected amplitudes and the brightness at rest highlight those areas that are more or less affected by vibration.
Fig. S1.
Fig. S1.
(A) Friction measurement for each participant compared with the prediction from the model, with urms=5μm. (B) Summary of the effectiveness of the friction reduction at the maximum vibration amplitude tested.
Fig. S2.
Fig. S2.
(A) Relationship between friction force while sliding and the brightness of the contact patch. The observed linearity is expected, because both friction and brightness are proportional to the true area of contact. (B) The ratio of force to brightness for all human participants. The artificial finger has a value of 120 on this scale.
Fig. S3.
Fig. S3.
Representative results from the model. Solid lines are found by numerical solution of Eq. S11, and dashed lines are the first-order approximation described in S13. A and B are the interfacial separation and resulting relative area of contact for various initial separations u0 and constant external pressures ps between conditions, respectively. C and D are the same output with an initial separation that depends of the external pressure. This last condition corresponds to the contact with an elastic body, which follows Eq. S2.
Fig. 3.
Fig. 3.
(A) Local brightness corresponds to the number of asperities in contact, which depends on pressure. Brightness scaled by the normal force reveals the pressure profile along the central axis of the contact. The squeeze film pressure is highest in the center of the contact. (B) Calculated interfacial separation. Larger applied pressure in the center results in a lower gap, which in turn, influences the acoustic radiation pressure created by the squeeze film of air. (C and D) Results from the fitting procedure with a Hertz contact model. The nominal pressure and the squeeze film pressure are asymmetric.
Fig. 4.
Fig. 4.
(A) Time domain variation of brightness. Changes in brightness closely follow a sinusoidal pattern. (B) Phase portrait of brightness and plate position. Increased amplitude decreases the average brightness but increases the variation. (C) Selected images of the spatial distribution of brightness variation. (D) Variation and average brightness are correlated in each image. The lines are linear regressions. (E) The ratio is a function of the amplitude of stimulation. The prediction from a model with large skin roughness urms=5μm is in black. (F) Phase between motion of the plate and the interfacial separation as a function of amplitude and participant. (G) Selected spatially distributed phase plots. Large variations of phase occur across trials. (H) Simplified linear model of the skin bouncing off the film of air leads to behaviors similar to the experimental observations.
Fig. S4.
Fig. S4.
Dynamics of the gap u as modeled by a second-order system excited with an elastic squeeze film ksq. (A) Relative amplitude |u/x1| and (B) relative phase u/x1 of the variation of the gap with respect to the vibration of the plate for a set of squeeze film springs ksq and different skin dissipation bt. Each parameter is normalized to the impedance of the inertia. The thick red lines show the locus for which the phase difference is 220°, and the dashed lines represent a 20° tolerance. (C) Locus of squeeze film stiffness and skin damping values for which the phase of the gap with respect to the plate motion corresponds to the experimental data (i.e., from 200° to 240°). There is almost no sensitivity to normalized damping for values lower than 0.5, which highlights the robustness to variation in skin properties. (D) Illustration of the model. (E) Model prediction of the movement of the plate. (F) Estimated relative brightness, which matches relatively well the experimental data in Fig. 4, despite the assumption of linear dynamics.
Fig. S5.
Fig. S5.
(A) Finite element simulation of the flexural mode shape of the plate used in the experiments. Subjects placed their index finger in contact with the center antinode. The design of the plate is optimized for maximum uniformity of the vibration amplitude along the width of the plate. A, Inset shows the magnitude of the vibration along the length. The calculated standing wave ration (SWR) is 58. (B) Measurement of the time response of the LED during a short impulse. The pulse width is under 1μs, which gives an effective stroboscopic illumination bandwidth of 1 MHz.
Fig. S6.
Fig. S6.
(A) Picture of the artificial finger used in the study. (B) Results of interferometric measurement of the surface roughness. (C) Histogram of the surface profile.

References

    1. Cadoret G, Smith AM. Friction, not texture, dictates grip forces used during object manipulation. J Neurophysiol. 1996;75(5):1963–1969. - PubMed
    1. Smith AM, et al. Roughness of simulated surfaces examined with a haptic tool: Effects of spatial period, friction, and resistance amplitude. Exp Brain Res. 2010;202(1):33–43. - PubMed
    1. Wiertlewski M, Lozada J, Hayward V. The spatial spectrum of tangential skin displacement can encode tactual texture. IEEE Trans Robot. 2011;27(3):461–472.
    1. Johansson RS, Westling G. Roles of glabrous skin receptors and sensorimotor memory in automatic control of precision grip when lifting rougher or more slippery objects. Exp Brain Res. 1984;56(3):550–564. - PubMed
    1. Westling G, Johansson RS. Responses in glabrous skin mechanoreceptors during precision grip in humans. Exp Brain Res. 1987;66(1):128–140. - PubMed

Publication types