. 2016 Jul 29;2(7):e1600650.
doi: 10.1126/sciadv.1600650. eCollection 2016 Jul.

HU multimerization shift controls nucleoid compaction

Affiliations

HU multimerization shift controls nucleoid compaction

Michal Hammel et al. Sci Adv. .

Abstract

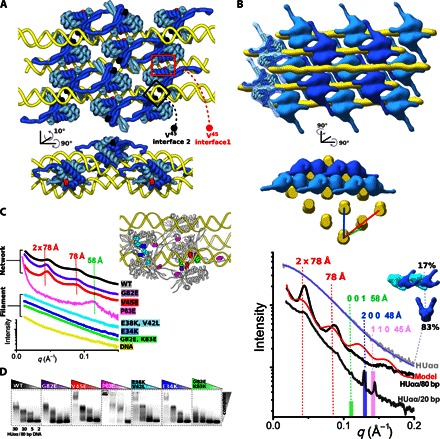
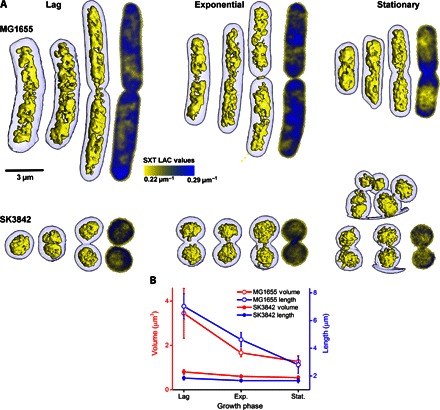
Molecular mechanisms controlling functional bacterial chromosome (nucleoid) compaction and organization are surprisingly enigmatic but partly depend on conserved, histone-like proteins HUαα and HUαβ and their interactions that span the nanoscale and mesoscale from protein-DNA complexes to the bacterial chromosome and nucleoid structure. We determined the crystal structures of these chromosome-associated proteins in complex with native duplex DNA. Distinct DNA binding modes of HUαα and HUαβ elucidate fundamental features of bacterial chromosome packing that regulate gene transcription. By combining crystal structures with solution x-ray scattering results, we determined architectures of HU-DNA nucleoproteins in solution under near-physiological conditions. These macromolecular conformations and interactions result in contraction at the cellular level based on in vivo imaging of native unlabeled nucleoid by soft x-ray tomography upon HUβ and ectopic HUα38 expression. Structural characterization of charge-altered HUαα-DNA complexes reveals an HU molecular switch that is suitable for condensing nucleoid and reprogramming noninvasive Escherichia coli into an invasive form. Collective findings suggest that shifts between networking and cooperative and noncooperative DNA-dependent HU multimerization control DNA compaction and supercoiling independently of cellular topoisomerase activity. By integrating x-ray crystal structures, x-ray scattering, mutational tests, and x-ray imaging that span from protein-DNA complexes to the bacterial chromosome and nucleoid structure, we show that defined dynamic HU interaction networks can promote nucleoid reorganization and transcriptional regulation as efficient general microbial mechanisms to help synchronize genetic responses to cell cycle, changing environments, and pathogenesis.

Keywords: HU; SAXS; bacterial chromosome compaction; histone-like protein; nucleoid; pathogenicity; transcriptional regulation; x-ray tomography.


Figures

Fig. 1
Fig. 1. HU-DNA crystal structures, functional interactions, and interfaces.
(A to C) Crystal structures of HUαα-DNA, HUαβ-DNA, or HUα38α38-DNA for four asymmetric units across continuous DNA are colored as indicated. V45 inserts into the DNA minor groove as shown for interfaces 1 and 2. The E38K mutation site in the HUα38α38-DNA structure is highlighted (green). (D) Two asymmetric units of the Anabaena HUαα crystal structure bound to a distorted DNA substrate. The positions of DNA, extra bases, residue P63, and V45 are colored as indicated. (E) Superimposition of HUαα-DNA and HUαβ-DNA interfaces. The protein portion was superimposed to highlight different DNA paths.
Fig. 2
Fig. 2. HUαα-DNA network interactions and assembly.
(A) Two orthogonal views of HUαα-DNA assembly built by combining multiple crystal asymmetric units along two lateral and one medial DNA. Location of the phosphate lock is highlighted with V45 residues. (B) Two orthogonal views of the HUαα-DNA nucleoprotein network displayed in molecular surface. The bottom panel shows experimental SAXS of the 16× HUαα/80-bp DNA complex, 8× HUαα/20-bp DNA, and free HUαα with the diffraction peaks at the spacings corresponding to the distances between DNAs as indicated. The red line indicates theoretical SAXS calculated from the two parallel DNAs matching observed SAXS oscillations. SAXS curve of the HUαα–20-bp DNA complex shows sharper peaks due to a more ordered assembly with the peaks matching the reflections (hkl: 001, 200, 110) of the crystal structure related to the highlighted distances. SAXS of free HUαα matches the theoretical profile (blue) of an oligomeric mixture as indicated. (C) SAXS for 18× HUαα, 13× HUααG82E, 16× HUααV45E, and 5× HUααP63E with 80-bp DNA shows the diffraction peaks indicating the DNA networks. Note that the HUααP63E mutant is missing the first diffractions at d ~ 78 and d~2 × 78 Å, suggesting disruption of the medial DNA network. SAXS for 10× HUα38α38E38K,L42V, 18× HUααE34K, and 19× HUααG82E,K83E with 80-bp DNA shows the absence of peaks indicating filament-like assemblies. WT, wild type. (D) Electrophoretic mobility shift assay (EMSA) gel for each mutation at homodimer/80-bp DNA ratios of 30:1, 10:1, 5:1, and 2:1 at a DNA concentration of 0.0027 mM.
Fig. 3
Fig. 3. HUαβ-DNA interactions and assembly.
(A) Three orthogonal views of HUαβ-DNA assembly along DNA. Assembly from six asymmetric units of the HUαβ–19-bp DNA crystal structure. Location of the phosphate lock is indicated with V45 residues. (B) Comparison of the electrostatic surfaces of HUαα-HUαα-HUαα and HUαβ-HUαβ coupling across the DNA. HUαβ-HUαβ couples that interact across the DNA do not multimerize with laterally positioned HUαβ. Close-up views highlight the network of hydrogen bonds required for HUαα and HUαβ coupling. The substitution of K90N, E15D, and E12A in the β-chain (green labels) suggests disruption of the hydrogen bond network required for lateral multimerization. (C) Experimental SAXS curves for 16× HUαβ/80-bp DNA, 2× HUαβ/80-bp DNA, 80-bp DNA, 1× HUαβ/20-bp DNA, and free HUαβ matching profiles calculated for an ensemble of two atomistic models (low-resolution molecular surfaces). P(r) functions of the corresponding SAXS curves are normalized by volumes determined by SAXS (25) and indicated in Fig. 4D. P(r) functions indicate maximal dimensions between 250 and 290 Å and volumes of assemblies, which are consistent with atomistic models.
Fig. 4
Fig. 4. HUα38α38-DNA interactions and assembly.
(A) Two orthogonal views of HUα38α38 assembly along DNA. Alternating HUα38α38s are shown for six asymmetric units of the HUα38α38–19-bp DNA crystal structure. V45 residues and the K38E mutation are highlighted. (B) Arrangements of HUα38α38-HUα38α38 and HUαα-HUαα coupling across DNA are shown as electrostatic surfaces. The right panel shows changes in the electrostatic surface between HUαα and the HUα38α38 mutant. Close-up views highlight the network of hydrogen bonds required for coupling of HUα38α38-HUα38α38. Mutations E38K and V42L are highlighted in green. (C) Experimental SAXS curves for 16× HUα38α38/DNA, 8× HUα38α38/DNA, and 4× HUα38α38/DNA ratios and for free HUα38α38 matching the theoretical profiles of atomistic models shown in the right panel (see also fig. S8). Multiple asymmetric units along 80-bp DNA are displayed as low-resolution molecular surfaces. P(r) functions (inset) were calculated from the corresponding SAXS curves and normalized based on experimentally determined volumes of assemblies (25) indicated in (D). P(r) functions indicate maximal dimensions between 250 and 290 Å and volumes of assemblies, which are consistent with atomistic models. (D) SAXS-determined cross-sectional RG’s and volumes show the formation of HUαβ/80-bp DNA complexes that are thicker and bulkier than HUα38α38/80-bp DNA complexes. These parameters cannot be determined for crystalline HUαα complexes formed at the >3× HUαα/80-bp DNA ratio.
Fig. 5
Fig. 5. Nucleoid condensation upon HUβ and ectopic HUα38 expression.
(A) SXT displays nucleoid organization for WT MG1655 and mutant HUα38 (SK3842) E. coli strains at all stages of the cell cycle. Three representative reconstructions are shown for the lag, exponential, and stationary phase. Nucleoid volume (yellow surface rendering) was segmented from the tomographic reconstruction using the 3D LAC at LAC = 0.25 μm−1. A representative orthoslice for the nonsegmented image is shown for each growth phase within the LAC = 0.22 to 0.29 μm−1 (yellow to blue). (B) Quantification of the total volume of the nucleoid by SXT at LAC = 0.25 μm−1 revealed that MG1655 cells in the late growth phase had a decreased nucleoid volume from 3.5 to 1.5 μm3. Condensation in SK3842 is more marked with a nucleoid volume of <1 μm3 in all growth phases.

References

    1. Wang X., Montero Llopis P., Rudner D. Z., Organization and segregation of bacterial chromosomes. Nat. Rev. Genet. 14, 191–203 (2013). - PMC - PubMed
    1. Dorman C. J., Genome architecture and global gene regulation in bacteria: Making progress towards a unified model? Nat. Rev. Microbiol. 11, 349–355 (2013). - PubMed
    1. Wang W., Li G.-W., Chen C., Xie X. S., Zhuang X., Chromosome organization by a nucleoid-associated protein in live bacteria. Science 333, 1445–1449 (2011). - PMC - PubMed
    1. Dillon S. C., Dorman C. J., Bacterial nucleoid-associated proteins, nucleoid structure and gene expression. Nat. Rev. Microbiol. 8, 185–195 (2010). - PubMed
    1. Azam T. A., Ishihama A., Twelve species of the nucleoid-associated protein from Escherichia coli. Sequence recognition specificity and DNA binding affinity. J. Biol. Chem. 274, 33105–33113 (1999). - PubMed

Publication types

MeSH terms

LinkOut - more resources