. 2016 Nov;157(11):2594-2604.
doi: 10.1097/j.pain.0000000000000679.

The mitogen and stress-activated protein kinase 1 regulates the rapid epigenetic tagging of dorsal horn neurons and nocifensive behaviour

Affiliations

The mitogen and stress-activated protein kinase 1 regulates the rapid epigenetic tagging of dorsal horn neurons and nocifensive behaviour

Keri K Tochiki et al. Pain. 2016 Nov.

Abstract

Phosphorylation of histone H3 at serine 10 (p-H3S10) is a marker of active gene transcription. Using cognitive models of neural plasticity, p-H3S10 was shown to be downstream of extracellular signal-regulated kinase (ERK) signalling in the hippocampus. In this study, we show that nociceptive signalling after peripheral formalin injection increased p-H3S10 expression in the ipsilateral dorsal horn. This increase was maximal 30 minutes after formalin injection and occurred mainly within p-ERK-positive neurons. Spinal p-H3S10-enhanced expression was also observed in neurokinin 1 receptor (NK1R), c-Fos, and Zif268 positive neurons and was inhibited by ablation of serotonergic descending controls. The mitogen and stress-activated protein kinase 1 (MSK1) is downstream of ERK and can induce p-H3S10. We found that, after formalin injection, most phospho-MSK1 (p-MSK1)-positive cells (87% ± 3%) expressed p-ERK and the majority of p-H3S10-positive cells (85% ± 5%) expressed p-MSK1. Inhibition of ERK activity with the MEK inhibitor SL327 reduced formalin-induced p-ERK, p-MSK1, and p-H3S10, demonstrating that spinal p-MSK1 and p-H3S10 were at least partly downstream of ERK signalling. Crucially, pharmacological blockade of spinal MSK1 activity with the novel MSK1 inhibitor SB727651A inhibited formalin-induced spinal p-H3S10 and nocifensive behaviour. These findings are the first to establish the involvement of p-H3S10 and its main kinase, MSK1, in ERK regulation of nociception. Given the general importance of ERK signalling in pain processing, our results suggest that p-H3S10 could play a role in the response to injury.


Conflict of interest statement

Sponsorships or competing interests that may be relevant to content are disclosed at the end of this article.

Figures
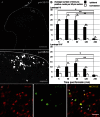
Figure 1.
Figure 1.
p-H3S10 rapidly increases in the ipsilateral dorsal horn after inflammation was induced through hind paw formalin injection and is expressed predominantly in neurons. (A) Representative images of nuclear p-H3S10 distribution within the L4 dorsal horn 30 minutes after formalin injection. White lines indicate border between gray and white matter. Low magnification: scale bar, 50 μm. High magnification: scale bar, 30 μm. (B) Ipsilateral and contralateral counts of p-H3S10 in laminae I and II and laminae III–V (n = 3 each time point, 5 sections per animal). Data show mean ± SEM (per 40 μm section). *P < 0.05; **P < 0.01; Bonferroni post hoc analysis for comparisons across ipsi sides and paired t test for comparison ipsi vs contra. (C) p-H3S10 (green) and NeuN (red) expression in formalin-stimulated animals. In the merge, yellow indicates colocalisation. Arrowheads indicate examples of colocalisation. Scale bar, 25 μm.
Figure 2.
Figure 2.
p-H3S10 expression occurs within neurons of the pain pathways. (A) Dorsal horn images of p-ERK (green) and p-H3S10 (red) double labelling in laminae I and II. In the merge, colocalisation is seen in yellow. Scale bar, 30 μm. (B) Dorsal horn images of c-Fos (green) and p-H3S10 (red) double labeling in formalin-stimulated animals. In the merge, colocalisation is seen in yellow. Scale bar, 50 μm. (C) Dorsal horn images of Zif268 (green) and p-H3S10 (red) double labeling. In the merge, colocalisation is seen in yellow. Scale bar, 50 μm. (A-D) White lines indicate medial border between lamina I and white matter; arrowheads indicate examples of colocalisation. All sections are 40 μm shown taken in a single focal plane in a formalin-stimulated animal. (D) Dorsal horn images of NK1R (green) and p-H3S10 (red) double labeling. The final image shows a merge of the first 2 images; NK1R is a cell-surface receptor and thus colocalisation is shown as NK1R surrounding the p-H3S10-labelled nucleus. Scale bar, 30 μm.
Figure 3.
Figure 3.
Depletion of spinal serotonin prevents the full expression of formalin-induced p-H3S10. (A) Typical dorsal horn image of 5-HT and p-H3S10 staining in animals receiving i.t. saline or i.t. (5,7-DHT), 30 minutes after formalin stimulation. Scale bar, 50 μm (upper), 30 μm (lower). (B) Counts of p-H3S10 nuclei in the ipsilateral and contralateral dorsal horn (n = 7 each group, 5 sections per animal). Data show group mean ± SEM (per 40-μm section). **P < 0.01.
Figure 4.
Figure 4.
Spinal extracellular signal-regulated kinase (ERK) regulates p-MSK1 and p-H3S10 expression after formalin injection. (A) Diagram of postulated signaling pathways upstream of p-H3S10. (B) Dorsal horn images of p-ERK and p-MSK1 in vehicle- and MEK inhibitor SL327-treated animals 30 minutes after formalin stimulation. (C) Dorsal horn images of p-ERK and p-H3S10 in vehicle- and MEK inhibitor SL327-treated animals 30 minutes after formalin stimulation. (D) Dorsal horn images of p-H3S10 and p-MSK1 in vehicle- and MEK inhibitor SL327-treated animals 30 minutes after formalin stimulation. (B-D): Pictures show a single focal plane. Final column images show a merge of the first 2 images; colocalisation is seen in yellow; arrowheads indicate examples of colocalisation. The white line indicates the medial border between lamina I and white matter. Scale bar, 50 μm. (E) Quantification of p-ERK, p-H3S10, and p-MSK1 single-labeled cells 30 minutes after formalin injection. n = 8 in each treatment group, 5 sections per animal. (F) Quantification of p-ERK, p-H3S10, and p-MSK1 double-labeled cells 30 minutes after formalin. n = 4 in each group. (E-F) Values presented as group mean ± SEM (per 40 μm section). *P < 0.05, **P < 0.01, ***P < 0.001, SL327-treated vs vehicle-treated animals.
Figure 5.
Figure 5.
Inhibition of MSK1 with SB747651A (10 μM) causes a reduction in formalin-induced p-H3S10 but has no effect on p-ERK and p-MSK1 expression. (A) Images of spinal p-H3S10 in vehicle- and SB747651A (10 μM)-treated animals, 1 hour after formalin injection. Scale bar, 100 μm; the white line indicates the medial border of lamina I and white matter. (B) Quantification of p-H3S10, p-ERK, and p-MSK1 in the dorsal horn of the vehicle or SB747651A (10 μM) formalin-treated animals (n = 8 in each group, 5 sections per animal). Values presented as group mean ± SEM (per 40 μm section).
Figure 6.
Figure 6.
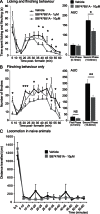
SB747651A (10 μM) attenuates nocifensive behaviour but does not impair motor function. (A) SB747651A (10 μM) attenuated the time spent licking and flinching during the second phase of the formalin response (35-60 minutes after formalin injection). AUC comparison indicated a 30% reduction of time spent licking/flinching in SB747651A (10 μM)-treated animals during the second phase (15-60 minutes) of the formalin response. N = 11 to 16. (B) SB747651A (10 μM) also reduced the formalin-induced number of flinches during the first and second phases of the formalin response. AUC comparison indicated a 43% reduction of flinch behaviour during the first phase (0-10 minutes) and 37% reduction during the second phase (15-60 minutes) in SB747651A (10 μM)-treated animals. N = 8 to 10. (C) There were no differences in the total distance travelled in the open-field paradigm between vehicle- and SB747651A (10 μM)-treated naive animals. (n = 3/4 in each group). (A-C). Mean ± SE mean. *P < 0.05, **P < 0.01; ***P < 0.001 between vehicle and 10 μM SB747651A.

References

    1. Alter BJ, Zhao C, Karim F, Landreth GE, Gereau RW., IV Genetic targeting of ERK1 suggests a predominant role for ERK2 in murine pain models. J Neurosci 2010;30:11537–47. - PMC - PubMed
    1. Atkins CM, Selcher JC, Petraitis JJ, Trzaskos JM, Sweatt JD. The MAPK cascade is required for mammalian associative learning. Nat Neurosci 1998;1:602–9. - PubMed
    1. Bai G, Wei D, Zou S, Ren K, Dubner R. Inhibition of class II histone deacetylases in the spinal cord attenuates inflammatory hyperalgesia. Mol Pain 2010;6:51. - PMC - PubMed
    1. Bannon AW, Malmberg AB. Models of nociception: hot-plate, tail-flick, and formalin tests in rodents. In: Crawley JN, Gerfen CR, Rogawski MA, Sibley DR, Skolnick P, Wray S, editors. Current protocols in neuroscience. Hoboken: John Wiley & Sons, Inc, 2007. - PubMed
    1. Borrelli E, Nestler EJ, Allis CD, Sassone-Corsi P. Decoding the epigenetic language of neuronal plasticity. Neuron 2008;60:961–74. - PMC - PubMed

Publication types

MeSH terms