
Local TNF causes NFATc1-dependent cholesterol-mediated podocyte injury

Christopher E Pedigo et al. J Clin Invest. .

Abstract

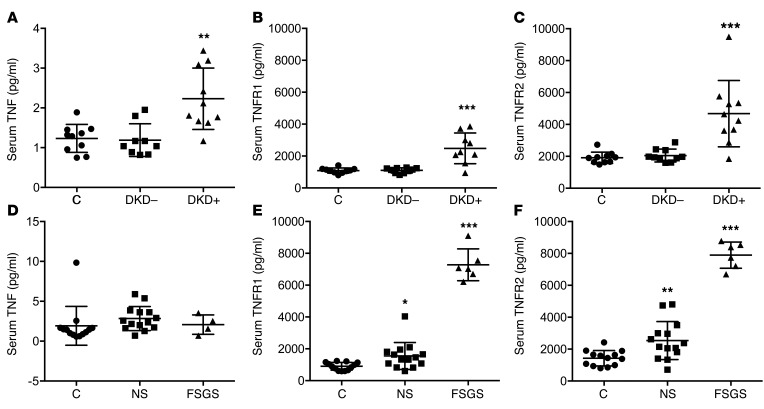
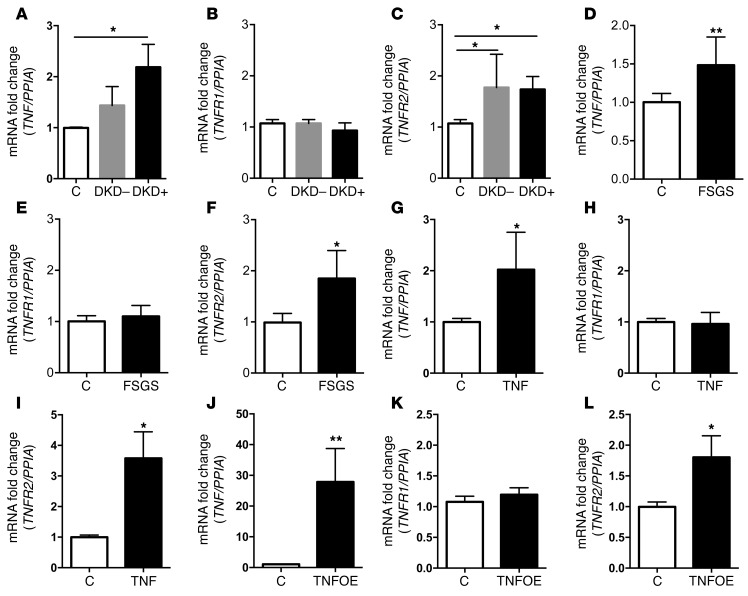
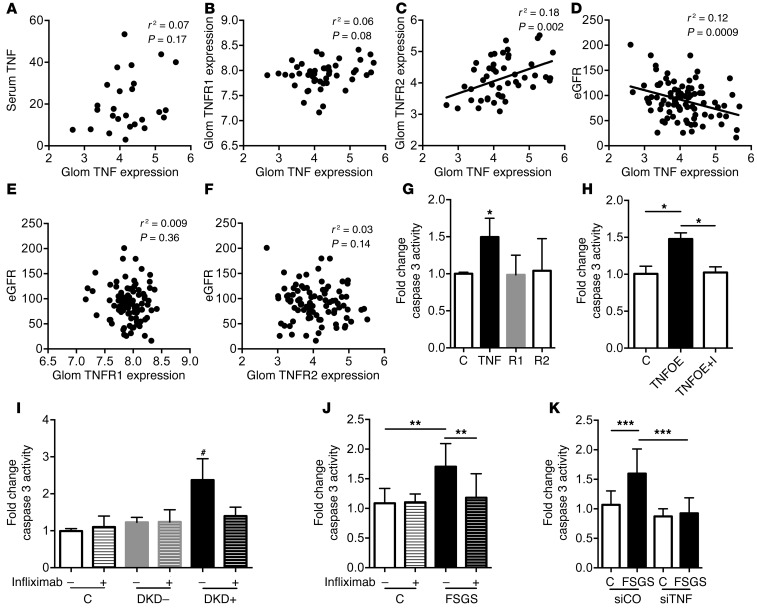
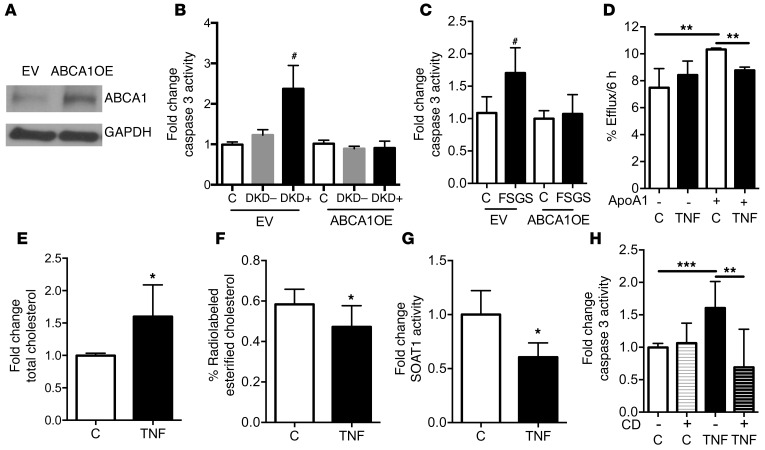
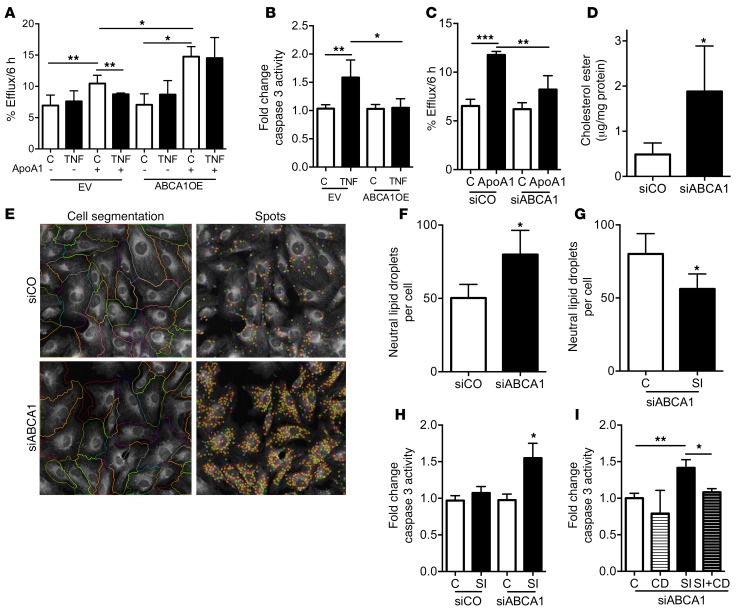
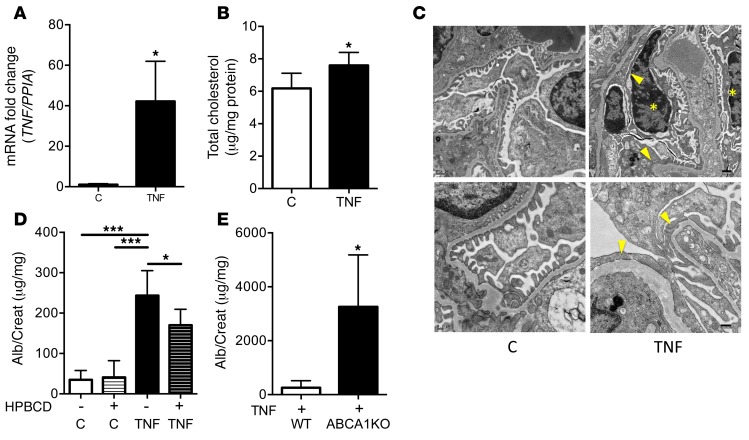
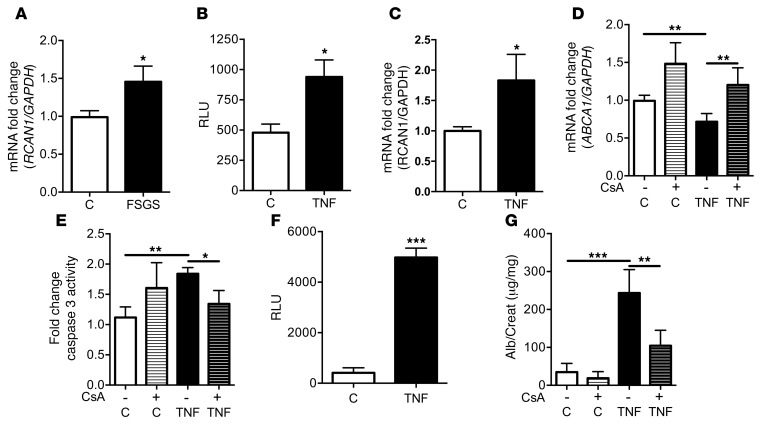
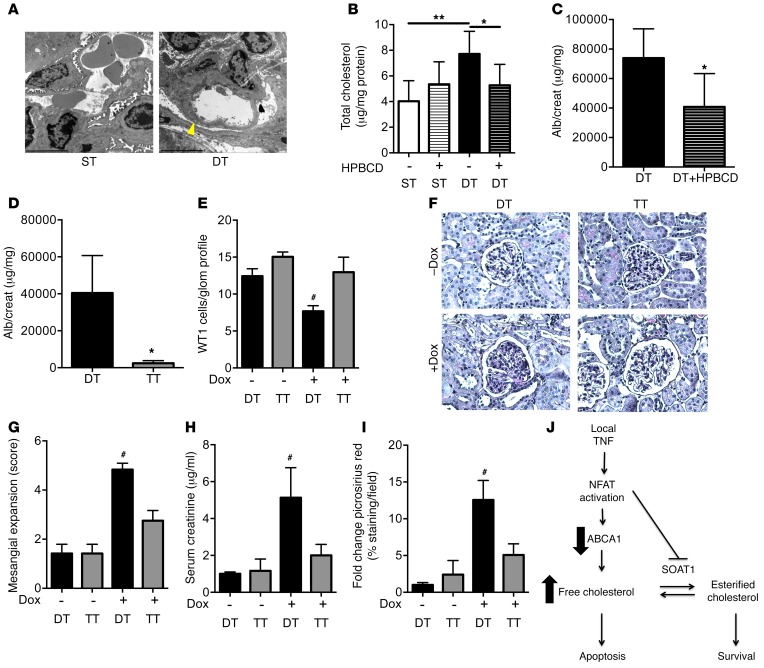
High levels of circulating TNF and its receptors, TNFR1 and TNFR2, predict the progression of diabetic kidney disease (DKD), but their contribution to organ damage in DKD remains largely unknown. Here, we investigated the function of local and systemic TNF in podocyte injury. We cultured human podocytes with sera collected from DKD patients, who displayed elevated TNF levels, and focal segmental glomerulosclerosis (FSGS) patients, whose TNF levels resembled those of healthy patients. Exogenous TNF administration or local TNF expression was equally sufficient to cause free cholesterol-dependent apoptosis in podocytes by acting through a dual mechanism that required a reduction in ATP-binding cassette transporter A1-mediated (ABCA1-mediated) cholesterol efflux and reduced cholesterol esterification by sterol-O-acyltransferase 1 (SOAT1). TNF-induced albuminuria was aggravated in mice with podocyte-specific ABCA1 deficiency and was partially prevented by cholesterol depletion with cyclodextrin. TNF-stimulated free cholesterol-dependent apoptosis in podocytes was mediated by nuclear factor of activated T cells 1 (NFATc1). ABCA1 overexpression or cholesterol depletion was sufficient to reduce albuminuria in mice with podocyte-specific NFATc1 activation. Our data implicate an NFATc1/ABCA1-dependent mechanism in which local TNF is sufficient to cause free cholesterol-dependent podocyte injury irrespective of TNF, TNFR1, or TNFR2 serum levels.


Figures

Figure 1
Figure 1. Serum TNF, TNFR1, and TNFR2 levels in patients with nephrotic syndrome, FSGS, and DKD.
(AC) ELISA-based quantification of serum TNF (A), TNFR1 (B), and TNFR2 (C) levels in 10 patients with diabetic kidney disease (DKD+), 10 patients with diabetes (DKD–), and 10 healthy patients (C). One-way ANOVA; **P < 0.01 DKD+ vs. C; ***P < 0.001 DKD+ vs. C. (DF) ELISA-based quantification of serum TNF (D), TNFR1 (E), and TNFR2 (F) levels in patients with biopsy-proven FSGS (FSGS, n = 6), patients with nephrotic syndrome (NS, n = 14), and healthy patients (C, n = 14). One-way ANOVA; *P < 0.05 NS vs. C; **P < 0.01 FSGS vs. C; ***P < 0.001 FSGS vs. C.
Figure 2
Figure 2. Analysis of podocyte TNF, TNFR1, and TNFR2 expression after treatment with serum from patients with FSGS or DKD, after exposure to TNF or after TNF overexpression.
(AC) Quantitative real-time (RT) PCR analysis of TNF (A), TNFR1 (B), and TNFR2 (C) expression in podocytes exposed to pooled sera from patients with diabetic kidney disease (DKD+) or diabetes (DKD–) and healthy controls (C) (n = 3). One-way ANOVA; *P < 0.05 DKD–, DKD+ vs. C. (DF) Quantitative RT-PCR analysis of TNF (D), TNFR1 (E), and TNFR2 (F) expression in podocytes exposed to sera from individual patients with FSGS (n = 6) and serum from healthy controls (C, n = 6). Two-tailed Student’s t test; *P < 0.05. **P < 0.01. (GI) Quantitative RT-PCR analysis of TNF (G), TNFR1 (H), and TNFR2 (I) expression in podocytes exposed to recombinant human TNF (n = 3). Two-tailed Student’s t test; *P < 0.05. (JL) Quantitative RT-PCR analysis of TNF (J), TNFR1 (K), and TNFR2 (L) expression in podocytes overexpressing TNF (TNFOE) compared with empty vector controls (C) (n = 3). Two-tailed Student’s t test; *P < 0.05, **P < 0.01.
Figure 3
Figure 3. Glomerular TNF expression correlates to eGFR and is sufficient to cause podocyte apoptosis.
(A) Serum TNF levels from patients with FSGS from the NEPTUNE cohort do not correlate with glomerular TNF expression in kidney biopsies as determined by microarray analysis. (BF) Microarray analysis of glomeruli from patients enrolled in the NEPTUNE cohort reveals that glomerular TNF expression does not correlate with TNFR1 expression (B), positively correlates with TNFR2 expression (C), and inversely correlates with eGFR (D). Neither TNFR1 expression (E) nor TNFR2 expression (F) correlates with eGFR. (G) Caspase 3 activity was measured in cultured human podocytes that were exposed to recombinant human TNF, TNFR1, or TNFR2. TNF but not TNFR1 or TNFR2 increased caspase 3 activity compared with untreated controls (C). One-way ANOVA; *P < 0.05. (H) TNF overexpression (TNFOE) in human podocytes causes increased cleaved caspase 3 activity compared with empty vector controls (C), which was prevented by the TNF inhibitor infliximab (I) (n = 4). One-way ANOVA; *P < 0.05. (I) Treatment of human podocytes with infliximab prevents DKD+ sera–induced cleaved caspase 3 activity (n = 4). One-way ANOVA; #P < 0.01 DKD+ without I vs. C, C with I, DKD–, DKD– with I, DKD+ with I. (J) Treatment of human podocytes with infliximab prevents FSGS sera–induced (n = 6) caspase 3 activity (n = 3). One-way ANOVA; **P < 0.01. (K) Knockdown of TNF (siTNF) prevents cleaved caspase 3 activity in podocytes exposed to serum from patients with FSGS (n = 7) compared with siCO-treated podocytes (n = 3). One-way ANOVA; ***P < 0.001.
Figure 4
Figure 4. ABCA1 overexpression is sufficient to protect from sera-induced podocyte injury, and TNF treatment alters human podocyte cholesterol homeostasis.
(A) Representative Western blot analysis showing that ABCA1-overexpressing (ABCA1OE) podocytes have increased ABCA1 protein compared with empty vector (EV) controls. GAPDH is the loading control. (B) Cleaved caspase 3 analysis in DKD patient sera–treated EV and ABCA1OE. One-way ANOVA; #P < 0.05 compared with all columns. (C) Cleaved caspase 3 analysis in FSGS patient sera–treated EV and ABCA1OE. One-way ANOVA; #P < 0.05 compared with all columns. (D) TNF treatment of cultured human podocytes results in significant reduction of ABCA1-mediated ApoA1-dependent cholesterol efflux compared with untreated controls (C) (n = 4). One-way ANOVA; **P < 0.01. (E) TNF treatment of cultured human podocytes leads to increased total cholesterol content compared with untreated controls (n = 3). Two-tailed Student’s t test; *P < 0.05. (F) TNF treatment of cultured human podocytes leads to reduced esterified cholesterol content compared with untreated controls (n = 4). Two-tailed Student’s t test; *P < 0.05. (G) TNF treatment of cultured human podocytes leads to reduced SOAT activity compared with untreated controls (n = 4). Two-tailed Student’s t test; *P < 0.05. (H) Pretreatment with CD prevents TNF-induced caspase 3 activity in cultured human podocytes compared with TNF-treated human podocytes (n = 5). One-way ANOVA; **P < 0.01, ***P < 0.001.
Figure 5
Figure 5. Reduced ABCA1-mediated cholesterol efflux and reduced SOAT1 activity cause free cholesterol–mediated podocyte apoptosis.
(A) Cholesterol efflux is increased in empty vector podocytes (EV) in the presence of ApoA1. TNF treatment of EV results in reduced ABCA1-mediated cholesterol efflux to ApoA1. ABCA1-overexpressing podocytes (ABCA1OE) have increased cholesterol efflux to ApoA1 compared with EV, which remains unaffected by TNF treatment (n = 3). One-way ANOVA; *P < 0.05, **P < 0.01, ***P < 0.001. (B) TNF treatment of ABCA1OE does not result in increased caspase 3 activity compared with TNF-treated EV controls (n = 4). One-way ANOVA; *P < 0.05, **P < 0.01. (C) siABCA1 podocytes have reduced cholesterol efflux to ApoA1 compared with siCO (n = 3). One-way ANOVA; **P < 0.01, ***P < 0.001. (D) siABCA1 podocytes have increased esterified cholesterol mass compared with siCO (n = 3). Two-tailed Student’s t test; *P < 0.05. (E) Representative confocal image (original magnification, ×20) using Opera HCS to analyze neutral lipid droplet staining (right panels) and cell segmentation (left panels) in siCO (top panels) and siABCA1 podocytes (bottom panels). (F) Bar graph of the quantitative lipid droplet analysis using Acapella demonstrating increased spots per cell in siABCA1 cells compared with controls (n = 5). Two-tailed Student’s t test; *P < 0.05. (G) Bar graph of the quantitative analysis demonstrating that siABCA1 podocytes treated with SOAT1 inhibitor (SI) have a reduced number of lipid droplet spots per cell (n = 4) when compared with untreated control (C). Two-tailed Student’s t test; *P < 0.05. (H) SI increases cleaved caspase 3 activity in siABCA1 but not siCO podocytes (n = 3). One-way ANOVA; *P < 0.05. (I) Pretreatment with CD prevented SI-induced caspase 3 activity in siABCA1 podocytes (n = 4). One-way ANOVA; *P < 0.05, **P < 0.01.
Figure 6
Figure 6. Injection of murine recombinant TNF causes cholesterol-mediated albuminuria.
(A) Glomerular TNF expression is significantly increased in BALB/cJ mice 6 hours after injection with murine recombinant TNF (TNF) compared with control mice (C) (n = 4 per group). Two-tailed Student’s t test; *P < 0.05. (B) Bar graph analysis of total cholesterol content in kidney cortexes of TNF-injected mice and in C mice (n = 6 per group). Two-tailed Student’s t test; *P < 0.05. (C) Transmission electron microscopy analysis of n = 3 mice per group treated with either vehicle (left panels) or TNF (right panels). TNF treatment resulted in segmental foot process effacement (arrowheads) compared with vehicle controls. Focally, podocytes and parietal epithelial cells undergoing apoptosis are detectable, as characterized by condensed chromatin and electron-dense cytoplasm (asterisks) with mitochondrial swelling. Scale bars: 0.5 μm in top panels, 0.2–0.25 μm in bottom panels. (D) The urinary albumin-to-creatinine ratio was significantly higher in TNF-injected mice compared with C mice 6 hours after injection. Pretreatment with HPBCD 24 hours before TNF administration significantly reduces albuminuria compared with TNF-treated mice (n = 6 per group). One-way ANOVA; *P < 0.05, ***P < 0.01. (E) The urinary albumin-to-creatinine ratio is significantly higher in podocyte-specific ABCA1-deficient mice treated with TNF (KO + TNF) compared with WT mice treated with TNF (WT + TNF) 6 hours after TNF administration (n = 4). Two-tailed Student’s t test; *P < 0.05.
Figure 7
Figure 7. TNF causes NFAT activation and NFAT-mediated ABCA1 repression leading to podocyte apoptosis.
(A) Quantitative RT-PCR analysis of regulator of calcineurin 1 (RCAN1) expression in podocytes exposed to sera from individual patients with FSGS (n = 6) and healthy patient (C) controls (n = 3). One-way ANOVA; *P < 0.05 vs. C. (B) TNF increases luciferase activity in mouse podocytes stably transfected with a cDNA coding for the luciferase gene under the control of an NFAT response element compared with untreated controls (n = 3). Two-tailed Student’s t test; *P < 0.05. (C) Quantitative RT-PCR analysis of RCAN1 expression in normal human podocytes exposed to TNF (n = 3) shows increased RCAN1 expression in TNF-treated podocytes (TNF) compared with untreated podocytes (C). Two-tailed Student’s t test; *P < 0.05. (D) Quantitative RT-PCR analysis of ABCA1 expression demonstrating that pretreatment of human podocytes for 1 hour with CsA and continued during TNF treatment (TNF + CsA) prevents TNF-mediated ABCA1 repression compared with TNF-treated cells (n = 4). One-way ANOVA; **P < 0.01. (E) Bar graph analysis showing that pretreatment with CsA and continued during TNF treatment prevents TNF-induced cleaved caspase 3 activity compared with TNF-treated cells (n = 4). One-way ANOVA; *P < 0.05, **P < 0.01. (F) Injection of murine recombinant TNF increases glomerular NFAT-mediated luciferase activity in an NFAT-luciferase reporter mouse model compared with vehicle-treated controls (C) 6 hours after injection (n = 4 per group). Two-tailed Student’s t test; ***P < 0.001. (G) The urinary albumin-to-creatinine ratio was significantly higher in TNF-injected BALB/cJ mice compared with C mice 6 hours after treatment. Pretreatment with CsA 24 hours before TNF administration significantly reduces albuminuria compared with TNF-treated mice (n = 5 per group). One-way ANOVA; **P < 0.01, ***P < 0.001.
Figure 8
Figure 8. ABCA1 overexpression or treatment with HPBCD can partially prevent NFAT-mediated albuminuria.
(A) Electron microscopy analysis of double-transgenic (DT) mice fed doxycycline chow for 4 days resulted in segmental foot process effacement (arrowhead) compared with single-transgenic controls (ST). Scale bars: 0.5 μm. (B) Total cholesterol content in kidney cortexes of DT and ST mice (n = 6 per group) treated with HPBCD or vehicle control. One-way ANOVA; *P < 0.05, **P < 0.01. (C) Urinary albumin-to-creatinine ratio in DT mice treated with HPBCD or vehicle before doxycycline chow feeding (n = 6 per group). Two-tailed Student’s t test; *P < 0.05. (D) Urinary albumin-to-creatinine ratio in triple transgenic (TT), inducible podocyte-specific constitutively active NFAT mice overexpressing ABCA1, compared with DT controls after 4 months of doxycycline chow feeding (n = 3 per group). Two-tailed Student’s t test; *P < 0.05. (E) Analysis of WT1 podocytes per glomerular profile in DT and TT mice fed control or doxycycline diet for 4 months (n = 3). One-way ANOVA; #P < 0.05 compared with all columns. (F) Representative periodic acid–Schiff (PAS) staining (original magnification, ×20) of kidney sections from DT and TT mice fed doxycycline or control diet for 4 months. (G) Mesangial expansion scores on PAS-stained kidney sections from DT and TT mice fed doxycycline or control diet for 4 months (n = 3 per group) as assessed by 2 blinded, independent investigators. One-way ANOVA; #P < 0.05 compared with all columns. (H) Bar graph analysis of serum creatinine levels from DT and TT mice fed doxycycline or control diet for 4 months (n = 3 per group). One-way ANOVA; #P < 0.05 compared with all columns. (I) Bar graph analysis of picrosirius red–stained kidney sections from DT and TT mice fed doxycycline or normal diet (n = 3 per group). One-way ANOVA; #P < 0.05 compared with all columns. (J) Model of proposed mechanism of local TNF–induced podocyte injury in FSGS and DKD.

References

    1. Scott DL, Kingsley GH. Tumor necrosis factor inhibitors for rheumatoid arthritis. N Engl J Med. 2006;355(7):704–712. doi: 10.1056/NEJMct055183. - DOI - PubMed
    1. Selmaj K, Raine CS, Cannella B, Brosnan CF. Identification of lymphotoxin and tumor necrosis factor in multiple sclerosis lesions. J Clin Invest. 1991;87(3):949–954. doi: 10.1172/JCI115102. - DOI - PMC - PubMed
    1. McKellar GE, McCarey DW, Sattar N, McInnes IB. Role for TNF in atherosclerosis? Lessons from autoimmune disease. Nat Rev Cardiol. 2009;6(6):410–417. doi: 10.1038/nrcardio.2009.57. - DOI - PubMed
    1. Vincent FB, Morand EF, Murphy K, Mackay F, Mariette X, Marcelli C. Antidrug antibodies (ADAb) to tumour necrosis factor (TNF)-specific neutralising agents in chronic inflammatory diseases: a real issue, a clinical perspective. Ann Rheum Dis. 2013;72(2):165–178. doi: 10.1136/annrheumdis-2012-202545. - DOI - PubMed
    1. Johnson AM, Olefsky JM. The origins and drivers of insulin resistance. Cell. 2013;152(4):673–684. doi: 10.1016/j.cell.2013.01.041. - DOI - PubMed

Publication types

MeSH terms