Meta-Analysis
. 2016 Jul 28;8(8):455.
doi: 10.3390/nu8080455.

Dietary Interventions and Changes in Cardio-Metabolic Parameters in Metabolically Healthy Obese Subjects: A Systematic Review with Meta-Analysis

Affiliations
Meta-Analysis

Dietary Interventions and Changes in Cardio-Metabolic Parameters in Metabolically Healthy Obese Subjects: A Systematic Review with Meta-Analysis

Marta Stelmach-Mardas et al. Nutrients. .

Abstract

The aim of this systematic review was to assess the effect of diet on changes in parameters describing the body size phenotype of metabolically healthy obese subjects. The databases Medline, Scopus, Web of Knowledge and Embase were searched for clinical studies carried out between 1958 and June 2016 that reported the effect of dietary intervention on BMI, blood pressure, concentration of fasting triglyceride (TG), high density lipoprotein cholesterol (HDL-C), fasting glucose level, the homoeostatic model assessment of insulin resistance (HOMA-IR) and high sensitivity C-Reactive Protein (hsCRP) in metabolically healthy, obese subjects. Twelve clinical studies met inclusion criteria. The combined analyzed population consists of 1827 subjects aged 34.4 to 61.1 with a BMI > 30 kg/m². Time of intervention ranged from eight to 104 weeks. The baseline characteristics related to lipid profile were more favorable for metabolically healthy obese than for metabolically unhealthy obese. The meta-analyses revealed a significant associations between restricted energy diet and BMI (95% confidence interval (CI): -0.88, -0.19), blood pressure (systolic blood pressure (SBP): -4.73 mmHg; 95% CI: -7.12, -2.33; and diastolic blood pressure (DBP): -2.75 mmHg; 95% CI: -4.30, -1.21) and TG (-0.11 mmol/l; 95% CI: -0.16, -0.06). Changes in fasting glucose, HOMA-IR and hsCRP did not show significant changes. Sufficient evidence was not found to support the use of specific diets in metabolically healthy obese subjects. This analysis suggests that the effect of caloric restriction exerts its effects through a reduction in BMI, blood pressure and triglycerides in metabolically healthy obese (MHO) patients.

Keywords: biomarkers; diet; metabolically healthy obese.


Figures

Figure 1
Figure 1
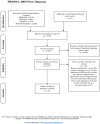
Process flow sheet.
Figure 2
Figure 2
Process of literature search on the association between diet and selected cardio-metabolic parameters in metabolically healthy obese.
Figure 3
Figure 3
Forest plot of the random-effects meta-analysis of changes in BMI according to reduction in energy intake shown as polled standard differences in the means with 95% Cis and in randomized and non-randomized trials. * For each study, the square represents the point estimate of the intervention effect. Horizontal lines join the lower and upper limits of the 95% CI of this effect. The area of shaded squares reflects the relative weight of the study in the meta-analysis. Diamonds represent the subgroup mean difference and pooled mean differences. CI indicates confidence interval.
Figure 4
Figure 4
Forest plot of the random-effects meta-analysis of changes in Systolic and Diastolic Blood Pressure according to reduction in energy intake shown as polled standard differences in the means with 95% Cis and in randomized and non-randomized trials. * For each study, the square represents the point estimate of the intervention effect. Horizontal lines join the lower and upper limits of the 95% CI of this effect. The area of shaded squares reflects the relative weight of the study in the meta-analysis. Diamonds represent the subgroup mean difference and pooled mean differences. CI indicates confidence interval.
Figure 5
Figure 5
Forest plot of the random-effects meta-analysis of changes in Triglycerides and HDL-cholesterol according to reduction in energy intake shown as polled standard differences in the means with 95% Cis and in randomized and non-randomized trials. * For each study, the square represents the point estimate of the intervention effect. Horizontal lines join the lower and upper limits of the 95% CI of this effect. The area of shaded squares reflects the relative weight of the study in the meta-analysis. Diamonds represent the subgroup mean difference and pooled mean differences. CI indicates confidence interval.
Figure 6
Figure 6
Forest plot of the random-effects meta-analysis of changes in Fasting Glucose and HOMA-IR according to reduction in energy intake shown as polled standard differences in the means with 95% Cis and in randomized and non-randomized trials. * For each study, the square represents the point estimate of the intervention effect. Horizontal lines join the lower and upper limits of the 95% CI of this effect. The area of shaded squares reflects the relative weight of the study in the meta-analysis. Diamonds represent the subgroup mean difference and pooled mean differences. CI indicates confidence interval.
Figure 7
Figure 7
Forest plot of the random-effects meta-analysis of changes in high sensitivity C-Reactive Protein according to reduction in energy intake shown as polled standard differences in the means with 95% Cis and in randomized and non-randomized trials. * For each study, the square represents the point estimate of the intervention effect. Horizontal lines join the lower and upper limits of the 95% CI of this effect. The area of shaded squares reflects the relative weight of the study in the meta-analysis. Diamonds represent the subgroup mean difference and pooled mean differences. CI indicates confidence interval.

References

    1. Kelly T., Yang W., Chen C.S., Reynolds K., He J. Global burden of obesity in 2005 and projections to 2030. Int. J. Obes. 2008;32:1431–1437. doi: 10.1038/ijo.2008.102. - DOI - PubMed
    1. Flegal K.M., Kit B.K., Orpana H., Graubard B.I. Association of all-cause mortality with overweight and obesity using standard body mass index categories: A systematic review and meta-analysis. JAMA. 2013;309:71–82. doi: 10.1001/jama.2012.113905. - DOI - PMC - PubMed
    1. Ruderman N.B., Schneider S.H., Berchtold P. The “metabolically obese”, normal-weight individual. Am. J. Clin. Nutr. 1981;34:1617–1621. doi: 10.2337/diabetes.47.5.699. - DOI - PubMed
    1. Wildman R.P., Muntner P., Reynolds K., McGinn A.P., Rajpathak S., Wylie-Rosett J., Sowers M.R. The obese without cardiometabolic risk factor clustering and the normal weight with cardiometabolic risk factor clustering: Prevalence and correlates of 2 phenotypes among the US population (NHANES 1999–2004) Arch. Intern. Med. 2008;168:1617–1624. doi: 10.1001/archinte.168.15.1617. - DOI - PubMed
    1. Meigs J.B., Wilson P.W., Fox C.S., Vasan R.S., Nathan D.M., Sullivan L.M., D’Agostino R.B. Body mass index, metabolic syndrome, and risk of type 2 diabetes or cardiovascular disease. J. Clin. Endocrinol. Metab. 2006;91:2906–2912. doi: 10.1210/jc.2006-0594. - DOI - PubMed