. 2016 Sep;14(3):2555-65.
doi: 10.3892/mmr.2016.5584. Epub 2016 Aug 1.

Analysis of different components in the peritumoral tissue microenvironment of colorectal cancer: A potential prospect in tumorigenesis

Affiliations

Analysis of different components in the peritumoral tissue microenvironment of colorectal cancer: A potential prospect in tumorigenesis

Chao Huang et al. Mol Med Rep. 2016 Sep.

Erratum in

Abstract

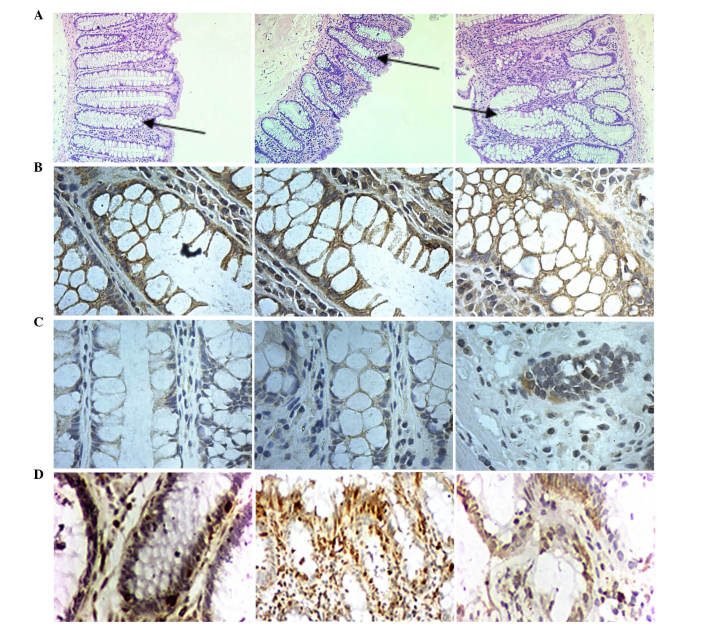
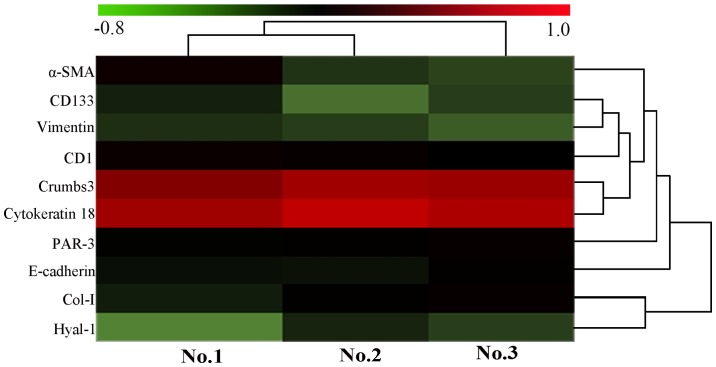
The present study aimed to observe the varying expression of biomarkers in the microenvironment adjacent to colorectal cancer lesions to provide additional insight into the functions of microenvironment components in carcinogenesis and present a novel or improved indicator for early diagnosis of cancer. A total of 144 human samples from three different locations in 48 patients were collected, these locations were 10, 5 and 2 cm from the colorectal cancer lesion, respectively. The biomarkers analyzed included E‑cadherin, cytokeratin 18 (CK18), hyaluronidase‑1 (Hyal‑1), collagen type I (Col‑I), Crumbs3 (CRB3), vimentin, proteinase activated receptor 3 (PAR‑3), α‑smooth muscle actin (α‑SMA), cyclin D1 (CD1) and cluster of differentiation (CD)133. In addition, crypt architecture was observed. Related functional analysis of proteins was performed using hierarchical index cluster analysis. More severe destroyed crypt architecture closer to the cancer lesions was observed compared with the 10 cm sites, with certain crypts degraded entirely. Expression levels of E‑cadherin, CK18, CRB3 and PAR‑3 were lower in 2 cm sites compared with the 10 cm sites (all P<0.001), while the expression levels of the other biomarkers in the 2 cm sites were increased compared with 10 cm sites (all P<0.0001). Notably, the expression of CK18 in 2 cm sites was higher than in the 5 cm site (P<0.0001), which was different from the expression of E‑cadherin, CRB3 and PAR‑3. The expression levels of Hyal‑1 and Col‑I at the 2 cm sites were lower than that of the 5 cm sites (P>0.05 and P=0.0001, respectively), while the expression of vimentin, α‑SMA, CD1 and CD133 were not. Hyal‑1 and Col‑I may be independently important in cancer initiation in the tumor microenvironment. The results of the present study suggest that the biomarkers in the tissue microenvironment are associated with early tumorigenesis and may contribute to the development of carcinomas. These observations may be useful for early diagnosis of colorectal cancer.


Figures

Figure 1
Figure 1
Sampling methods in the present study. Samples No. 1, No. 2 and No. 3 were ≧10 cm, 5 cm and ≦2 cm from the proximal location of the colorectal cancer lesion, respectively).
Figure 2
Figure 2
Staining of crypt structures. (A) Hematoxylin and eosin staining of samples no. 1, 2 and 3 (left to right). Arrows indicate the locations of aberrant crypt foci. Protein expression levels of (B) E-cadherin, (C) Crumbs3 and (D) proteinase activated receptor 3 demonstrated by immunohistochemical staining in samples no. 1, 2 and 3 (left to right).
Figure 3
Figure 3
Expression levels of CD1, CD133, CK18, α-SMA and vimentin indicated by immunohistochemical staining. Expression levels of (A) CD1, (B) CD133, (C) CK18, (D) α-SMA and (E) vimentin, in samples no. 1, 2 and 3 (left to right). CD1, cyclin D1; CD133, cluster of differentiation 133; CK18, cytokeratin 18; α-SMA, α-smooth muscle actin.
Figure 4
Figure 4
Expression of Col-I and Hyal-1 in three locations as demonstrated by immunohistochemical staining. Expression levels of (A) Col-I, (B) Hyal-1 in samples no. 1, 2 and 3 (left to right), and (C) negative staining in three locations as a negative control. Col-I, collagen type I; Hyal-1, hyaluronidase 1.
Figure 5
Figure 5
CCA value of ten biomarkers in samples No. 1, No. 2 and No. 3. Demonstrated by the CCA value, the expression levels of E-cadherin, CK18, Crumbs-3 and Par-3 in sample No. 3 were lower compared with sample No. 1 (P<0.05). The expression of CK18 in sample No. 2 was lower than in sample No. 3 (P<0.0001). The expression levels of Hyal-1, Col-I, vimentin, CD1, CD133 and α-SMA in sample No. 3 were higher than in sample No. 1 (P<0.05), however, the expression levels of Hyal-1, Col-I, α-SMA in sample No. 3 were lower than that in sample No. 2, the result for Hyal-1 was not significant. CCA, corrected absorbance value; CK18, cytokeratin 18; Par-3, proteinase activated receptor 3; Hyal-1, hyaluronidase 1; Col-I, collagen type I; CD1, cyclin D1; CD133, cluster of differentiation 133; α-SMA, α-smooth muscle actin.
Figure 6
Figure 6
Heatmap of biomarker expression in the present study according to the CCA value of samples No. 1, No. 2 and No. 3. The heatmap diagram indicates the result of the two-way hierarchical clustering of markers and samples. Each row represents a marker and each column represents a sample. The marker clustering tree is presented on the right, and the sample clustering tree at the top. Cluster analysis arranges samples and markers into groups based on their CCA values, which allows formation of hypotheses regarding the association between markers and samples. The color of each pattern indicates the CCA value, green to red is −0.8 to 1.0. CCA, corrected absorbance value; α-SMA, α-smooth muscle actin; CD1, cyclin D1; CD133, cluster of differentiation 133; PAR-3, proteinase activated receptor 3; Col-I, collagen type I; Hyal-1, hyaluronidase 1.

Similar articles

Cited by

References

    1. Brücher BL, Jamall IS. Epistemology of the origin of cancer: A new paradigm. BMC Cancer. 2014;14:331. doi: 10.1186/1471-2407-14-331. - DOI - PMC - PubMed
    1. Paget S. The distribution of secondary growths in cancer of the breast 1889. Cancer Metastasis Rev. 1989;8:98–101. - PubMed
    1. Korkaya H, Liu S, Wicha MS. Breast cancer stem cells, cytokine networks, and the tumor microenvironment. J Clin Invest. 2011;121:3804–3809. doi: 10.1172/JCI57099. - DOI - PMC - PubMed
    1. Felsher DW. Cancer revoked: Oncogenes as therapeutic targets. Nat Rev Cancer. 2003;3:375–380. doi: 10.1038/nrc1070. - DOI - PubMed
    1. Li R, Pendergast AM. Arg kinase regulates epithelial cell polarity by targeting β1-integrin and small GTPase pathways. Curr Biol. 2011;21:1534–1542. doi: 10.1016/j.cub.2011.08.023. - DOI - PMC - PubMed