. 2016 Sep 30;291(40):20993-21007.
doi: 10.1074/jbc.M116.736942. Epub 2016 Aug 2.

Ligand-induced Epitope Masking: DISSOCIATION OF INTEGRIN α5β1-FIBRONECTIN COMPLEXES ONLY BY MONOCLONAL ANTIBODIES WITH AN ALLOSTERIC MODE OF ACTION

Affiliations

Ligand-induced Epitope Masking: DISSOCIATION OF INTEGRIN α5β1-FIBRONECTIN COMPLEXES ONLY BY MONOCLONAL ANTIBODIES WITH AN ALLOSTERIC MODE OF ACTION

A Paul Mould et al. J Biol Chem. .

Abstract

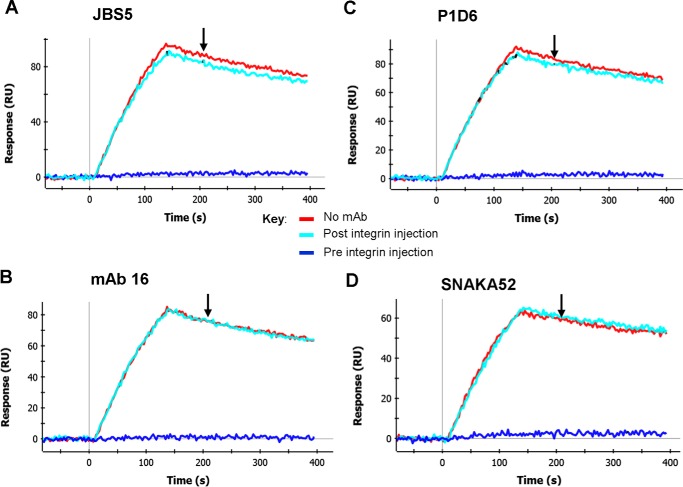
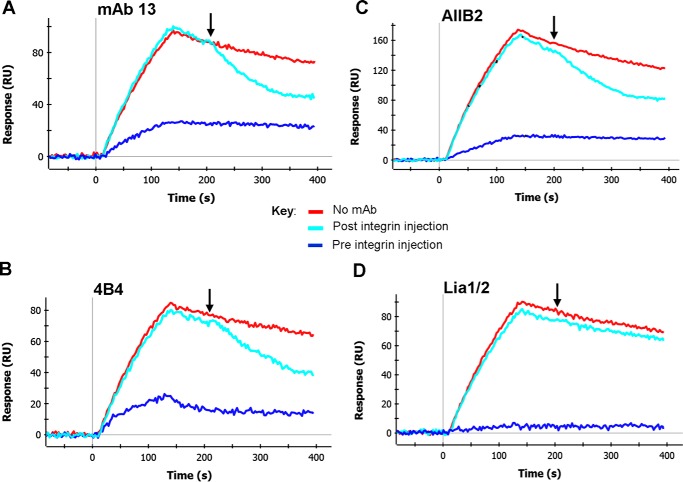
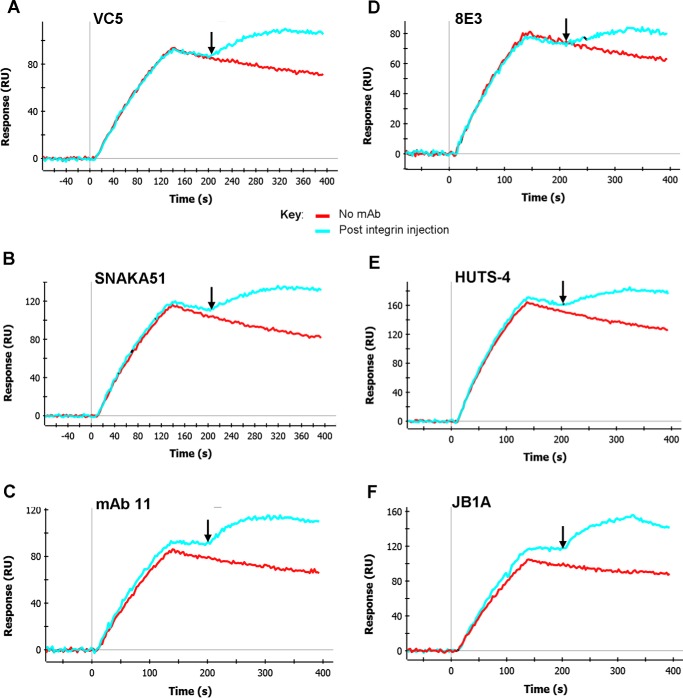
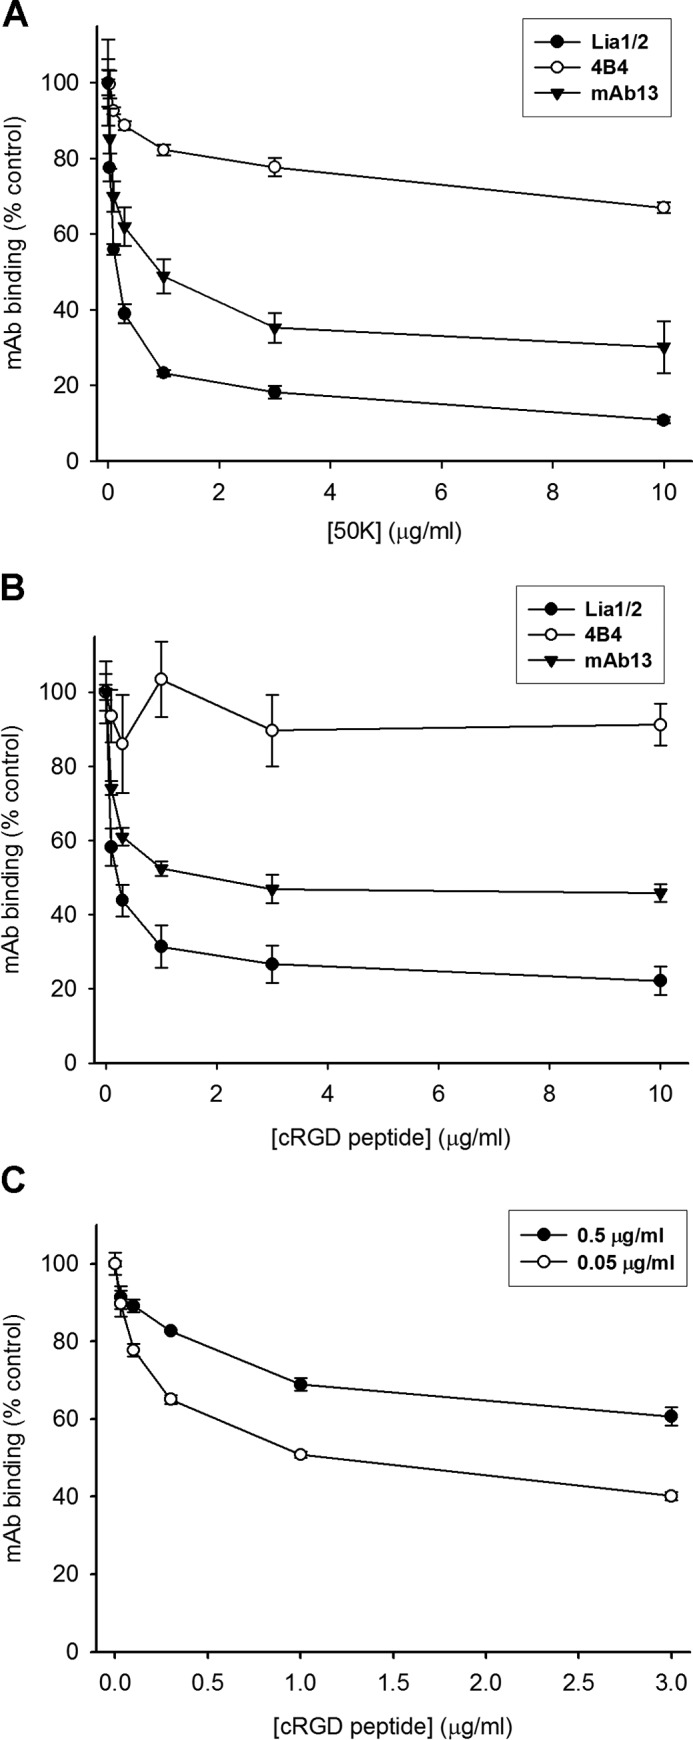
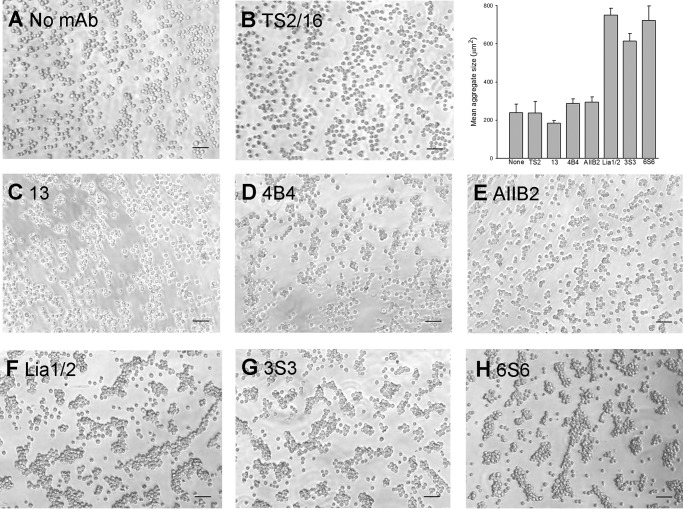
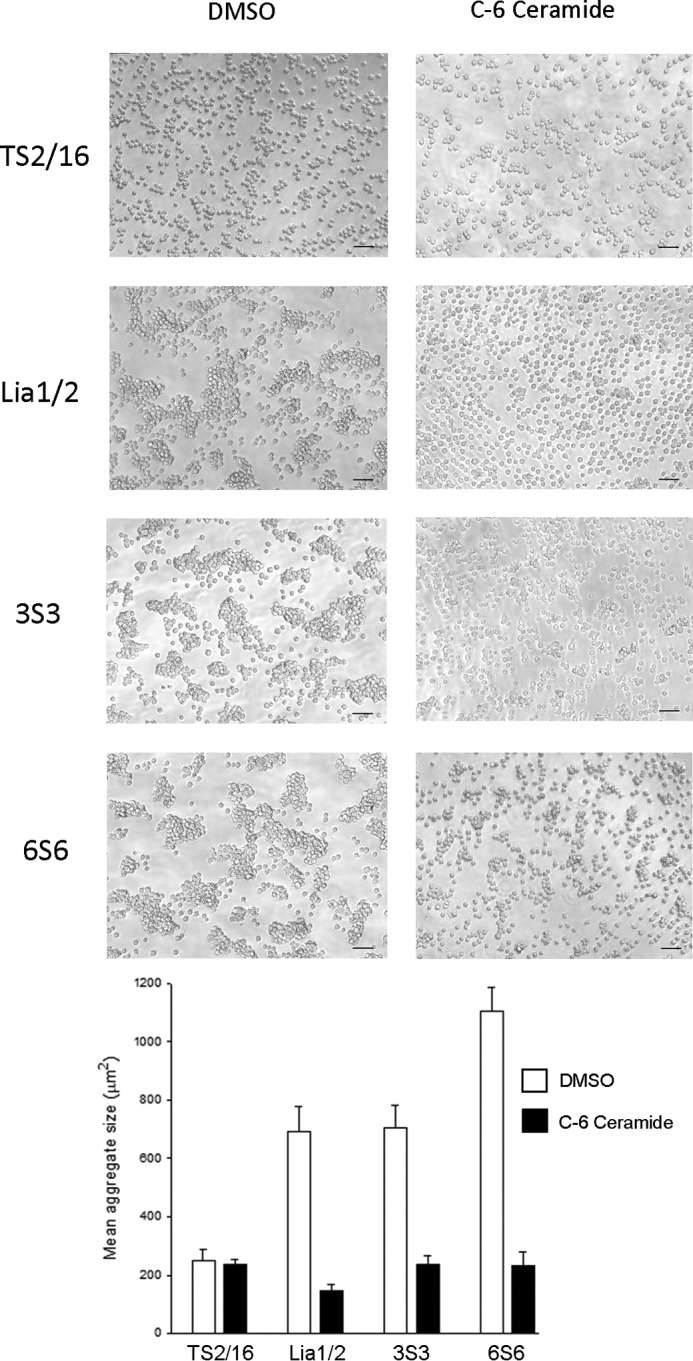
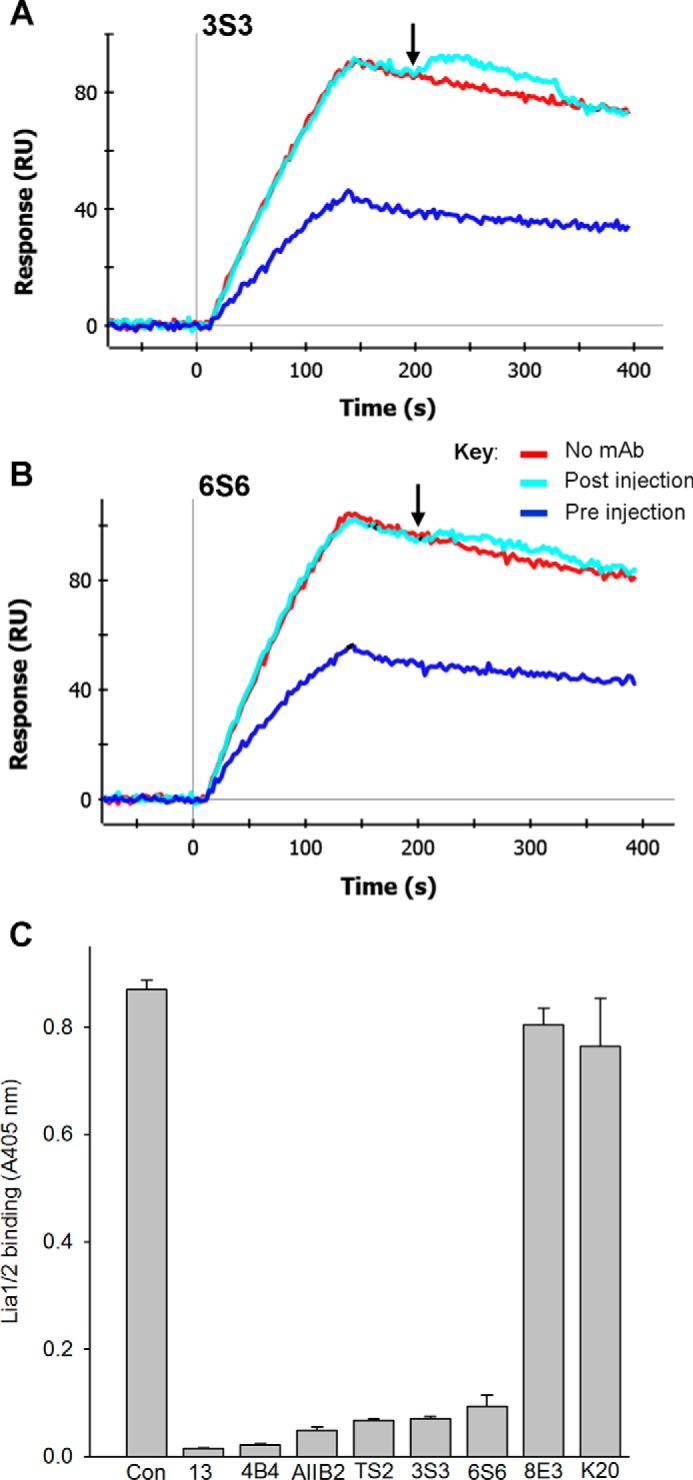
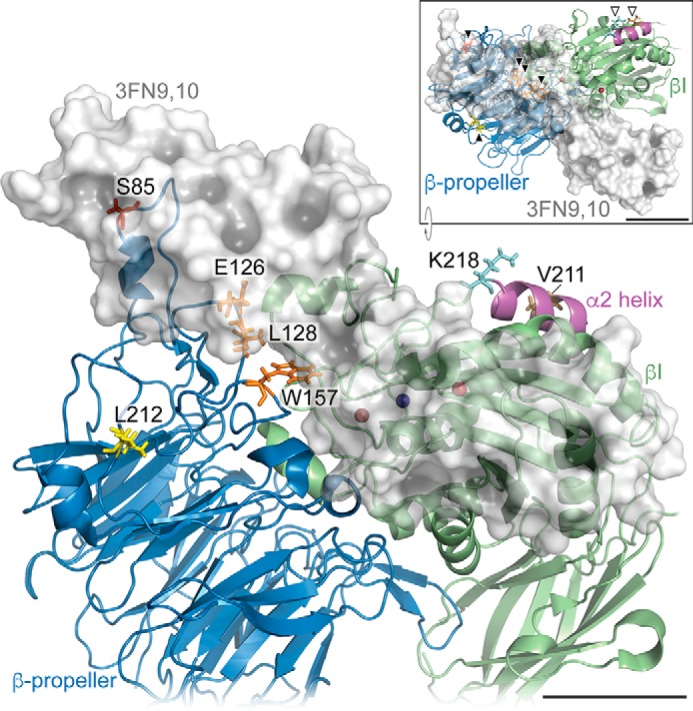
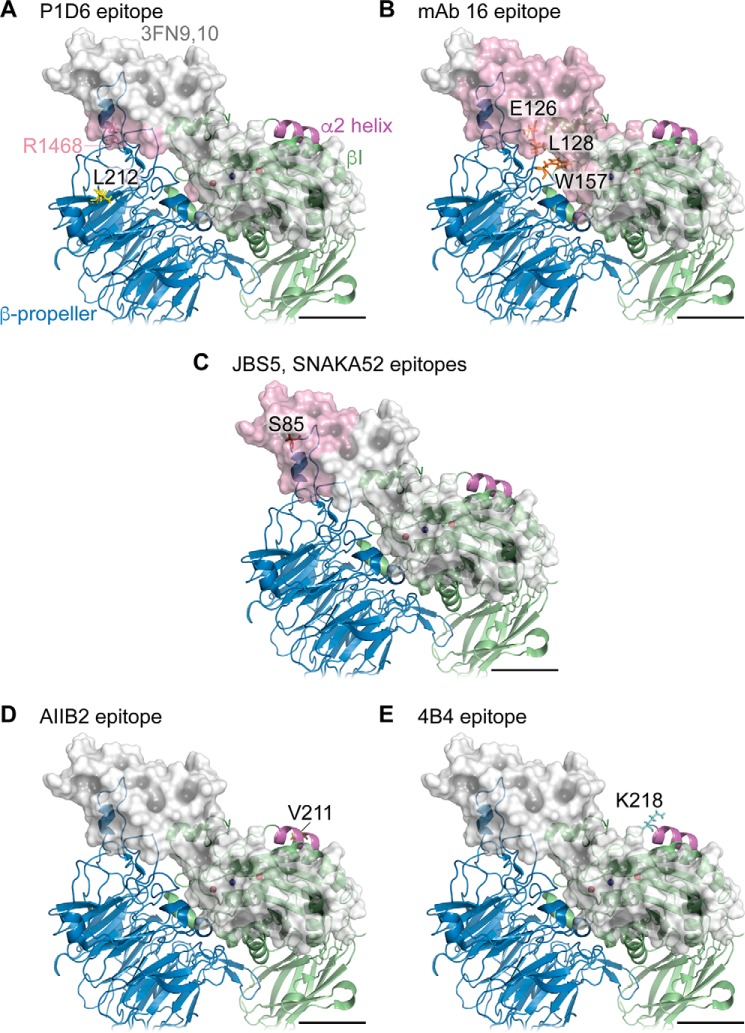
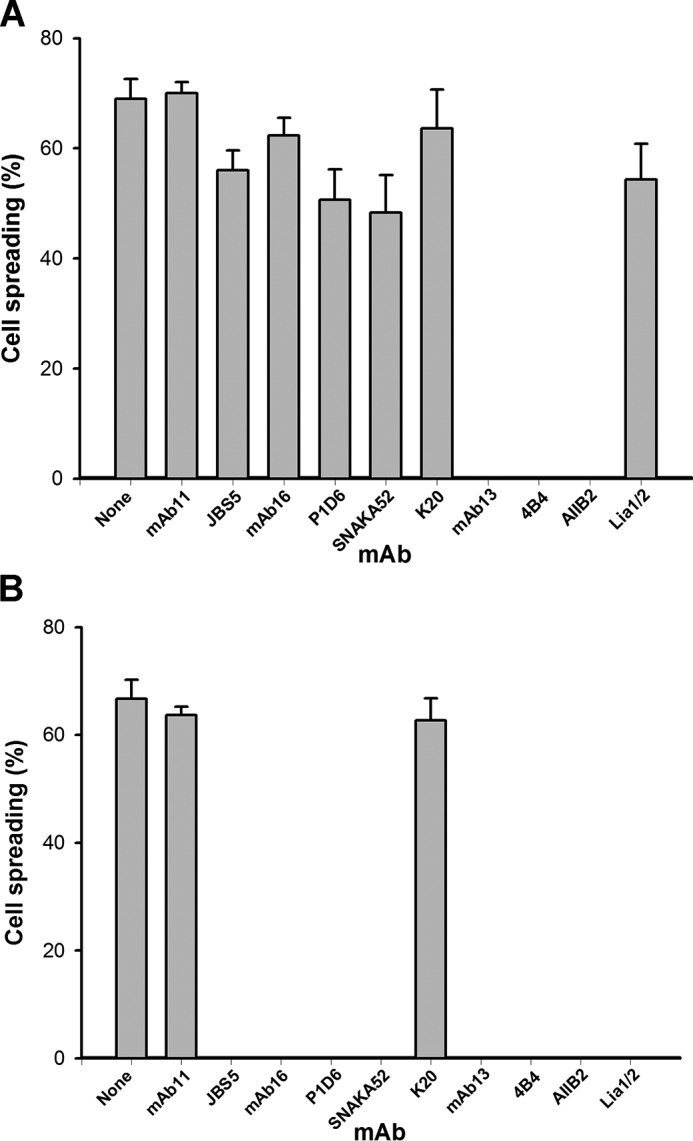
We previously demonstrated that Arg-Gly-Asp (RGD)-containing ligand-mimetic inhibitors of integrins are unable to dissociate pre-formed integrin-fibronectin complexes (IFCs). These observations suggested that amino acid residues involved in integrin-fibronectin binding become obscured in the ligand-occupied state. Because the epitopes of some function-blocking anti-integrin monoclonal antibodies (mAbs) lie near the ligand-binding pocket, it follows that the epitopes of these mAbs may become shielded in the ligand-occupied state. Here, we tested whether function-blocking mAbs directed against α5β1 can interact with the integrin after it forms a complex with an RGD-containing fragment of fibronectin. We showed that the anti-α5 subunit mAbs JBS5, SNAKA52, 16, and P1D6 failed to disrupt IFCs and hence appeared unable to bind to the ligand-occupied state. In contrast, the allosteric anti-β1 subunit mAbs 13, 4B4, and AIIB2 could dissociate IFCs and therefore were able to interact with the ligand-bound state. However, another class of function-blocking anti-β1 mAbs, exemplified by Lia1/2, could not disrupt IFCs. This second class of mAbs was also distinguished from 13, 4B4, and AIIB2 by their ability to induce homotypic cell aggregation. Although the epitope of Lia1/2 was closely overlapping with those of 13, 4B4, and AIIB2, it appeared to lie closer to the ligand-binding pocket. A new model of the α5β1-fibronectin complex supports our hypothesis that the epitopes of mAbs that fail to bind to the ligand-occupied state lie within, or very close to, the integrin-fibronectin interface. Importantly, our findings imply that the efficacy of some therapeutic anti-integrin mAbs could be limited by epitope masking.

Keywords: allosteric regulation; antibody; cell adhesion; epitope masking; fibronectin; integrin; therapeutics.


Figures

FIGURE 1.
FIGURE 1.
SDS-PAGE of the recombinant integrin and fibronectin fragments used in these experiments. Samples were run on a 4–12% gel under reducing conditions. Lane 1, α5β1-Fc; lane 2, biotinylated 50K; lane 3, biotinylated 50K-KGE. Positions of molecular mass markers (kDa) are shown. A band in the α5β1-Fc sample running just below the 50-kDa marker probably corresponds to a partial cleavage product of the α5 light chain-Fc subunit (α5-Fc).
FIGURE 2.
FIGURE 2.
Effect of function-blocking anti-α5 mAbs on integrin-fibronectin complexes. A–D, binding of α5β1-Fc to 50K fibronectin fragment took place for 120 s in three parallel channels in RB. In the blue sensorgrams, integrin was pre-mixed with 100 nm of the indicated anti-α5 mAb. 60 s after the start of the dissociation phase, at the time indicated by the downward-pointing arrow (∼207 s), either RB alone (red and blue sensorgrams) or RB with 100 nm mAb (cyan sensorgrams) was injected for 120 s. A, dissociation rate in buffer alone was 9.73 × 10⁻⁴ s−1 and in the presence of JBS5 was 8.98 × 10⁻⁴ s−1. B, dissociation rate in buffer alone was 9.75 × 10⁻⁴ s−1 and in the presence of mAb was 16 9.87 × 10⁻⁴ s−1. C, dissociation rate in buffer alone was 9.70 × 10⁻⁴ s−1 and in the presence of P1D6 was 9.24 × 10⁻⁴ s−1. D, dissociation rate in buffer alone was 7.93 × 10⁻⁴ s−1 and in the presence of SNAKA52 6.44 × 10⁻⁴ s−1. Dissociation rates were measured between 208 and 330 s. Similar results were obtained in three separate experiments.
FIGURE 3.
FIGURE 3.
Effect of function-blocking anti-β1 mAbs on integrin-fibronectin complexes. A–D, binding of α5β1-Fc to 50K fibronectin fragment took place for 120 s in three parallel channels in RB. In the blue sensorgrams, integrin was pre-mixed with 100 nm of the indicated anti-β1 mAb. 60 s after the start of the dissociation phase, at the time indicated by the downward-pointing arrow (∼207 s), either RB alone (red and blue sensorgrams) or RB with 100 nm mAb (cyan sensorgrams) was injected for 120 s. Dissociation rates were measured during the buffer or mAb injection step (208–228 s). A, dissociation rate in buffer alone was 1.11 × 10⁻³ s−1 and in the presence of mAb 13 was 4.98 × 10⁻³ s−1. B, dissociation rate in buffer alone was 1.01 × 10⁻³ s−1 and in the presence of 4B4 was 4.04 × 10⁻³ s−1. C, dissociation rate in buffer alone was 1.37 × 10⁻³ s−1 and in the presence of AIIB2 was 4.31 × 10⁻³ s−1. D, dissociation rate in buffer alone was 0.91 × 10⁻³ s−1 and in the presence of Lia1/2 was 1.05 × 10⁻³ s−1. Similar results were obtained in three separate experiments.
FIGURE 4.
FIGURE 4.
Effect of non-function-blocking anti-α5 and anti-β1 mAbs on integrin-fibronectin complexes. A–F, binding of α5β1-Fc to 50K fibronectin fragment took place for 120 s in three parallel channels in RB. In the blue sensorgrams, integrin was pre-mixed with 100 nm of the indicated anti-α5 mAb (A–C) or anti-β1 mAb (D–F). 60 s after the start of the dissociation phase, at the time indicated by the downward-pointing arrow (∼207 s), either RB alone (red and blue sensorgrams) or RB with 100 nm mAb (cyan sensorgrams) was injected for 120 s. Dissociation rates were measured after the end of the buffer or mAb inject step (330–390 s) for α5β1-fibronectin complexes (red sensorgrams) or mAb-α5β1-fibronectin complexes (cyan sensorgrams). A, dissociation rates were 8.75 × 10⁻⁴ and 3.59 × 10⁻⁴ s−1, respectively. B, dissociation rates were 11.3 × 10⁻⁴ and 3.26 × 10⁻⁴ s−1, respectively. C, dissociation rates were 8.47 × 10⁻⁴ and 4.47 × 10⁻⁴ s−1, respectively. D, dissociation rates were 7.55 × 10⁻⁴ and 4.33 × 10⁻⁴ s−1, respectively. E, dissociation rates were 8.10 × 10⁻⁴ and 3.28 × 10⁻⁴ s−1, respectively. F, dissociation rates were 6.73 × 10⁻⁴ and 12.9 × 10⁻⁴ s−1, respectively. Similar results were obtained in three separate experiments.
FIGURE 5.
FIGURE 5.
Effect of 50K fibronectin fragment and cyclic RGD peptide on Lia1/2 binding to α5β1. A and B, ability of 50K (A) or cyclic RGD peptide (B) to inhibit binding of Lia1/2 (closed circles) to α5β1 was tested in a solid-phase assay, in parallel with mAbs 13 (closed triangles) and 4B4 (open circles). C, test of competitive inhibition by cRGD peptide on Lia1/2 binding to α5β1. The effect of cRGD was tested at 10-fold different concentrations of Lia1/2 (0.05 and 0.5 μg/ml; open and closed circles, respectively). In this experiment, the concentration of cRGD for half-maximal inhibition of Lia1/2 binding was estimated by non-linear regression analysis to be 0.231 and 0.503 μg/ml for 0.05 and 0.5 μg/ml of Lia1/2, respectively. In n = 4 experiments, the concentrations of cRGD for half-maximal inhibition were 0.211 ± 0.059 and 0.538 ± 0.130 μg/ml for 0.05 and 0.5 μg/ml of Lia1/2, respectively (mean ± S.D., p < 0.005, Student's t test).
FIGURE 6.
FIGURE 6.
Effect of anti-β1 mAbs on homotypic aggregation of Jurkat cells. A–H, cells (5 × 10⁵/ml) were incubated for 2 h at 37 °C in the presence of the indicated mAbs and photographed using a phase-contrast microscope. Scale bars, 50 μm. Inset shows histogram of mean aggregate size, averaged over three fields of view (mean ± S.D.) for no mAb (None), TS2/16 (TS2), 13, 4B4, AIIB2, Lia1/2, 3S3, and 6S6. The experiment shown is representative of three separate experiments.
FIGURE 7.
FIGURE 7.
Effect of C6-ceramide on homotypic cell aggregation stimulated by anti-β1 mAbs. Jurkat cells (8 × 10⁵/ml) were incubated for 2 h at 37 °C in the presence of the indicated mAbs, in the presence of DMSO (solvent control) or 10 μm C6-ceramide, and photographed using a phase-contrast microscope. C6-ceramide did not cause any reduction in cell viability over the time course of the experiment (>97% of cells were viable both before and after the experiment, as determined by propidium iodide staining, data not shown). Scale bars, 50 μm. TS2/16 is used as a negative control mAb in this assay. Inset shows histogram of mean aggregate size, averaged over three fields of view (mean ± S.D.). The experiment shown is representative of three separate experiments.
FIGURE 8.
FIGURE 8.
Characterization of mAbs 3S3 and 6S6. A and B, SPR test of competitive or allosteric inhibition by 3S3 and 6S6. Binding of α5β1-Fc to 50K fibronectin fragment took place for 120 s in three parallel channels in RB. In the blue sensorgrams, integrin was pre-mixed with 200 nm 3S3 (A) or 6S6 (B). 60 s after the start of the dissociation phase, at the time indicated by the downward-pointing arrow (∼207 s), either RB alone (red and blue sensorgrams) or RB with 200 nm mAb (cyan sensorgrams) was injected for 120 s. C, competitive ELISA experiment to test whether epitopes of 3S3 and 6S6 overlap with that of Lia1/2. Binding of biotinylated Lia1/2 to α5β1-Fc was competed by a large excess of unlabeled mAbs 13, 4B4, AIIB2, 4B4, TS2/16 (TS2), 3S3, 6S6, 8E3, or K20. Con, control. Similar results were obtained in three separate experiments.
FIGURE 9.
FIGURE 9.
Model of headpiece region of α5β1 bound to 3FN9,10, showing epitopes of function-blocking mAbs. In the model, the α5 subunit is shown as a blue ribbon, β1 subunit as a green ribbon, and 3FN9,10 as a semi-transparent light gray surface. In the α5 subunit, residue Leu-212 (P1D6 epitope) is shown in yellow; residues Glu-126, Leu-128, and Trp-157 (mAb 16 epitope) are shown in orange, and residue Ser-85 (JBS5 and SNAKA52 epitopes) is shown in red. In the β1 subunit, residues Val-211 (AIIB2 epitope) and Lys-218 (4B4 epitope) are shown in brown and cyan, respectively. The MIDAS Mg2+ ion is depicted as a dark blue sphere; Ca2+ ions at the SyMBS (synergistic metal-binding site) and ADMIDAS (adjacent to MIDAS) sites (flanking the MIDAS site) are shown as dark red spheres. The α2 helix in the βI domain is shown in magenta. Residues that contribute to the epitopes of mAbs 13, 4B4, and AIIB2 lie in the α2 helix (5). Inset shows an x axis-rotated view, with residues labeled in the main model indicated by arrowheads for reference (α5 subunit residues, black arrowheads; β1 subunit residues, white arrowheads). Scale bars, 20 Å.
FIGURE 10.
FIGURE 10.
Putative accessibility of epitopes of function-blocking mAbs in a model of the headpiece of α5β1 bound to 3FN9,10. A–E, molecular model is the same as that shown in Fig. 9. In respective panels, residue Leu-212 (P1D6 epitope) is shown in yellow; residues Glu-126, Leu-128, and Trp-157 (mAb 16 epitope) are shown in orange; residue Ser-85 (JBS5 and SNAKA52 epitopes) is shown in red within the α5 subunit (blue ribbon); residue Val-211 (AIIB2 epitope) is shown in brown, and residue Lys-218 (4B4 epitope) is shown in cyan within the β1 subunit (green ribbon). The α2 helix in the βI domain is shown in magenta. 3FN9,10 is shown as a semi-transparent light gray surface, and the surface of accessible 3FN9,10 residues within 20 Å of indicated mAb epitope residues is rendered in semi-transparent pink. Residue Arg-1468 (from the Pro-Pro-Ser-Arg-Asn synergy sequence of murine fibronectin) is shown in dark pink and indicated by the pink text in A. Anti-α5 mAbs would be sterically hindered from binding to indicated epitope residues by fibronectin, whereas anti-β1 mAbs would not. Scale bars, 20 Å.
FIGURE 11.
FIGURE 11.
A, effect of function-blocking mAbs on HT-1080 cells pre-spread on 50K. Cells were allowed to spread on 50K for 1 h and then exposed to the indicated anti-α5 (JBS5, 16, P1D6, or SNAKA52) or anti-β1 (13, 4B4, AIIB2, or Lia1/2) mAbs for 1 h. The percentage of spread cells was then quantitated. The non-function-blocking anti-α5 mAb 11 and anti-β1 mAb K20 were used as controls. B, effect of the same mAbs in an assay in which the mAbs were added to the cells before spreading on 50K. Similar results were obtained in three separate experiments.

References

    1. Hynes R. O. (2002) Integrins: bidirectional, allosteric signalling machines. Cell 110, 673–687 - PubMed
    1. Goodman S. L., and Picard M. (2012) Integrins as therapeutic targets. Trends Pharmacol. Sci. 33, 405–412 - PubMed
    1. Blandin A. F., Renner G., Lehmann M., Lelong-Rebel I., Martin S., and Dontenwill M. (2015) β1 integrins as therapeutic targets to disrupt hallmarks of cancer. Front. Pharmacol. 6, 279. - PMC - PubMed
    1. Giordano A., Musumeci G., D'Angelillo A., Rossini R., Zoccai G. B., Messina S., Coscioni E., Romano S., and Romano M. F. (2016) Effects of glycoprotein IIb/IIIa antagonists: anti platelet aggregation and beyond. Curr. Drug Metab. 17, 194–203 - PubMed
    1. Rice G. P., Hartung H. P., and Calabresi P. A. (2005) Anti-α4 integrin therapy for multiple sclerosis: mechanisms and rationale. Neurology 64, 1336–1342 - PubMed

MeSH terms