

Survival of neonates and predictors of their mortality in Tigray region, Northern Ethiopia: prospective cohort study
- PMID: 27485138
- PMCID: PMC4971662
- DOI: 10.1186/s12884-016-0994-9
Survival of neonates and predictors of their mortality in Tigray region, Northern Ethiopia: prospective cohort study
Abstract
Background: Neonatal mortality accounts for an estimated 2.8 million deaths worldwide, which constitutes 44 % of under-5-mortality and 60 % of infant mortality. Neonatal mortality predictors vary by country with the availability and quality of health care. Therefore, aim of this study was to estimate survival time and identify predictors of neonatal mortality in Tigray region, northern Ethiopia.
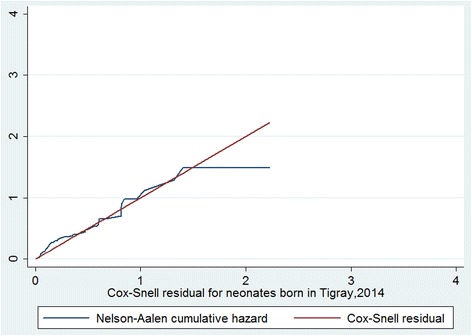
Method: A prospective cohort study design was carried out among a cohort of neonates delivered in seven hospitals of Tigray from April to July, 2014 and followed up for a total of 28 days. Data were collected by interviewing mothers using structured questionnaires and assessments of the neonate and mothers by midwives. Kaplan-Meier, Log rank test and Cox-proportional hazard regressions were used. STATA V-11 program was used for data entry, cleaning and analysis.
Results: From 1152 neonates, 68 died (neonatal mortality rate 62.5/1000 live births), 73.52 % of the neonates died within 7 days, 60 were lost to follow-up and the percentage of survival at 28 days was 93.96 % (95 % CI: 92.4, 95.2 %). Predictors of neonatal mortality were: normal birth weight (AHR: 0.45, 95 % CI: 0.24, 0.84), not initiating exclusive breastfeeding (AHR: 7.5, 95 % CI: 3.77, 15.05), neonatal complications (AHR: 0.14, 95 % CI 0.07, 0.29), maternal complications (AHR: 0.37, 95 % CI: 0.22, 0.63) and proximity (AHR: 2.5, 95 % CI: 1.29, 4.91).
Conclusion: Neonatal mortality is unacceptably very high. Managing complications and low birth weight, initiating exclusive breast feeding, improving quality of services and ensuring a continuum of care are recommended to increase survival of neonates.
Keywords: Ethiopia; Neonatal mortality; Survival analysis; Tigray region.
Figures


References
-
- UNICEF, World Health Organization, the World Bank, the United Nations Population Division: Levels & Trends in Child Mortality: Estimates Developed by the UN Inter-agency Group for Child Mortality Estimation (UN IGME). UN IGME; 2014.
-
- UNICEF, World Health Organization, the World Bank, the United Nations Population Division: Levels & Trends in Child Mortality: Estimates Developed by the UN Inter-agency Group for Child Mortality Estimation (IGME). UN IGME; 2013.
-
- Lawn JE, Cousens S, Zupan J. Lancet neonatal survival steering team. 4 million neonatal deaths: when? where? why? Lancet. 2005;365(9462):891–900. - PubMed
-
- Central Statistical Agency [Ethiopia] and ICF International . Ethiopia demographic and health survey 2011. Addis Ababa and Calverton: Central Statistical Agency and ICF International; 2012.
-
- News from the last 10 kilometers. Ethiopia achieves millennium development goal on reducing child mortality!.Ethiopia: An L10K publication 2013; 2(1). Available from: http://www.10k.jsi.com. Accessed Aug 2014.
Publication types
MeSH terms
LinkOut - more resources
Full Text Sources
Other Literature Sources
Miscellaneous
