

The Moses-Littenberg meta-analytical method generates systematic differences in test accuracy compared to hierarchical meta-analytical models
- PMID: 27485293
- PMCID: PMC5176007
- DOI: 10.1016/j.jclinepi.2016.07.011
The Moses-Littenberg meta-analytical method generates systematic differences in test accuracy compared to hierarchical meta-analytical models
Abstract
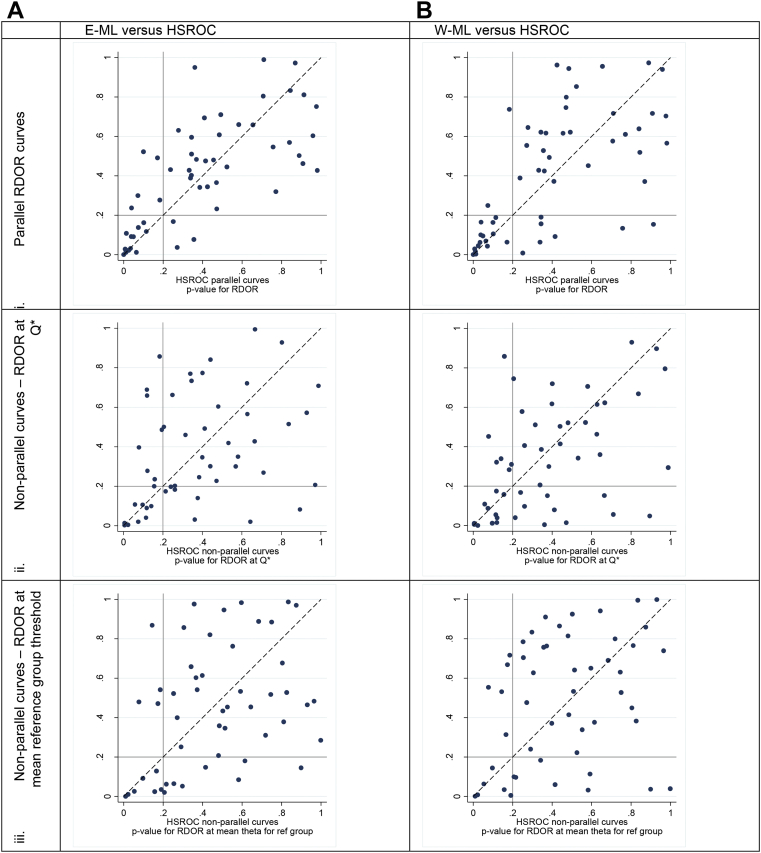
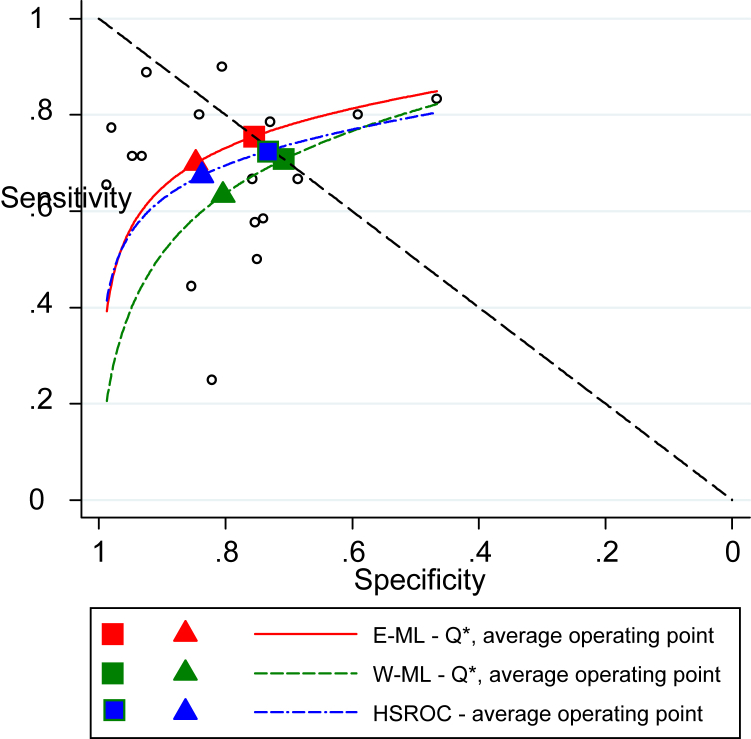
Objective: To compare meta-analyses of diagnostic test accuracy using the Moses-Littenberg summary receiver operating characteristic (SROC) approach with those of the hierarchical SROC (HSROC) model.
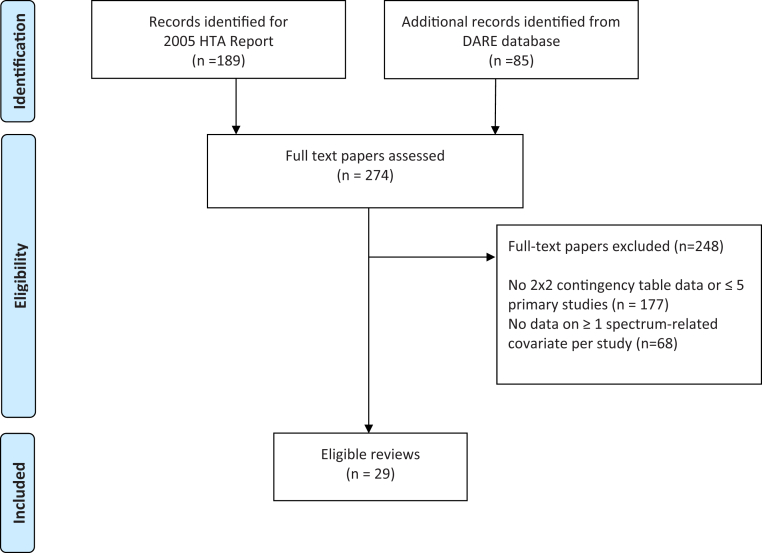
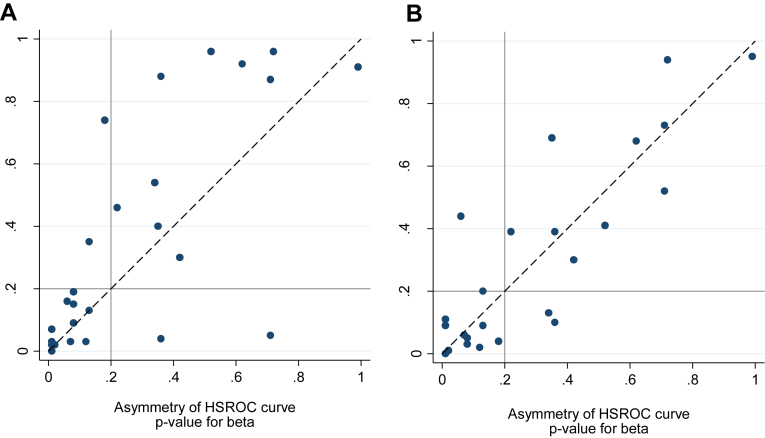
Study design and setting: Twenty-six data sets from existing test accuracy systematic reviews were reanalyzed with the Moses-Littenberg model, using equal weighting ("E-ML") and weighting by the inverse variance of the log DOR ("W-ML"), and with the HSROC model. The diagnostic odds ratios (DORs) were estimated and covariates added to both models to estimate relative DORs (RDORs) between subgroups. Models were compared by calculating the ratio of DORs, the ratio of RDORs, and P-values for detecting asymmetry and effects of covariates on DOR.
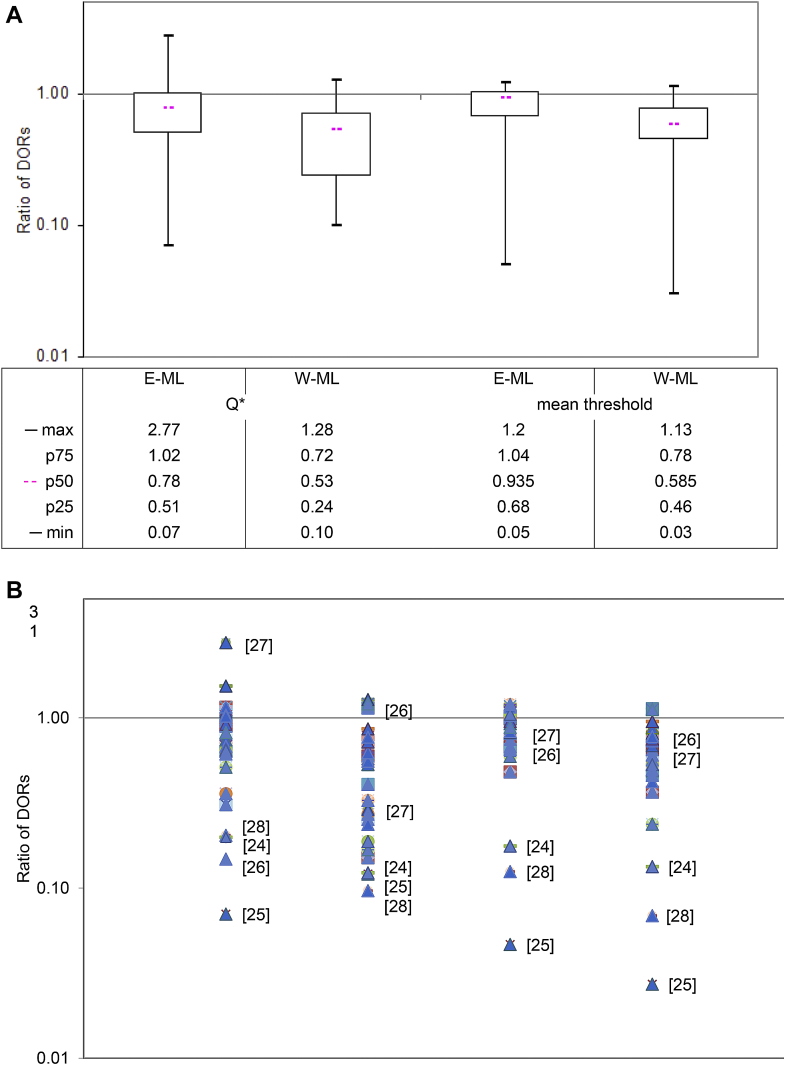
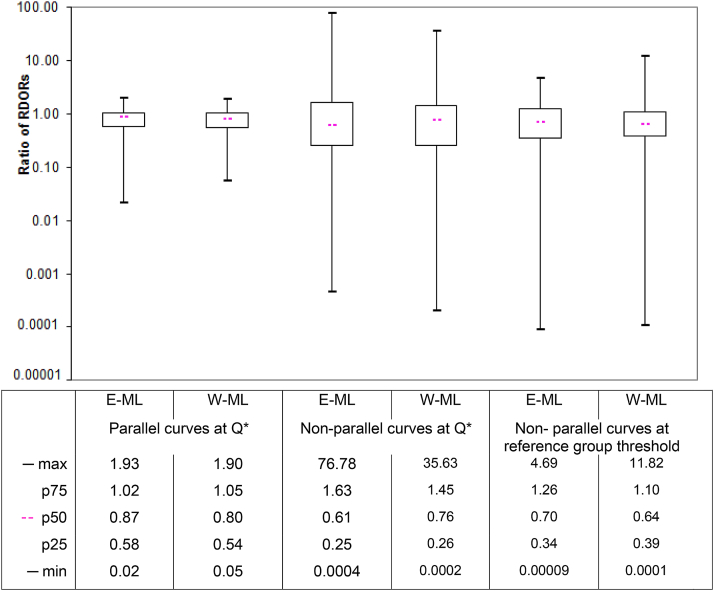
Results: Compared to the HSROC model, the Moses-Littenberg model DOR estimates were a median of 22% ("E-ML") and 47% ("W-ML") lower at Q*, and 7% and 42% lower at the central point in the data. Instances of the ML models giving estimates higher than the HSROC model also occurred. Investigations of heterogeneity also differed; the Moses-Littenberg models on average estimating smaller differences in RDOR.
Conclusions: Moses-Littenberg meta-analyses can generate lower estimates of test accuracy, and smaller differences in accuracy, compared to mathematically superior hierarchical models. This has implications for the usefulness of meta-analyses using this approach. We recommend meta-analysis of diagnostic test accuracy studies to be conducted using available hierarchical model-based approaches.
Keywords: Diagnostic odds ratio; Diagnostic test accuracy; Hierarchical models; Meta-analysis; Summary ROC curves; Systematic review.
Copyright © 2016 The Authors. Published by Elsevier Inc. All rights reserved.
Figures
References
-
- Dinnes J., Deeks J.J., Kirby J., Roderick P. A methodological review of how heterogeneity has been examined in systematic reviews of diagnostic test accuracy. Health Technol Assess. 2005;9:1–113. iii. - PubMed
-
- Cochrane Handbook for Systematic Reviews of Diagnostic Tests. The Cochrane Library. John Wiley & Sons, Ltd.; Chichester, UK: 2008. Issue 1.
-
- Deeks J.J., Higgins J.P., Altman D.G., on behalf of the Cochrane Statistical Methods Group . Chapter 9: analysing data and undertaking meta-analyses. In: Higgins J.P., Green S., editors. Cochrane Handbook for Systematic Reviews of Interventions. Version 5.1.0. The Cochrane Collaboration; 2011. www.cochrane-handbook.org [updated March 2011]. Available at. [Accessed 3 June 2016]
-
- Littenberg B., Moses L.E. Estimating diagnostic accuracy from multiple conflicting reports: a new meta-analytic method. Med Decis Making. 1993;13:313–321. - PubMed
Publication types
MeSH terms
LinkOut - more resources
Full Text Sources
Other Literature Sources
Medical
Molecular Biology Databases
