. 2016 Sep 8;128(10):1424-35.
doi: 10.1182/blood-2016-05-714535. Epub 2016 Aug 2.

miR-146b antagomir-treated human Tregs acquire increased GVHD inhibitory potency

Affiliations

miR-146b antagomir-treated human Tregs acquire increased GVHD inhibitory potency

Yunjie Lu et al. Blood. .

Abstract

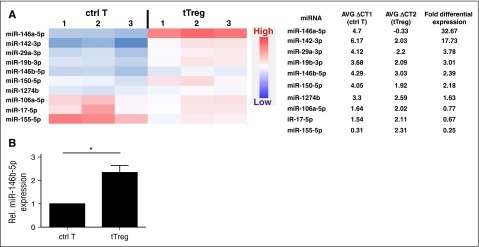
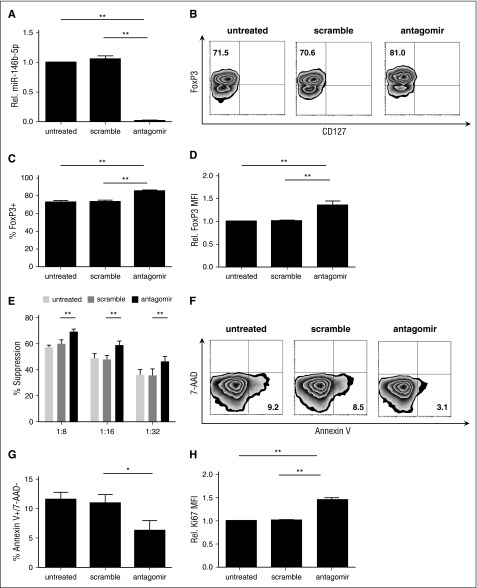
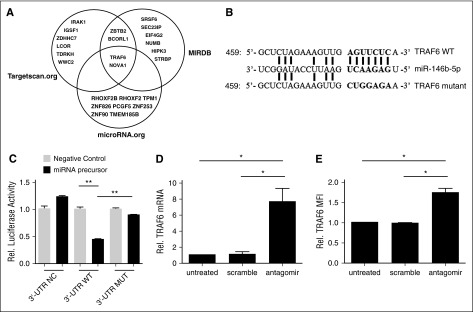
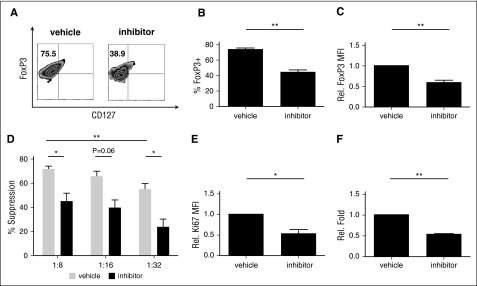
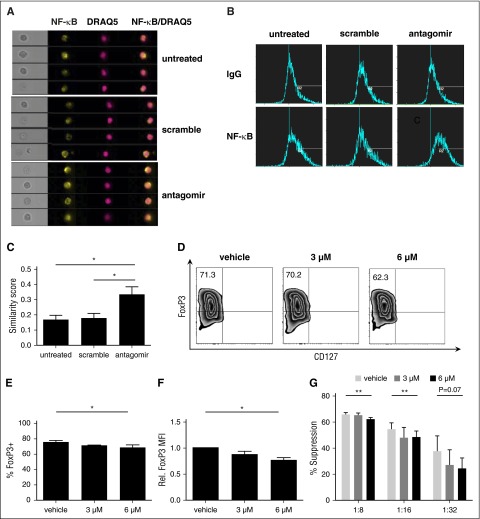
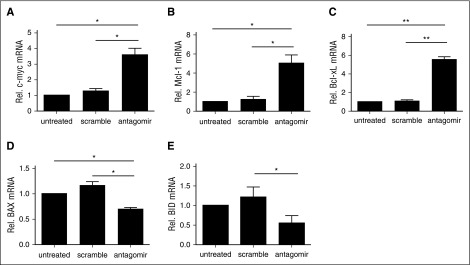
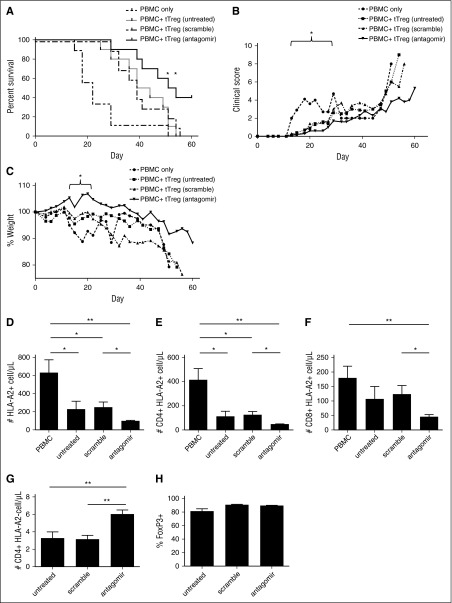
CD4(+)CD25(+)FoxP3(+) thymic-derived regulatory T cells (tTregs) are indispensable for maintaining immune system equilibrium. Adoptive transfer of tTregs is an effective means of suppressing graft-versus-host disease (GVHD) in murine models and in early human clinical trials. Tumor necrosis factor receptor-associated factor 6 (TRAF6), an ubiquitin-conjugating enzyme that mediates nuclear factor κB (NF-κB) activation, plays an essential role in modulating regulatory T cell survival and function. MicroRNAs (miRNAs) are noncoding RNAs, which mediate RNA silencing and posttranscriptional gene repression. By performing comprehensive TaqMan Low Density Array miRNA assays, we identified 10 miRNAs differentially regulated in human tTreg compared with control T cells. One candidate, miR-146b, is preferentially and highly expressed in human naive tTregs compared with naive CD4 T cells. miRNA prediction software revealed that TRAF6 was the one of the top 10 scored mRNAs involved tTreg function with the highest probability as a potential miR-146b target. Antagomir-mediated knockdown of miRNA-146b, but not another miRNA-146 family member (miRNA-146a), enhanced TRAF6 expression. TRAF6, in turn, increases NF-κB activation, which is essential for tTreg function as well as Foxp3 protein and antiapoptotic gene expression, and downregulates proapoptotic gene expression. miR-146b knockdown increased the nuclear localization and expression of genes regulated by NF-κB, which was associated with enhanced tTreg survival, proliferation, and suppressive function measured in vitro and in vivo. TRAF6 inhibition had the opposite effects. We conclude that an miR-146b-TRAF6-NF-κB-FoxP3 signaling pathway restrains regulatory T cell survival, proliferation, and suppressor function. In vitro exposure of human tTregs to miR-146b antagomirs can be exploited to improve the clinical efficacy of human adoptive tTreg transfer in a GVHD setting.


Figures

Figure 1
Figure 1
miRNA profiling of expanded naïve CD4+ T cells and naive tTregs demonstrates stronger expression of miR-146b in human tTregs (n = 3). Naive T cells (CD4+25-127+45RA+) and naive tTregs (CD4+25++127-45RA+) were sort-purified and expanded in vitro. miRNA expression in control T cells (ctrl T) and tTregs was determined by miRNA TaqMan Low Density Array. (A) After analyzing 768 miRNAs, the top 10 differential miRNAs between tTregs and control T cells were gated for further analysis by heatmap (left) and average (AVG) fold differential expression (right) (P < .05) . (B) Relative (Rel.) differential expression of miR-146b in control T cells and tTregs (n = 3) was confirmed by RT-PCR *P < .05.
Figure 2
Figure 2
tTregs treated with miR-146b-5p antagomir show increased FoxP3 and Ki67 expression and viability with enhanced suppressive function. Naive peripheral blood tTregs were sort-purified, expanded in vitro, and treated with or without scramble/antagomir for the final 2 days of culture. (A) miRNA was purified from each culture, and miR-146b expression was assessed by RT-PCR to determine knockdown efficiency (n = 3). (B) Representative example of Foxp3 vs CD127 staining in tTregs treated with antagomir compared with untreated and scramble groups (gated on CD4+ cells). Summary of overall percentage of Foxp3+CD127 cells (C) and level of Foxp3 expression (D) in tTregs from each group (n = 5). (E) Percent suppression of in vitro, anti-CD3–mediated CD8+ T cell proliferation at ratios from 1:8 to 1:32 (tTregs:PBMCs) as determined by CFSE dye dilution (n = 5). (F, G) Representative flow images (F) and statistical analysis (G) of apoptosis tests were performed to analyze the survival ability in vitro. Viability was significantly enhanced after antagomir treatment (n = 3). (H) A higher relative Ki67 mean fluorescence intensity level was found after antagomir treatment (n = 5). Values indicate mean ± standard error of the mean (SEM) of these experiments. *P < .05; **P < .01.
Figure 3
Figure 3
TRAF6 is a direct target of miR-146b-5p and knock-down of miR-146b-5p increased TRAF6 expression in human tTregs (n = 3). To assess whether human miR-146b-5p targets TRAF6, HEK293 cells were transduced with plasmids carrying wild-type (WT) or mutant (MUT) 3′ UTR sequences from TRAF6 linked to a luciferase reporter gene. Cells were also transfected with a Renilla luciferase reporter construct for normalization. (A) Three software packages (targetscan.org, MIRDB, and microRNA.org) were used to predict the potential target mRNAs of miR-146b-5p; TRAF6 was involved in tTreg function with highest probability. (B) Schematic representation of the miR-146b-5p target sequence within the 3′ UTR of TRAF6. Two nucleotides (complementary to nucleotides 6 and 8 of miR-146b-5p) were mutated in the 3′ UTR of TRAF6. The numbers indicate the positions of the nucleotides in the reference WT sequences. (C) Activity of the luciferase gene linked to the WT or MUT 3′ UTR of TRAF6. Luciferase activity was measured after 48 hr. The mean of the results from the cells transfected by control vector was set as 100%. The data are mean and standard deviation (SD) of separate transfections (n = 3). Naive peripheral blood tTregs were sort-purified, expanded in vitro, and treated with or without miR-146b antagomir or scrambled RNA as previously described. After treatment, cultured cells were assessed for TRAF6 mRNA and protein expression by RT-PCR or flow cytometry (D and E, respectively). Values indicate mean ± SEM of these experiments. *P < .05; **P < .01.
Figure 4
Figure 4
Inhibition of TRAF6 signaling impairs human tTreg expansion, Foxp3 expression and suppressive function. tTregs were treated with TRAF6 inhibitor for 2 days (n = 5). (A) Representative flow figures of FoxP3+ tTregs in different groups. Foxp3 expression was significantly decreased after inhibitor treatment. (B) FoxP3+ population and (C) FoxP3 expression was measured in these groups, and the inhibitor-treated group was significantly decreased. (D) CFSE assay was performed to measure suppressive ability and showed decreased suppressive function at 1:8 and 1:32. Values indicate mean ± SEM of these experiments. (E) Ki67 expression was measured in these groups, and Ki67 expression was decreased in the inhibitor-treated group. (F) Relative fold expansion after inhibitor treatment. *P < .05; **P < .01. MFI, mean fluorescence intensity.
Figure 5
Figure 5
NF-κB activation is essential for human tTreg development and translocating NF-κB to the nucleus after knockdown of miR-146b-5p (n = 3). Cells were left untreated or were incubated with scramble RNA or miR-146b antagomir. Following treatment, cells were stained for CD4, NF-κB, and DRAQ5 and NF-κB nuclear localization determined by imaging flow cytometry. (A) Representative Imagestream images of cultured tTregs showing bright-field images, as well as individual or overlaid images of NF-κB and DRAQ5. (B-C) Representative (B) or summary (C) of similarity score measured by IDEA software quantitating the degree of overlap between NF-κB and DRAQ5 staining. Higher similarity scores indicate increased nuclear localization. For panels D-G, naive peripheral blood tTregs were purified, expanded in vitro, and were treated with either DMSO only or PS1145. (D) Representative example of Foxp3 vs CD127 staining on tTreg (gated on CD4+ cells). (E) Summary of overall %Foxp3+CD127 cells, and (F) level of Foxp3 expression. (G) CFSE assay for suppressive function in tTregs from each group. Values indicate mean ± SEM of these experiments. *P < .05; **P < .01. MFI, mean fluorescence intensity.
Figure 6
Figure 6
Treatment with miR-146b-5p antagomir increases antiapoptotic gene expression, decreases proapoptotic gene expression, and enhances tTreg persistence and expansion. Naive peripheral blood tTregs were sort-purified, expanded in vitro, and either left untreated or incubated with scramble RNA or miR-146b antagomir. Following treatment, RNA was purified and quantitative RT-PCR used to determine the expression of (A) c-Myc, the antiapoptotic genes (B) Bcl-xL and (C) Mcl-1, and the proapoptotic genes (D) BID and (E) BAX. Values indicate mean ± SEM of these experiments (*P < .05; **P < .01).
Figure 7
Figure 7
Antagomir-treated tTregs decrease mortality in a xenogeneic model of GVHD. Naive PB tTregs were sort-purified, expanded in vitro, and either left untreated or incubated with scramble RNA or miR-146b antagomir for 2 days. Following treatment, tTregs were washed and cotransferred (15 × 106) with allogeneic PBMCs (15 × 106) into NOD/Scid/γc−/− mice to assess the ability to ameliorate xenogeneic GVHD. n = 10, 10, 9 and 10 for the PBMC, untreated, scramble-treated, and antagomir-treated groups, respectively. (A) Kaplan-Meier survival curves for mice receiving PBMCs ± groups of tTregs. *P < .05. (B) Average weight (percentage of initial) for mice surviving on a given day for different groups of mice (*P < .05 for all tTreg groups from days 15 to 22). (C) Average GVHD score for mice surviving on a given day for different groups of mice. *P < .05 for all tTreg groups from days 13 to 22. GVHD severity was measured by enumerating PBMC-derived (ie, HLA-A2+) T-cell numbers in circulation on day 14 in the (D) HLA-A2+ total, (E) CD4+ HLA-A2+, and (F) CD8+ HLA-A2+ populations, respectively. (G) In vivo tTreg persistence was determined by enumerating CD4+ HLA-A2 cells in the blood on day 7. (H) The FoxP3+ tTreg population was maintained in all groups. Data shown are representative of 2 independent xenogeneic GVHD experiments.

References

    1. Hippen KL, Merkel SC, Schirm DK, et al. Massive ex vivo expansion of human natural regulatory T cells (T(regs)) with minimal loss of in vivo functional activity. Sci Transl Med. 2011;3(83):83ra41. - PMC - PubMed
    1. Hippen KL, Riley JL, June CH, Blazar BR. Clinical perspectives for regulatory T cells in transplantation tolerance. Semin Immunol. 2011;23(6):462–468. - PMC - PubMed
    1. Blazar BR, Murphy WJ, Abedi M. Advances in graft-versus-host disease biology and therapy. Nat Rev Immunol. 2012;12(6):443–458. - PMC - PubMed
    1. Taylor PA, Ehrhardt MJ, Lees CJ, et al. Insights into the mechanism of FTY720 and compatibility with regulatory T cells for the inhibition of graft-versus-host disease (GVHD). Blood. 2007;110(9):3480–3488. - PMC - PubMed
    1. Hoffmann P, Ermann J, Edinger M, Fathman CG, Strober S. Donor-type CD4(+)CD25(+) regulatory T cells suppress lethal acute graft-versus-host disease after allogeneic bone marrow transplantation. J Exp Med. 2002;196(3):389–399. - PMC - PubMed

Publication types

MeSH terms