. 2016 Oct;26(10):1342-1354.
doi: 10.1101/gr.201954.115. Epub 2016 Aug 2.

Single-cell analyses of X Chromosome inactivation dynamics and pluripotency during differentiation

Affiliations

Single-cell analyses of X Chromosome inactivation dynamics and pluripotency during differentiation

Geng Chen et al. Genome Res. 2016 Oct.

Abstract

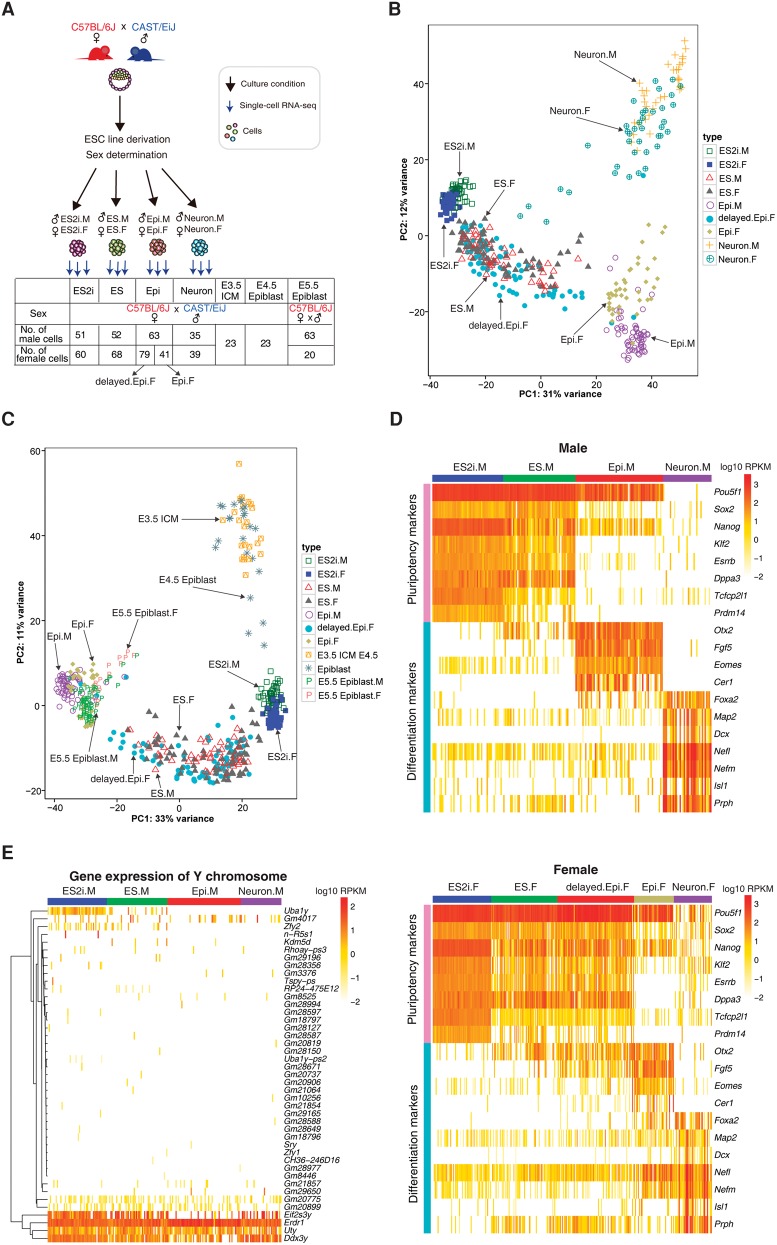
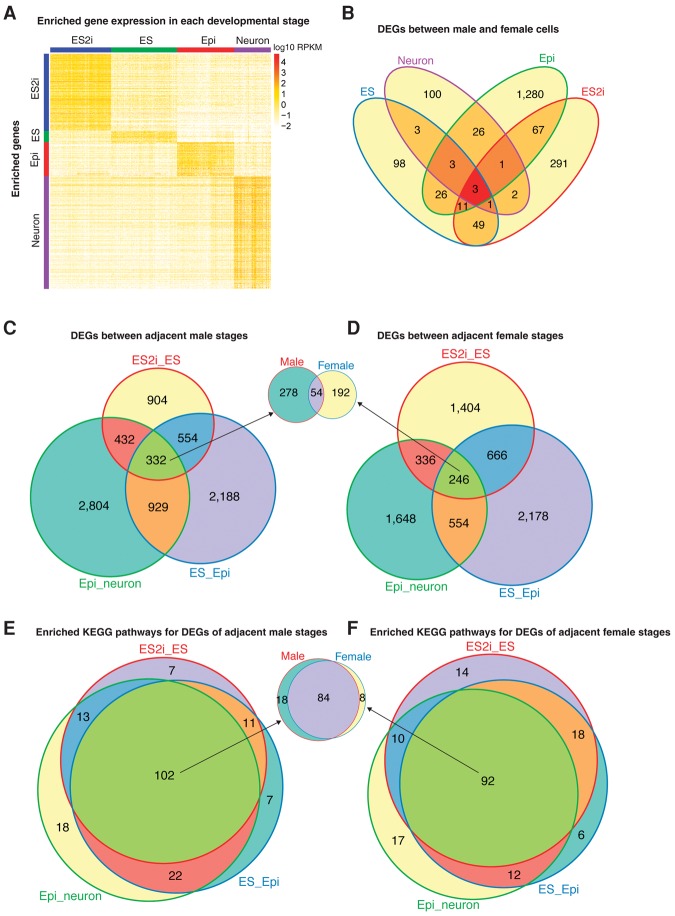
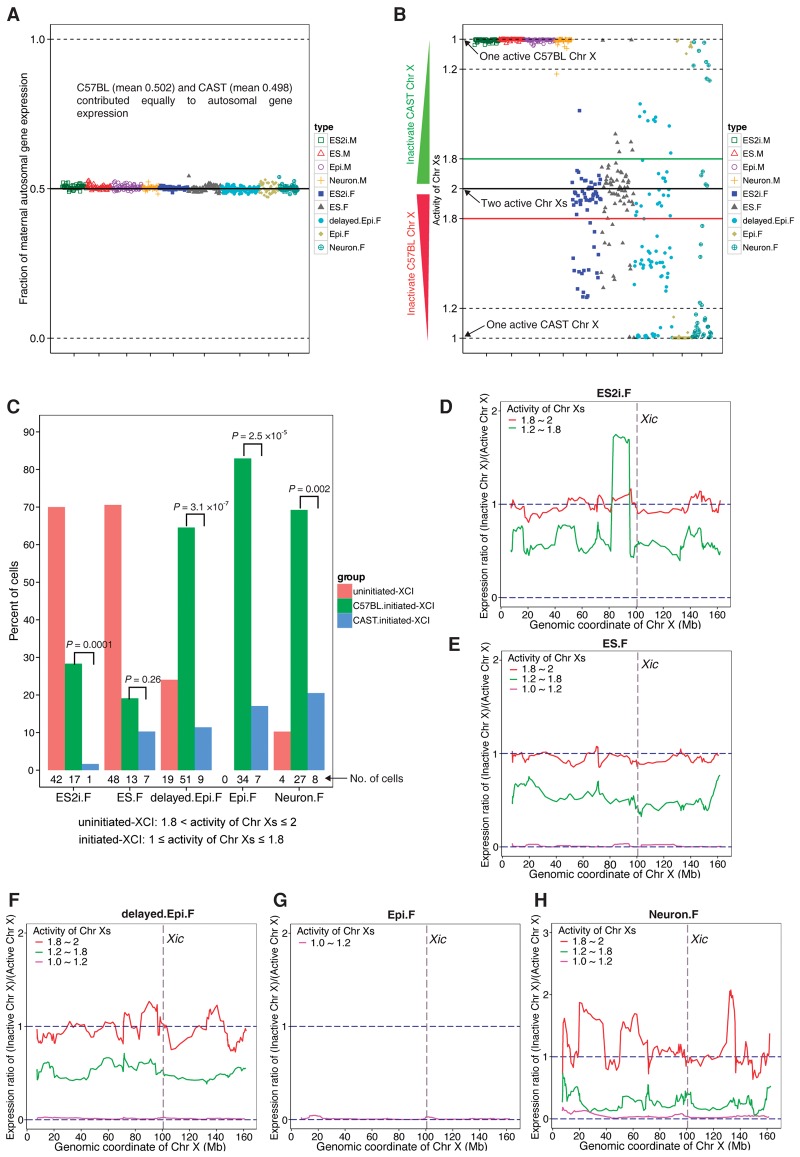
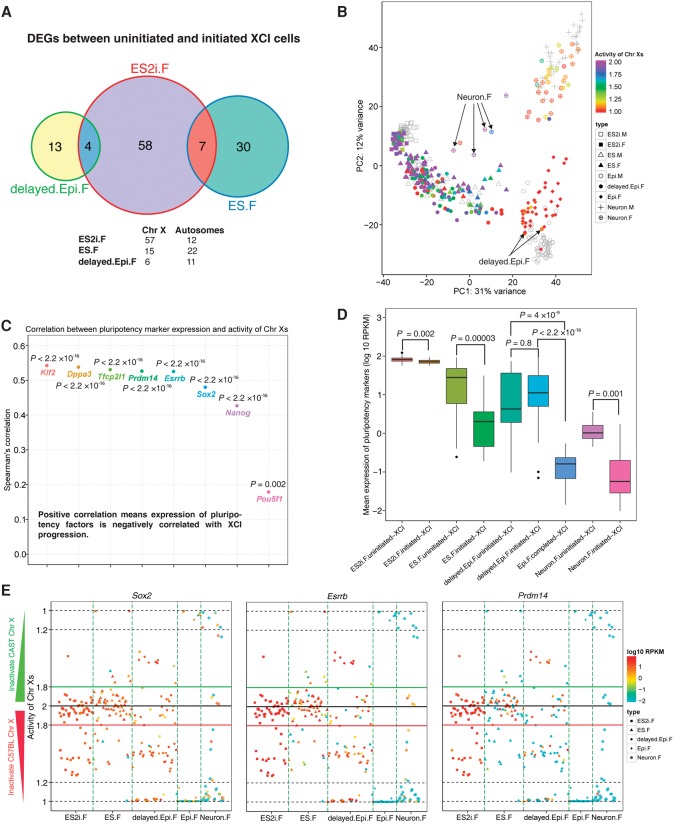
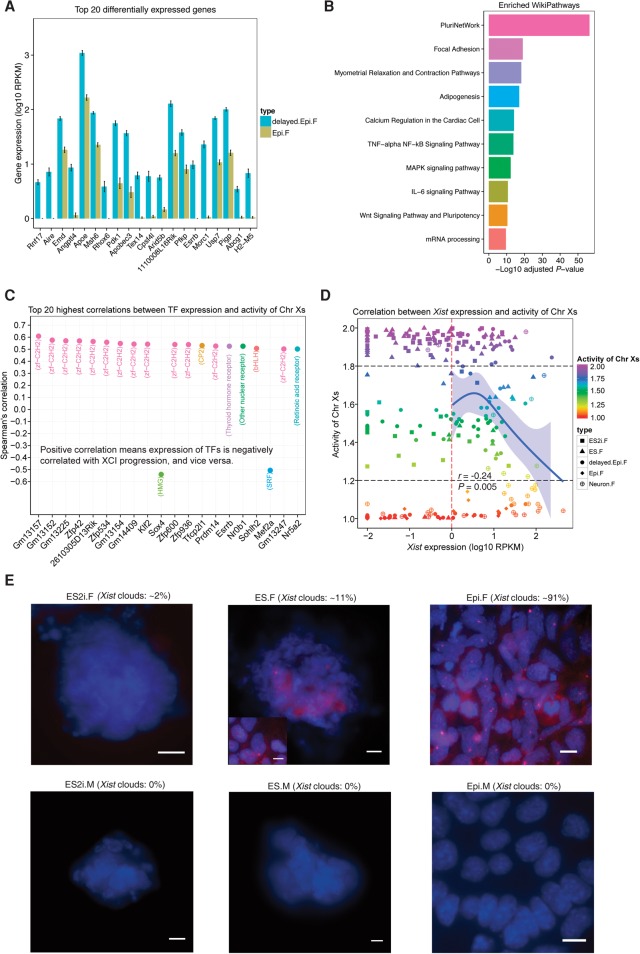
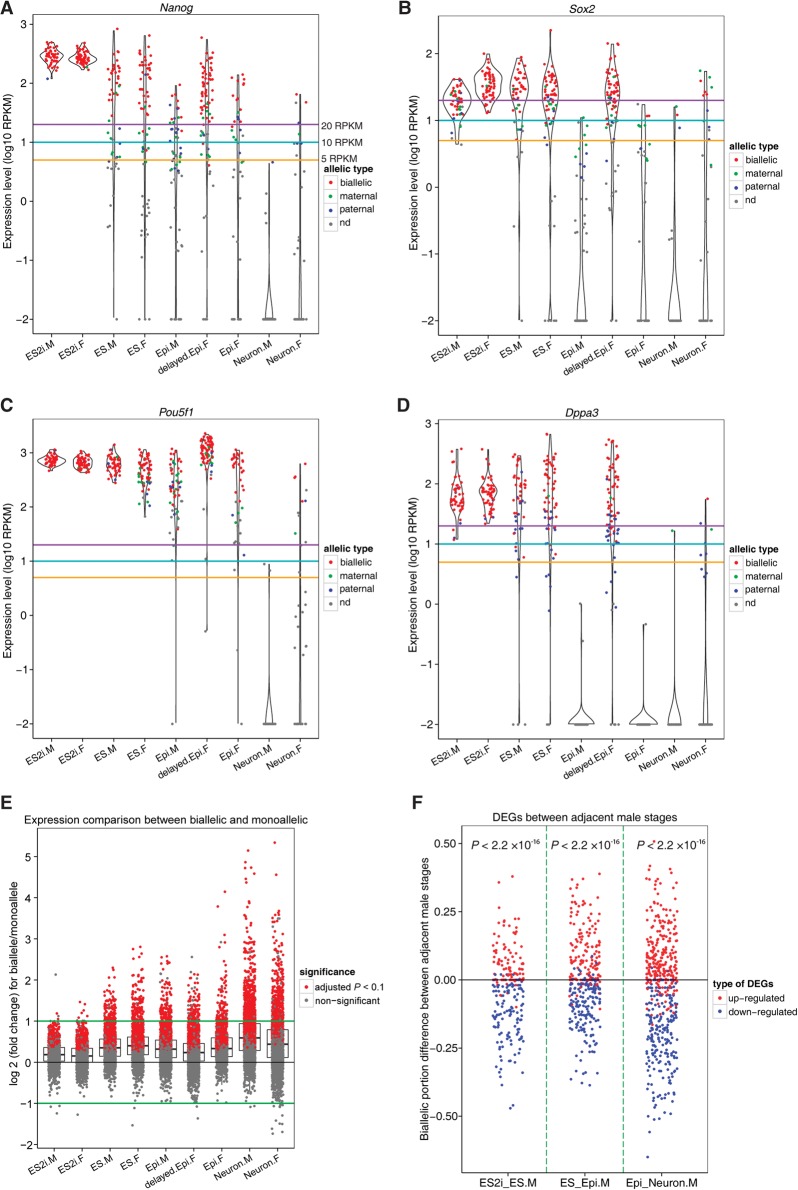
Pluripotency, differentiation, and X Chromosome inactivation (XCI) are key aspects of embryonic development. However, the underlying relationship and mechanisms among these processes remain unclear. Here, we systematically dissected these features along developmental progression using mouse embryonic stem cells (mESCs) and single-cell RNA sequencing with allelic resolution. We found that mESCs grown in a ground state 2i condition displayed transcriptomic profiles diffused from preimplantation mouse embryonic cells, whereas EpiStem cells closely resembled the post-implantation epiblast. Sex-related gene expression varied greatly across distinct developmental states. We also identified novel markers that were highly enriched in each developmental state. Moreover, we revealed that several novel pathways, including PluriNetWork and Focal Adhesion, were responsible for the delayed progression of female EpiStem cells. Importantly, we "digitalized" XCI progression using allelic expression of active and inactive X Chromosomes and surprisingly found that XCI states exhibited profound variability in each developmental state, including the 2i condition. XCI progression was not tightly synchronized with loss of pluripotency and increase of differentiation at the single-cell level, although these processes were globally correlated. In addition, highly expressed genes, including core pluripotency factors, were in general biallelically expressed. Taken together, our study sheds light on the dynamics of XCI progression and the asynchronicity between pluripotency, differentiation, and XCI.


Figures

Figure 1.
Figure 1.
Gene expression profile of in vitro and in vivo mouse embryonic cells. (A) Experimental design of this study: (ICM) inner cell mass. (B) PCA of the cultured embryonic stem cells based on the top 500 variable genes. (C) PCA of cultured, preimplantation (E3.5 ICM and E4.5 epiblast) and post-implantation (E5.5 epiblast) embryonic cells based on the top 500 variable genes. (D) Expression profile of pluripotency and differentiation genes in different conditions for male and female cells (upper and lower panels, respectively). (E) Y Chromosome gene expression across all male cells. (M) male; (F) female.
Figure 2.
Figure 2.
Differential gene expression analysis across developmental states. (A) Enriched gene expression profile in each developmental state. For the Epi condition, Epi.F cells but not delayed.Epi.F cells were used in order to match the developmental state. One-way ANOVA pairwise comparison was applied to the normalized gene expression of different conditions (including both male and female cells) to identify genes with enriched expression. Cutoff: fold change >4 and adjusted P < 0.01. (B) Differentially expressed genes between male and female cells among distinct conditions. (C,D) Differentially expressed genes between adjacent male/female states. (E,F) Enriched KEGG pathways for the DEGs of adjacent male/female states.
Figure 3.
Figure 3.
Dynamic and heterogeneous XCI states in female cells. (A) Fraction of maternal expression for autosomal genes in each condition of cells. Fraction of maternal expression was calculated using maternal allelic reads divided by the sum of maternal and paternal allelic reads. (B) Activity of maternal and paternal X Chromosomes in each condition. The indexes of the activity of Chr Xs in female cells range from 1 (one active X Chromosome) to 2 (two active X Chromosomes). Each type of female cell was divided into three different XCI groups: (1) uninitiated-XCI (1.8< activity of Chr Xs ≤2); (2) ongoing-XCI (1.2< activity of Chr Xs ≤1.8); and (3) completed-XCI (1≤ activity of Chr Xs ≤1.2). (C) The percentage of cells in each XCI group for each condition. Because it is not possible to determine whether the uninitiated-XCI cells are going to inactivate the maternal or paternal X Chromosome, Student's t-test was only applied to the cells of the initiated (ongoing and completed) XCI group. (DH) Chromosome-wide expression ratio of inactive X Chromosome compared to active X Chromosome. The ratio was calculated using the number of allelic reads of inactive X Chromosome divided by that of active X Chromosome based on a moving window of an average of 10 genes. Red, green, and magenta lines denote the female cells in uninitiated-, ongoing-, and completed-XCI groups, respectively.
Figure 4.
Figure 4.
Association between pluripotency, differentiation, and XCI progression across different developmental states. (A) Venn graph for DEGs between uninitiated- and initiated-XCI cells. Female cells were divided into two distinct XCI state groups: (1) uninitiated-XCI (1.8< activity of Chr Xs ≤2); and (2) initiated-XCI (1≤ activity of Chr Xs ≤1.8). Adjusted P < 0.01. (B) Each female cell is colored by the corresponding activity of Chr Xs in PCA. Male cells are shown in gray. Two delayed.Epi.F cells with completed-XCI (arrows, 1≤ activity of Chr Xs ≤1.2) clustered together with Epi.M cells. Four Neuron.F cells with uninitiated-XCI (arrows) were closer to ES cells but further away from other Neuron.F cells. (C) Spearman's correlation between expression of pluripotency genes and the activity of Chr Xs. (D) Comparison of pluripotency gene expression between cells of uninitiated- and initiated-XCI groups for each condition. Epi.F only contained cells from completed-XCI group (1≤ activity of Chr Xs ≤1.2). The y-axis represents mean expression of eight pluripotency genes (Pou5f1, Sox2, Nanog, Klf2, Esrrb, Dppa3, Tcfcp2l1, and Prdm14). Student's t-test was applied to examine the significance of the expression difference between two distinct XCI groups. (E) Overview of the activity of Chr Xs and expression of pluripotency genes for Sox2, Esrrb, and Prdm14 in each cell.
Figure 5.
Figure 5.
Underlying factors associated with delayed progression of mEpiSCs and heterogeneity in expression of Xist. (A) Top 20 DEGs between delayed.Epi.F and Epi.F cells (sorted by adjusted P, mean ± SEM). Cutoff: adjusted P < 0.01. (B) Top 10 significantly enriched WikiPathways for the DEGs between delayed.Epi.F and Epi.F cells. (C) Top 20 highest correlations between TF expression and the activity of Chr Xs. The family of each TF is shown in the parentheses. Spearman's correlations were with adjusted P < 0.01. (D) Spearman's correlation between Xist expression and the activity of Chr Xs. Confidence interval of 95% for the curve of Natural Spline is shown. (E) RNA FISH of Xist shown for female and male ES2i, ES, and Epi cells. Xist clouds are in red, and nuclei are in blue (DAPI staining). For ES.F cells, Xist clouds are shown in two different morphologies (colony and the metastable cells). The percentage of Xist clouds was calculated per 100 cells from multiple images (n = 6) per condition. The Xist clouds were imaged with 0.3 μm z-stack. (Scale bar) 10 μm.
Figure 6.
Figure 6.
Allelic expression of pluripotency genes and contribution of allelic composition to differential expression. (AD) Allelic expression profile for pluripotency genes Nanog, Sox2, Pou5f1, and Dppa3. Gold, cyan, and purple lines indicate the expression levels of 5, 10, and 20 RPKM. (E) Expression level comparison for each gene between biallelic and monoallelic fashions. Only those autosomal genes that are expressed at 20 or more RPKM in cell types with five or more bialleles and five or more monoalleles were considered. Student's t-test was applied to examine whether expression level of genes in a biallelic way was significantly higher than that in a monoallelic way. (F) Relationship between biallelic expression and up-/down-regulated genes between two adjacent male stages. X-axis denotes the comparing groups: ES2i versus ES, ES versus Epi, and Epi versus Neuron. Y-axis represents the biallelic fraction difference of cells between two comparing groups. Exact binomial test was applied to check the significance. Only those autosomal genes with expression level of 20 or more RPKM in at least 60% of a given cell type were considered. (M) male; (F) female; (nd) not detected.

References

    1. Allodi I, Hedlund E. 2014. Directed midbrain and spinal cord neurogenesis from pluripotent stem cells to model development and disease in a dish. Front Neurosci 8: 109. - PMC - PubMed
    1. Bin G, Jiarong Z, Shihao W, Xiuli S, Cheng X, Liangbiao C, Ming Z. 2012. Aire promotes the self-renewal of embryonic stem cells through Lin28. Stem Cells Dev 21: 2878–2890. - PMC - PubMed
    1. Boroviak T, Loos R, Bertone P, Smith A, Nichols J. 2014. The ability of inner-cell-mass cells to self-renew as embryonic stem cells is acquired following epiblast specification. Nat Cell Biol 16: 516–528. - PMC - PubMed
    1. Bradley A, Evans M, Kaufman MH, Robertson E. 1984. Formation of germ-line chimaeras from embryo-derived teratocarcinoma cell lines. Nature 309: 255–256. - PubMed
    1. Brons IG, Smithers LE, Trotter MW, Rugg-Gunn P, Sun BW, Chuva de Sousa Lopes SM, Howlett SK, Clarkson A, Ahrlund-Richter L, Pedersen RA, et al. 2007. Derivation of pluripotent epiblast stem cells from mammalian embryos. Nature 448: 191–195. - PubMed

Publication types