. 2016 Sep 1;116(3):1468-79.
doi: 10.1152/jn.00057.2016. Epub 2016 Jul 13.

Velocity dependence of vestibular information for postural control on tilting surfaces

Affiliations

Velocity dependence of vestibular information for postural control on tilting surfaces

Fay B Horak et al. J Neurophysiol. .

Abstract

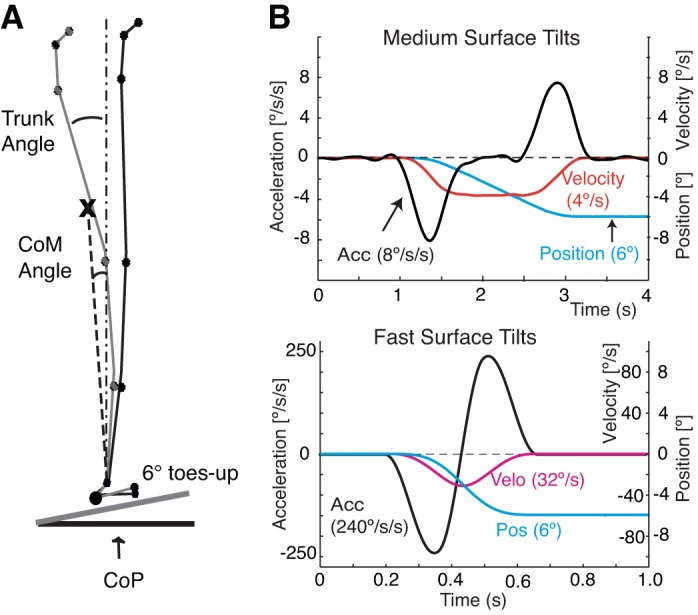
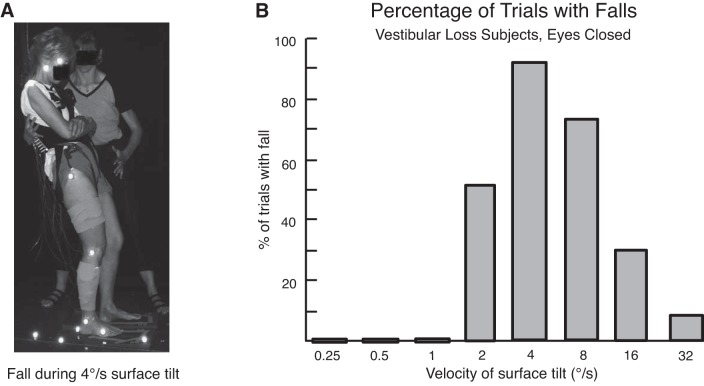
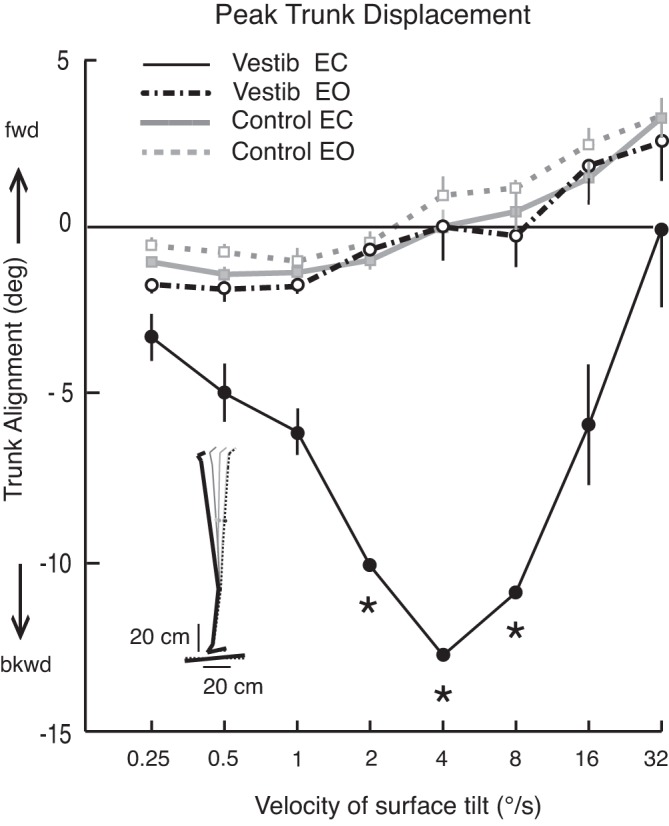
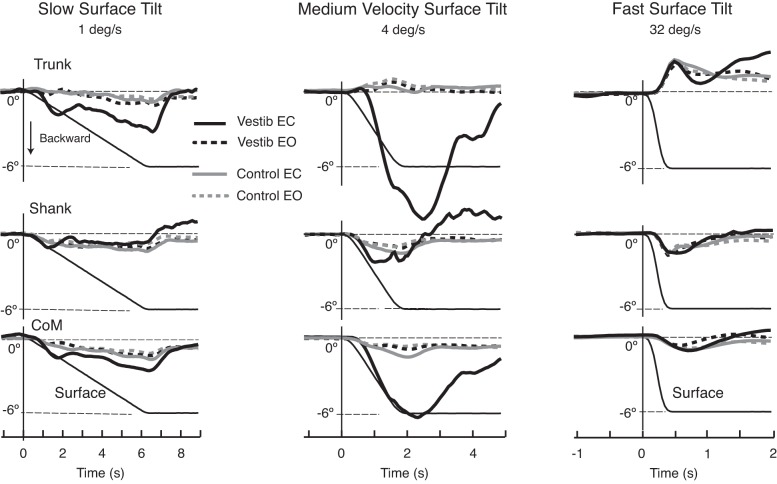
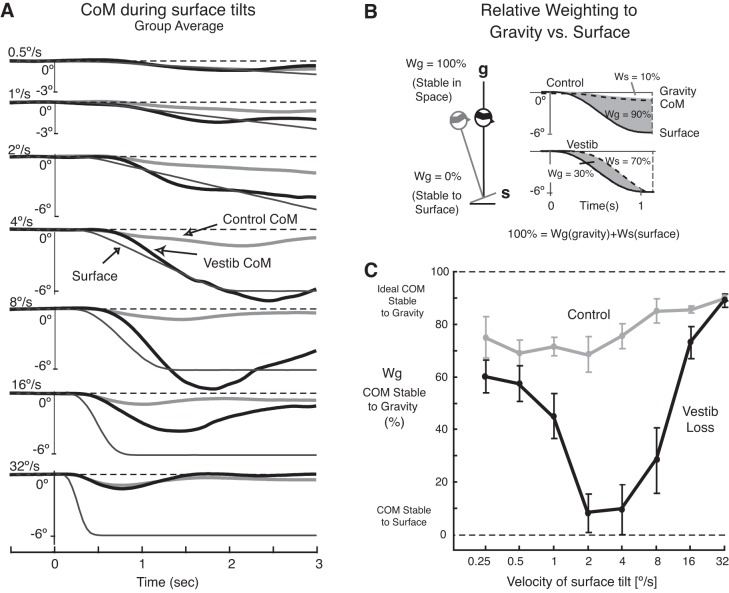
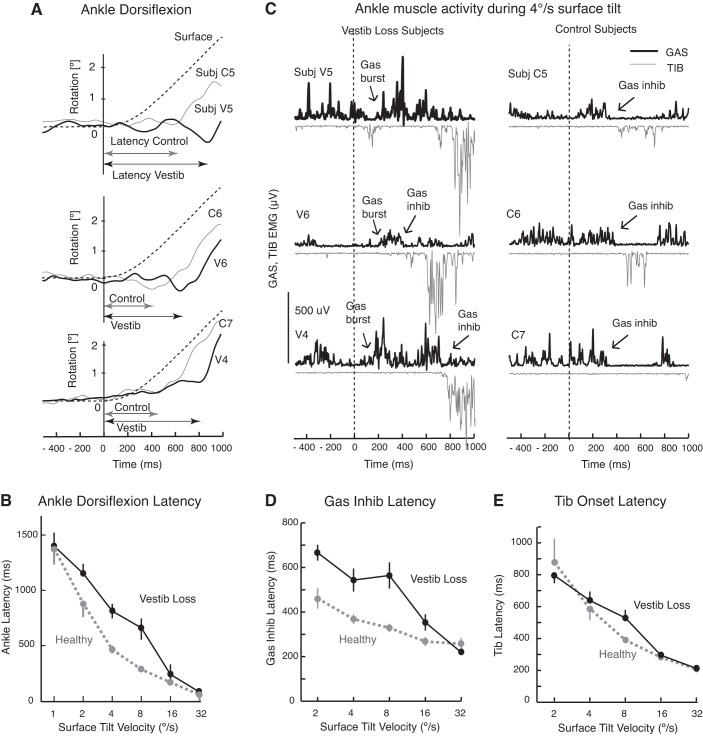
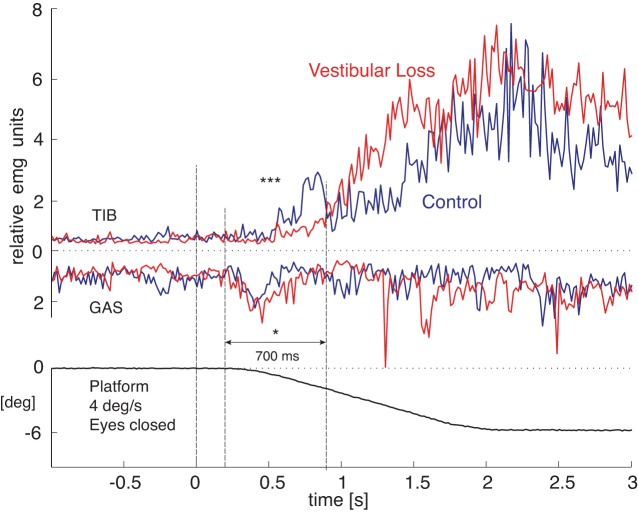
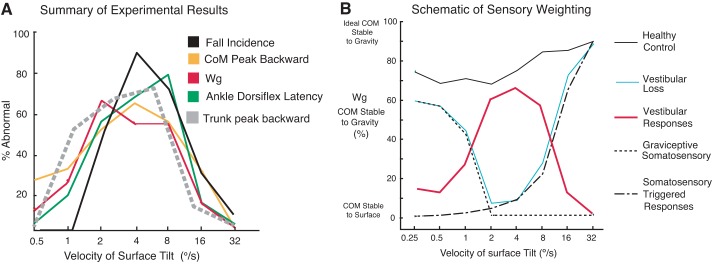
Vestibular information is known to be important for postural stability on tilting surfaces, but the relative importance of vestibular information across a wide range of surface tilt velocities is less clear. We compared how tilt velocity influences postural orientation and stability in nine subjects with bilateral vestibular loss and nine age-matched, control subjects. Subjects stood on a force platform that tilted 6 deg, toes-up at eight velocities (0.25 to 32 deg/s), with and without vision. Results showed that visual information effectively compensated for lack of vestibular information at all tilt velocities. However, with eyes closed, subjects with vestibular loss were most unstable within a critical tilt velocity range of 2 to 8 deg/s. Subjects with vestibular deficiency lost their balance in more than 90% of trials during the 4 deg/s condition, but never fell during slower tilts (0.25-1 deg/s) and fell only very rarely during faster tilts (16-32 deg/s). At the critical velocity range in which falls occurred, the body center of mass stayed aligned with respect to the surface, onset of ankle dorsiflexion was delayed, and there was delayed or absent gastrocnemius inhibition, suggesting that subjects were attempting to actively align their upper bodies with respect to the moving surface instead of to gravity. Vestibular information may be critical for stability at velocities of 2 to 8 deg/s because postural sway above 2 deg/s may be too fast to elicit stabilizing responses through the graviceptive somatosensory system, and postural sway below 8 deg/s may be too slow for somatosensory-triggered responses or passive stabilization from trunk inertia.

Keywords: human; postural stability; proprioception; somatosensory; surface tilt; vestibular.


Figures

Fig. 1.
Fig. 1.
A: definitions of trunk angle and CoM angle and position of eight kinematic reflective markers from a representative control subject standing on the support surface when flat and after tilting toes-up by 6 deg. Trunk angle was measured as the difference from gravitational vertical with the axis of angle on the greater trochanter. CoM angle was measured as the difference from gravitational vertical with the axis of angle on the lateral malleolus. B: characteristics of platform position displacement, velocity, and acceleration for the 4 deg/s and 32 deg/s velocity conditions. CoM, center of mass.
Fig. 2.
Fig. 2.
A: example of a subject with vestibular loss falling backward during a surface tilt of 4 deg/s. Note the larger trunk, than shank, backward tilt. B: percentage of trials that resulted in a fall is compared across tilt velocities for subjects with vestibular loss in the eyes-closed condition. A fall was defined as either being caught by the research assistant or by taking a step to maintain balance. Subjects with vestibular loss did not fall when their eyes were open. Control subjects did not fall.
Fig. 3.
Fig. 3.
Effect of surface tilt velocity on peak trunk displacement (means ± SE) is compared between subject groups (subjects with vestibular loss are depicted with black lines and symbols, control subjects are depicted with gray lines and symbols) and visual conditions (open circles, eyes-open; filled circles, eyes-closed). Note that the greatest difference between subjects with vestibular loss and control subjects took place at mid-range velocities of 2 to 8 deg/s when subjects' eyes were closed. In fact, more than 50% of trials at 2 to 8 deg/s resulted in loss of balance, and peak backward lean at these velocities could only be estimated. The estimated values are indicated by asterisks and represent the peak trunk lean at the time that subjects were caught by the research assistant.
Fig. 4.
Fig. 4.
Changes in postural responses during slow (1 deg/s), medium (4 deg/s), and fast (32 deg/s) surface tilts. The plots are aligned with onset of surface tilt. For each velocity, the group average trunk, shank, and CoM displacement during surface tilts is compared between groups (subjects with vestibular loss in black, control subjects in gray) and between visual conditions (dashes, eyes-open; solid lines, eyes-closed). Notice that the largest between-group differences occurred when the surface tilted at 4 deg/s and subjects' eyes were closed (solid lines). The thin black line in all figures is the platform 6 deg rotation displacement. The onset and offset of surface displacement was defined based on first detectable change in surface acceleration.
Fig. 5.
Fig. 5.
Relative weighting of gravity vs. to the surface as a reference for postural control during surface tilts with eyes closed. A: displacement of the body CoM during the period of surface tilts for subjects with vestibular loss (thick black lines) and control subjects (thick gray lines) is compared across tilt velocity conditions starting with the slowest, 0.5 deg/s condition (top) and progressing to the fastest, 32 deg/s condition (bottom). The CoM is shown as pitch angular rotation, anchored at the ankle joint, with backward tilts downward. B: the method used to quantify the proportion that a subject depended on gravity (Wg) vs. the support surface (Ws) as a reference for keeping the body's CoM stable during surface tilts. C: effect of surface tilt velocity on the mean (± SE) relative weighting to gravity (Wg) for subjects with vestibular loss (black line) and control subjects (gray line) in the eyes-closed condition.
Fig. 6.
Fig. 6.
Evidence of active postural destabilization in subjects with vestibular loss with their eyes closed. A: examples of delays to initiation of ankle dorsiflexion in response to 4 deg/s surface tilts from three representative subjects with vestibular loss (V4, V5, and V6) compared with three control subjects (C5, C6, and C7). B: comparison of latencies to ankle dorsiflexion after the surface began to tilt between vestibular loss (black tracings) and control groups (gray tracings) across surface tilt velocities (group means ± SE). C: gastrocnemius (GAS) and anterior tibialis (TIB) muscle bursts and inhibition in response to 4 deg/s surface tilts from the same representative subjects as in A. D and E: average latency of GAS inhibition and TIB activation between the groups, respectively, but we could not reliability measure these for the slowest surface tilts (0.5 deg/s). Note the large GAS burst and late or incomplete GAS inhibition in the subjects with vestibular loss. Standard errors were sometimes too small to be observed around the means in B, D, and E.
Fig. 7.
Fig. 7.
Group-averaged TIB and GAS electromyographic (EMG) activity in response to the 4 deg/s surface tilt resulting in a fall in subjects with vestibular loss and their eyes closed. The group of subjects with vestibular loss (red lines) showed significantly less TIB integrated EMG (IEMG) than the control group (black lines, ***P < 0.001) and significantly more GAS IEMG activity (*P < 0.05) during the initial postural response (200–900 ms after onset of surface tilt). Each subjects' contribution to the group average was from their mean of three responses. EMG integrals were normalized to the mean value 1 s prior to platform rotation onset to 1.5 s after platform onset to control for individual differences in EMG amplitudes.
Fig. 8.
Fig. 8.
A: summary of experimental results as % differences in group average performance measures between subjects with vestibular loss and control subjects across tilt velocities in the eyes-closed conditions. B: a schematic of approximate sensory weightings of vestibular and somatosensory inputs for postural orientation across surface tilt velocities based on our results. Our Wg data from groups of control subjects (black solid line) and subjects with vestibular loss (blue solid line) are summarized. The graviceptive somatosensory influence (horizontal dotted lines) and somatosensory-triggered postural responses (vertical dashed lines) follow the ability of our group of subjects with vestibular loss to maintain stability at low and high velocities, respectively. We propose that vestibular responses (red line = control data − vestibular loss Wg data) are most critical at tilt velocities too fast for control by graviceptive somatosensory inputs and too slow for control by somatosensory-triggered postural responses.

References

    1. Allum JH, Pfaltz CR. Visual and vestibular contributions to pitch sway stabilization in the ankle muscles of normals and patients with bilateral peripheral vestibular deficits. Exp Brain Res 58: 82–94, 1985. - PubMed
    1. Allum JH, Tang KS, Carpenter MG, Oude Nijhuis LB, Bloem BR. Review of first trial responses in balance control: influence of vestibular loss and Parkinson's disease. Hum Mov Sci 30: 279–295, 2011. - PubMed
    1. Buchanan JJ, Horak FB. Emergence of postural patterns as a function of vision and translation frequency. J Neurophysiol 81: 2325–2339, 1999. - PubMed
    1. Buchanan JJ, Horak FB. Vestibular loss disrupts control of head and trunk on a sinusoidally moving platform. J Vestib Res 11: 371–389, 2001. - PubMed
    1. Carpenter MG, Allum JH, Honegger F. Vestibular influences on human postural control in combinations of pitch and roll planes reveal differences in spatiotemporal processing. Exp Brain Res 140: 95–111, 2001. - PubMed

Publication types

LinkOut - more resources