. 2016 Oct 1;116(4):1694-1704.
doi: 10.1152/jn.00744.2015. Epub 2016 Jul 13.

The antiepileptic and ictogenic effects of optogenetic neurostimulation of PV-expressing interneurons

Affiliations

The antiepileptic and ictogenic effects of optogenetic neurostimulation of PV-expressing interneurons

Fadi Assaf et al. J Neurophysiol. .

Abstract

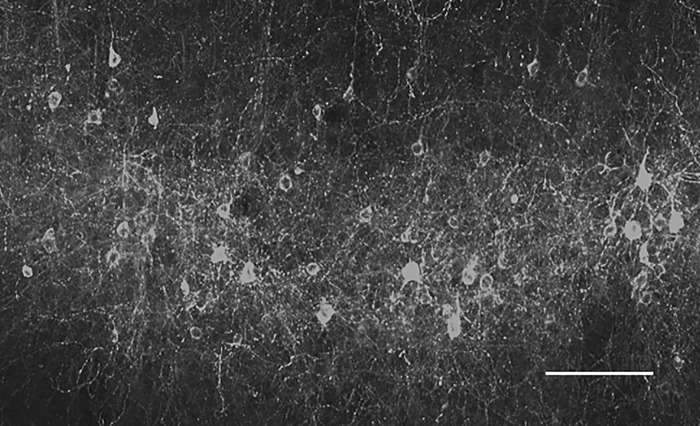
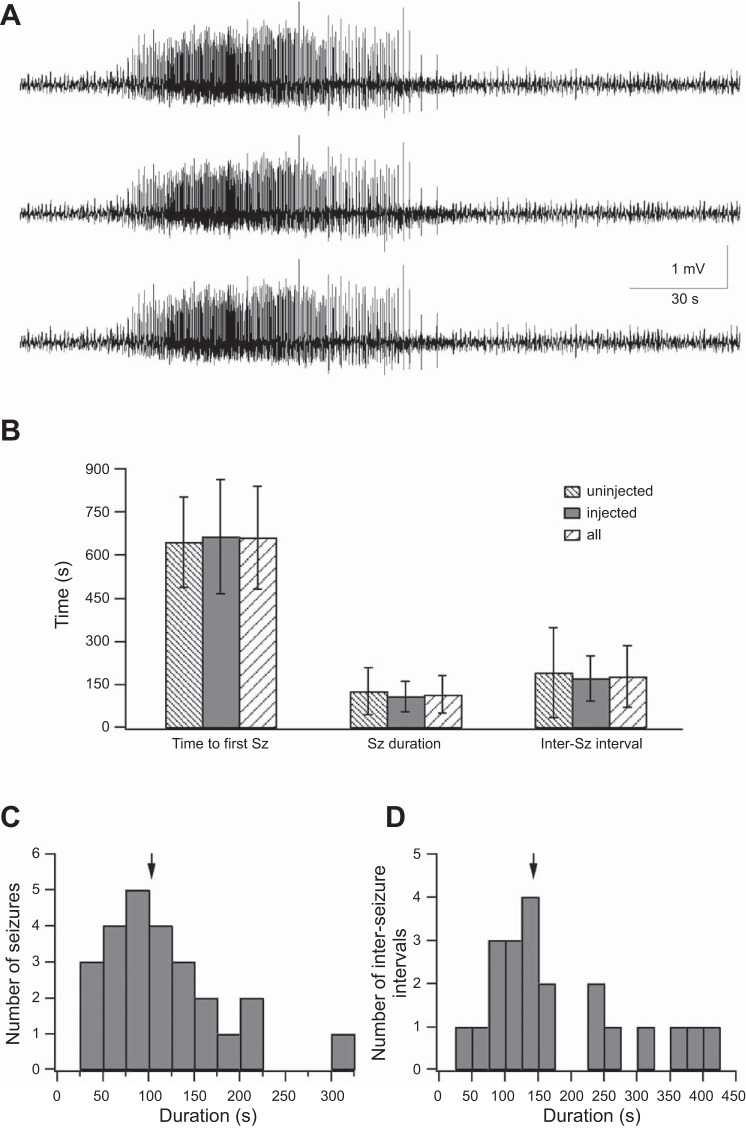
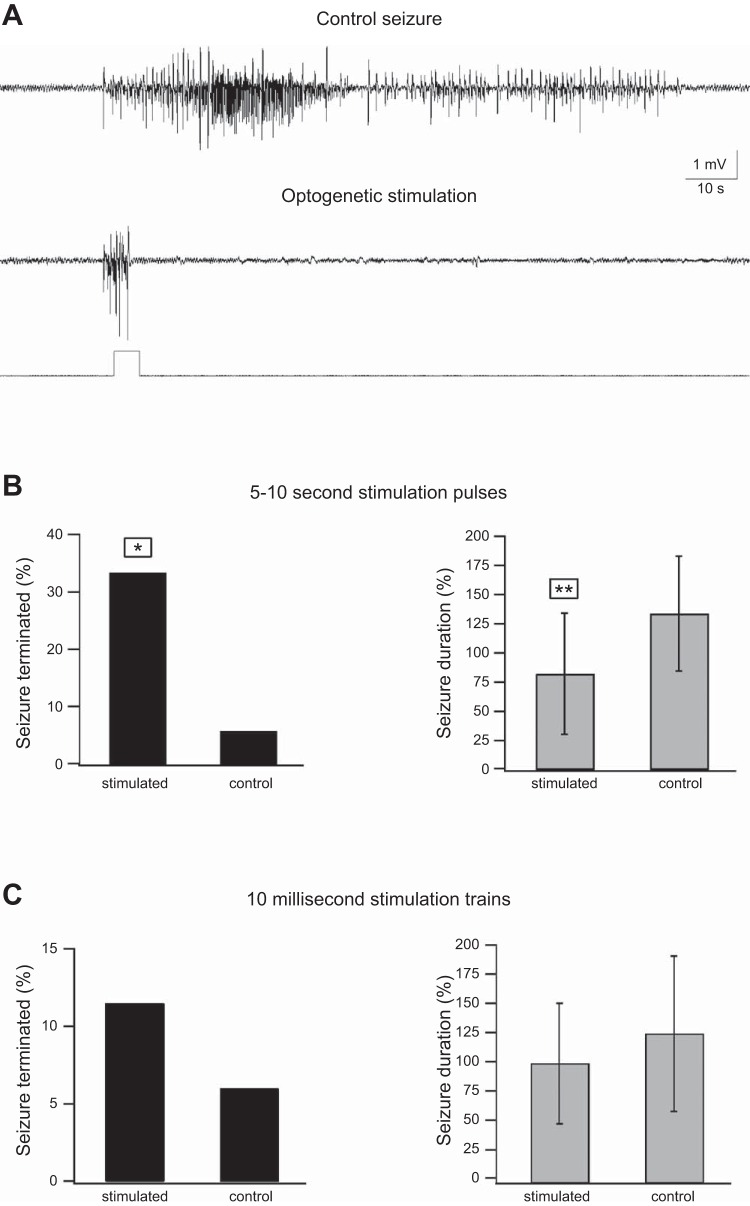
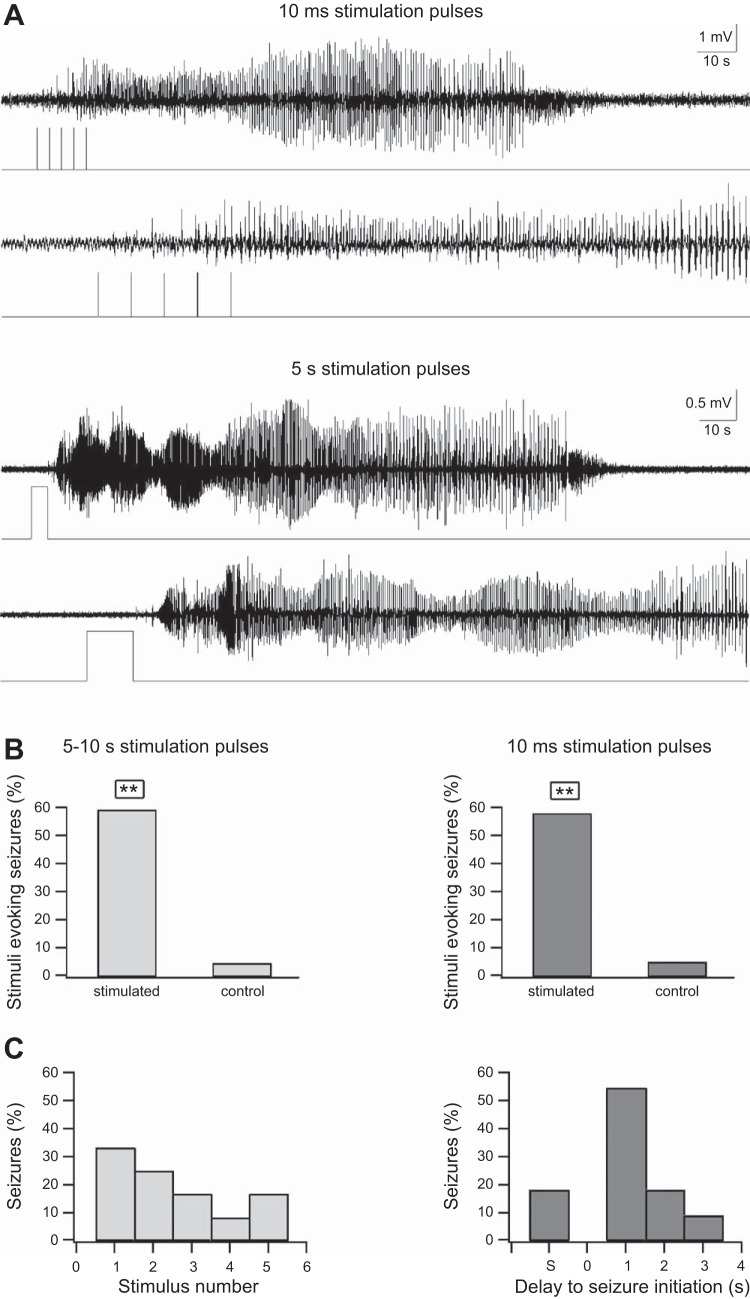
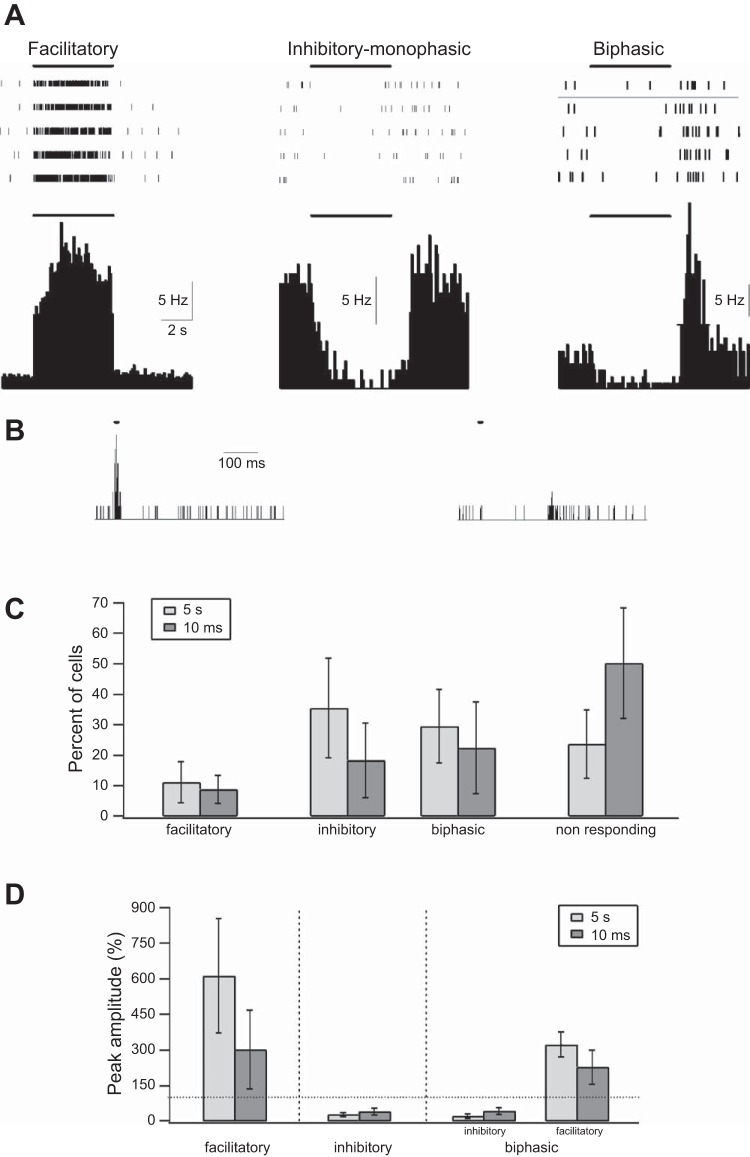
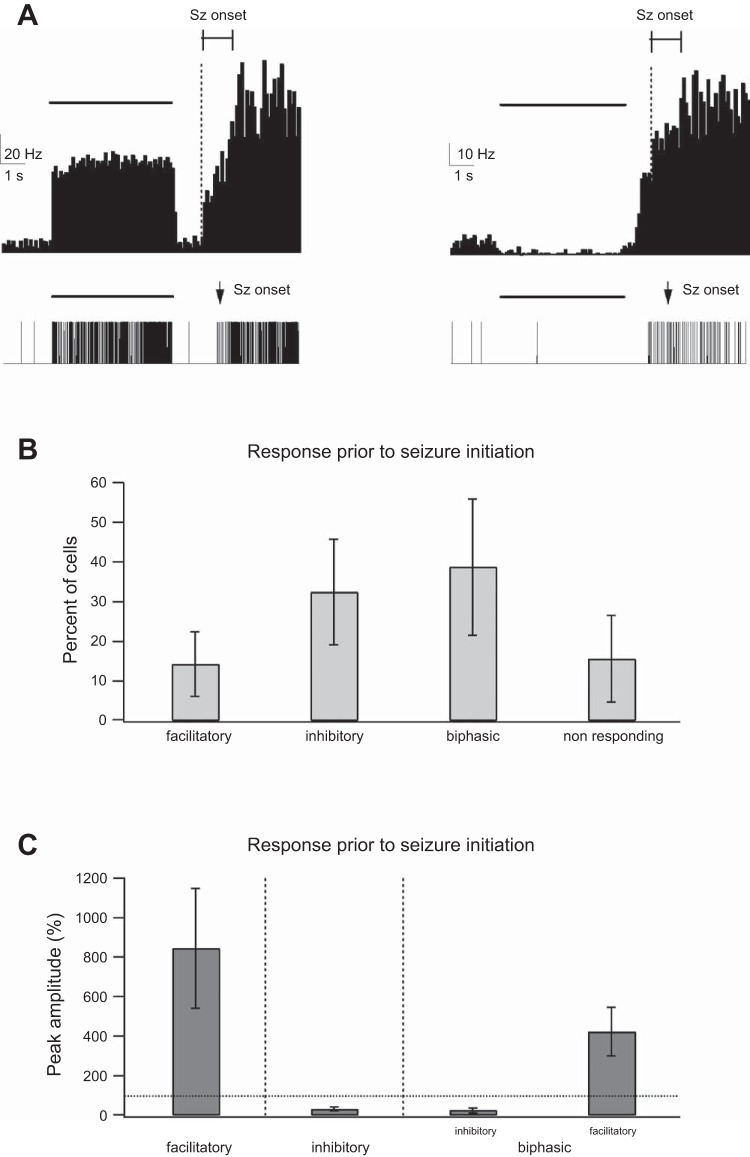
Parvalbumin (PV)-expressing interneurons exert powerful inhibitory effects on the normal cortical network; thus optogenetic activation of PV interneurons may also possess antiepileptic properties. To investigate this possibility we expressed channelrhodopsin 2 in PV interneurons by locally injecting the Cre-dependent viral vector AAV2/1-EF1a-DIO-ChETA-EYFP into the S1 barrel cortex of PV-Cre mice. Approximately 3-4 wk later recurrent electrographic seizures were evoked by local application of the chemoconvulsant 4-aminopyridine (4-AP); the ECoG and unit activity were monitored with extracellular silicone electrodes; and PV interneurons were activated optogenetically during the ictal and interictal phases. Five- to ten-second optogenetic activation of PV interneurons applied during electrographic seizures (ictal phase) terminated 33.7% of electrographic seizures compared with only 6% during sham stimulation, and the average electrographic seizure duration shortened by 38.7 ± 34.2% compared with sham stimulation. In contrast, interictal optogenetic activation of PV interneurons showed powerful and robust ictogenic effects. Approximately 60% of interictal optogenetic stimuli resulted in electrographic seizure initiation. Single-unit recordings revealed that presumptive PV-expressing interneurons markedly increased their firing during optogenetic stimulation, while many presumptive excitatory pyramidal neurons showed a biphasic response, with initial suppression of firing during the optogenetic pulse followed by a synchronized rebound increase in firing at the end of the laser pulse. Our findings indicated that ictal activation of PV-expressing interneurons possesses antiepileptic properties probably due to suppression of firing in pyramidal neurons during the laser pulse. However, in addition interictal activation of PV-expressing interneurons possesses powerful ictogenic properties, probably due to synchronized postinhibition rebound firing of pyramidal neurons.

Keywords: epilepsy; interneurons; neocortex; neurostimulation; optogenetics.


Figures

Fig. 1.
Fig. 1.
Imaging ChETA expression in PV interneurons. PV-IRES-Cre mice were injected with the viral vector AAV2/1-EF1a-DIO-ChETA-EYFP into the S1 barrel cortex at a depth of 350 μm. Figure presents a confocal z-stack fluorescent image of YFP of the cortex at the injected site. Note in the image the nonpyramidal neurons expressing YFP (and concomitantly the ChETA variant of ChR2). Scale bar, 50 μm.
Fig. 2.
Fig. 2.
4-AP induced seizures in the S1 barrel cortex of PV-Cre mice. A: ECoG recorded simultaneously in 3 channels from the S1 barrel cortex of a PV-Cre mouse during a seizure recorded after application of 3 mM 4-AP onto the neocortical surface. B: average time to first seizure (Sz) (left), seizure duration (center), and interseizure interval (right) are presented in control PV-Cre mice uninjected with the viral vector (4 mice), in PV-Cre mice injected with the viral vector AAV2/1-EF1a-DIO-ChETA-EYFP (5 mice, injected), and in the combined group of both injected and uninjected mice. C: duration of 25 individual seizures. Arrow marks the average value. D: duration of individual interictal intervals. Arrow marks the average value.
Fig. 3.
Fig. 3.
Ictal optogenetic stimulation of PV-expressing interneurons. Seizures were evoked by local application of 3 mM 4-AP onto the S1 barrel cortex, and optogenetic stimulation of PV-expressing interneurons was applied during seizures. A: example of a control unstimulated seizure (top) and a seizure terminated by 5-s optogenetic stimulation (bottom). In these experiments 2 different ictal stimulation paradigms were examined: 5- to 10-s pulses (A and B; 36 seizures in 8 rats, 18 ontogenetically stimulated and 18 sham stimulated) and trains of 10-ms pulses (C; either 5 individual 10-ms pulses applied at 0.4 Hz or 5 10-Hz, 1 s trains of 10-ms pulses applied at 0.2 Hz; 52 seizures in 9 rats, 26 optogenetically stimulated and 26 sham stimulated). The effect of the 2 ictal optogenetic stimulation paradigms is presented as % of seizures terminated during stimulation (right) and the average (mean ± SD) seizure duration of seizures that persisted beyond the duration of the optogenetic pulse (left). *P < 0.05, **P < 0.01 by either χ2 (fraction of seizures terminated) or Student's t-test (mean seizure duration). Note that 5- to 10-s optogenetic stimulation pulses of PV-expressing interneurons significantly increased the fraction of seizures terminated during the opto-stimulation and significantly decreased the average seizure duration, while 10-ms pulse trains showed no significant effects on these parameters.
Fig. 4.
Fig. 4.
Interictal optogenetic stimulation of PV-expressing interneurons. A: examples of optogenetic stimulation of PV-expressing interneurons activated during the interictal quiescent period between seizures. Two optogenetic paradigms were used: a 0.4-Hz train of five 10-ms pulses (top) and a 5-s pulse (bottom). For each example, the traces are shown at an expanded timescale in the lower trace. Note that both interictal optogenetic stimulation paradigms evoked a seizure and that for the 5-s pulse the seizure initiated after the laser pulse ended. B: % of interictal stimuli that evoked seizures during the 5- to 10-s stimuli (left) and the 0.4-Hz trains of five 10-ms optogenetic stimuli (right). **P < 0.01. The results of the optogenetic stimulation trains are compared with similar sham stimulation trains (control). C: relative timing between optogenetic stimulation and seizure initiation. Left: data for the 5- to 10-s optogenetic stimulation. Right: data for the 0.4-Hz trains of five 10-ms optogenetic pulses; S on the x-axis designates seizures that were terminated during stimulation.
Fig. 5.
Fig. 5.
Single-unit response to optogenetic activation under control conditions. A: response of 3 individual single units located in the S1 barrel cortex during a 5-s optogenetic activation of PV-expressing interneurons. Top: raster plots from 5 individual trials during opto-stimulation. Bottom: cumulative peristimulus histograms (PSTHs) of 3 individual neurons to the 5-s opto-stimulation (time bin of 0.1 s). The 3 neurons shown present examples of the different responses to 5-s optogenetic stimulation pulses. The first (left) shows a facilitatory response with rapid increase of firing that probably occurs in PV interneurons directly activated by the laser pulse. The second (center) shows a monophasic reduction in firing, probably occurring in pyramidal neurons secondarily inhibited by PV interneurons. The third (right) shows a biphasic response consisting of an initial suppression of firing followed by rebound-increased firing after the end of the optogenetic stimulation. The thick line marks the time of optogenetic stimulation. B: PSTH during 10-ms optogenetic stimuli is shown for 2 neurons (time bin of 1 ms). The first (left) responded with a rapid increase of firing to the optogenetic stimulus and represented a putative inhibitory interneuron, while the second (right) responded with a biphasic response and probably represented an excitatory pyramidal neuron. C: % of recorded neurons showing facilitatory, inhibitory monophasic, and biphasic inhibitory-excitatory responses and no significant responses during 10-ms and 5-s optogenetic stimulations. D: average peak amplitude of the different responses to the 10-ms and 5-s optogenetic pulses. The dotted line marks the prestimulus baseline value.
Fig. 6.
Fig. 6.
Single-unit response to optogenetic activation in the presence of 4-AP. A, top: peristimulus histogram (PSTH) of 2 individual single units located in the S1 barrel cortex during optogenetic activation of PV-expressing interneurons (the PSTH averages 7 optogenetic stimuli that led to seizure initiation). Bottom: single-unit activity of the 2 neurons during a single seizure. The individual neurons present examples of 2 different responses to 5-s optogenetic stimulation pulses in the presence of 4-AP (3 mM applied onto the neocortical surface). The first (left) is of a neuron responding with a facilitatory response to the optogenetic stimulation. When seizures initiated, the firing frequency rapidly increased. The second (right) shows a neuron with a biphasic inhibitory-excitatory response consisting of an initial suppression of firing followed by rebound-increased firing after the end of the optogenetic stimulation, which preceded seizure onset. When seizures initiated, firing further increased. The thick horizontal lines mark the timing of optogenetic stimulation. In both cases, a fraction of optogenetic stimulations evoked seizures. The thin horizontal line with boundaries shows the time window in which seizures initiated in the different optogenetic stimuli, and the vertical dotted line marks the initiation of the earliest seizure. It is important to stress that while the onset of individual seizures was associated with an abrupt increase in the firing frequency, the averaged response of several seizures showed a graded onset, as seizures initiated at different times relative to the opto-stimulation. B: % of recorded neurons showing facilitatory, monophasic inhibitory, and biphasic inhibitory-excitatory responses and no significant response during a 5-s optogenetic stimulation. C: average peak amplitude of the different responses to the 5-s optogenetic pulses. The dotted line marks the prestimulus baseline value.

References

    1. Avoli M, de Curtis M. GABAergic synchronization in the limbic system and its role in the generation of epileptiform activity. Prog Neurobiol 95: 104–132, 2011. - PMC - PubMed
    1. Barthó P, Hirase H, Monconduit L, Zugaro M, Harris KD, Buzsáki G. Characterization of neocortical principal cells and interneurons by network interactions and extracellular features. J Neurophysiol 92: 600–608, 2004. - PubMed
    1. Bergey GK. Neurostimulation in the treatment of epilepsy. Exp Neurol 244: 87–95, 2013. - PubMed
    1. Berglind F, Ledri M, Sørensen AT, Nikitidou L, Melis M, Bielefeld P, Kirik D, Deisseroth K, Andersson M, Kokaia M. Optogenetic inhibition of chemically induced hypersynchronized bursting in mice. Neurobiol Dis 65: 133–141, 2014. - PubMed
    1. Blauwblomme T, Jiruska P, Huberfeld G. Mechanisms of ictogenesis. Int Rev Neurobiol 114: 155–185, 2014. - PubMed

Publication types