. 2016 Sep 16;119(7):810-26.
doi: 10.1161/CIRCRESAHA.116.309094. Epub 2016 Aug 2.

Rasip1-Mediated Rho GTPase Signaling Regulates Blood Vessel Tubulogenesis via Nonmuscle Myosin II

Affiliations

Rasip1-Mediated Rho GTPase Signaling Regulates Blood Vessel Tubulogenesis via Nonmuscle Myosin II

David M Barry et al. Circ Res. .

Abstract

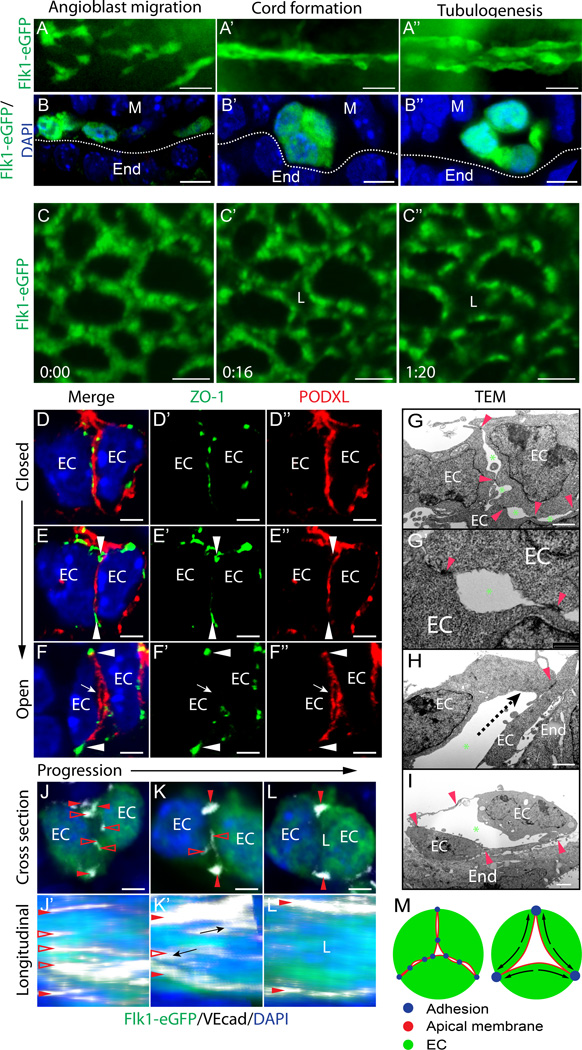
Rationale: Vascular tubulogenesis is essential to cardiovascular development. Within initial vascular cords of endothelial cells, apical membranes are established and become cleared of cell-cell junctions, thereby allowing continuous central lumens to open. Rasip1 (Ras-interacting protein 1) is required for apical junction clearance, as well as for regulation of Rho GTPase (enzyme that hydrolyzes GTP) activity. However, it remains unknown how activities of different Rho GTPases are coordinated by Rasip1 to direct tubulogenesis.

Objective: The aim of this study is to determine the mechanisms downstream of Rasip1 that drive vascular tubulogenesis.

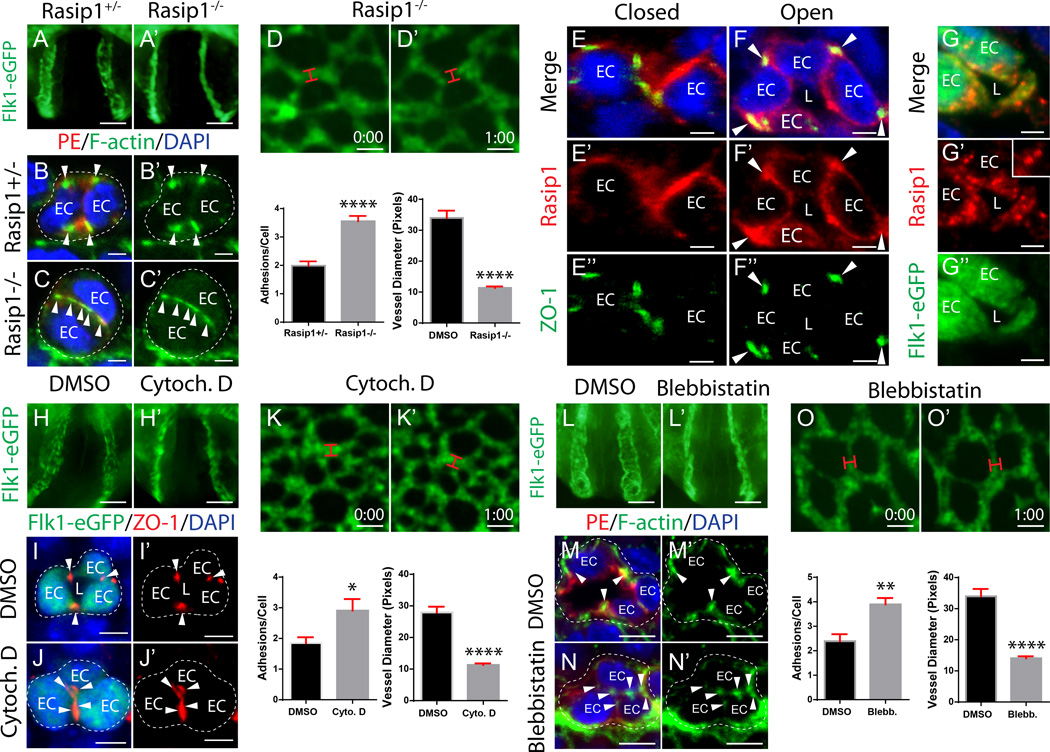
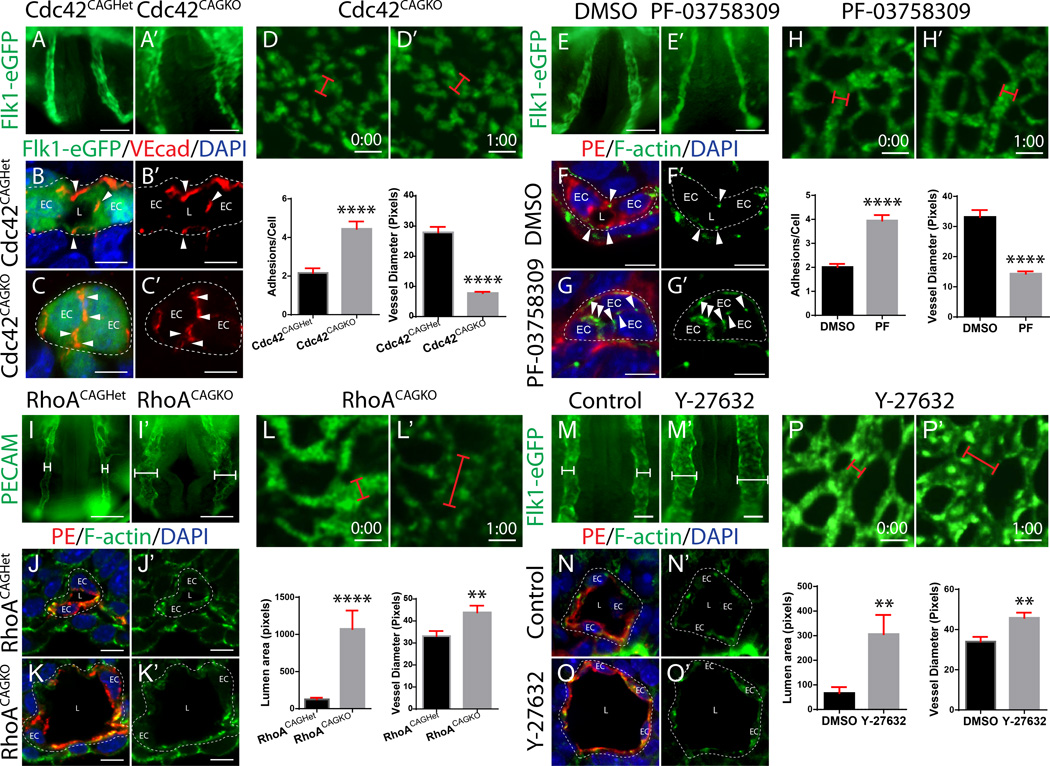
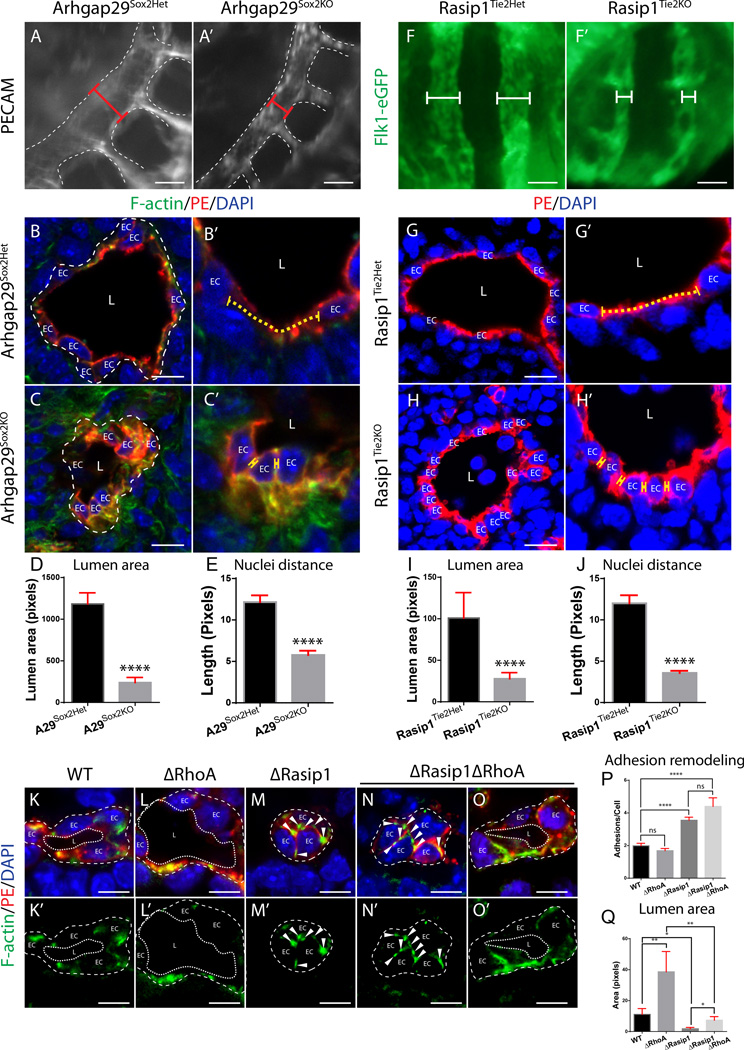
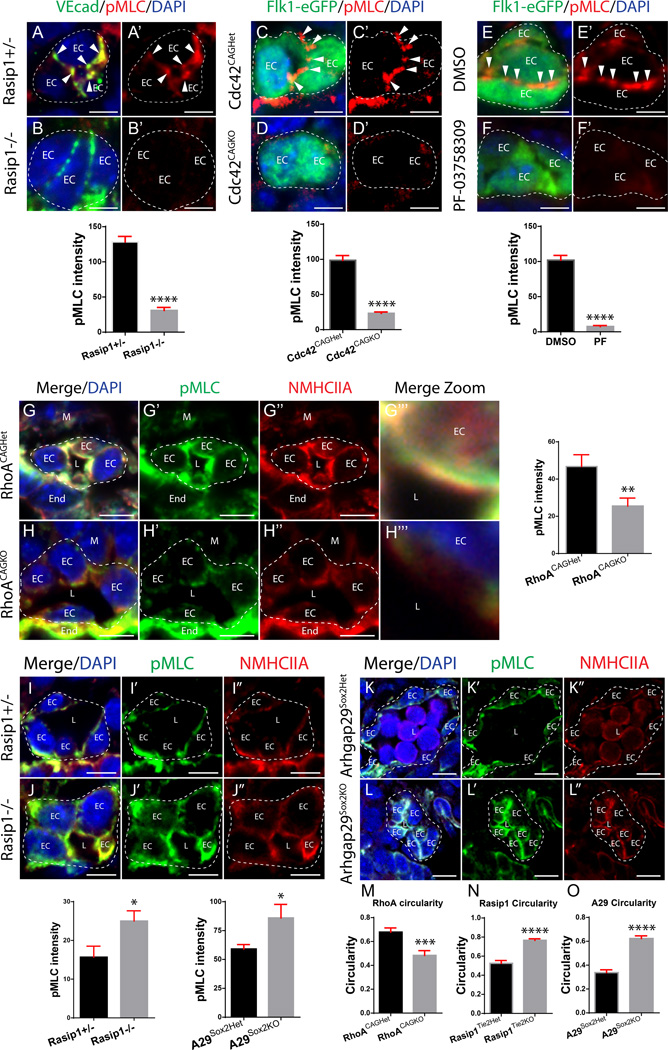
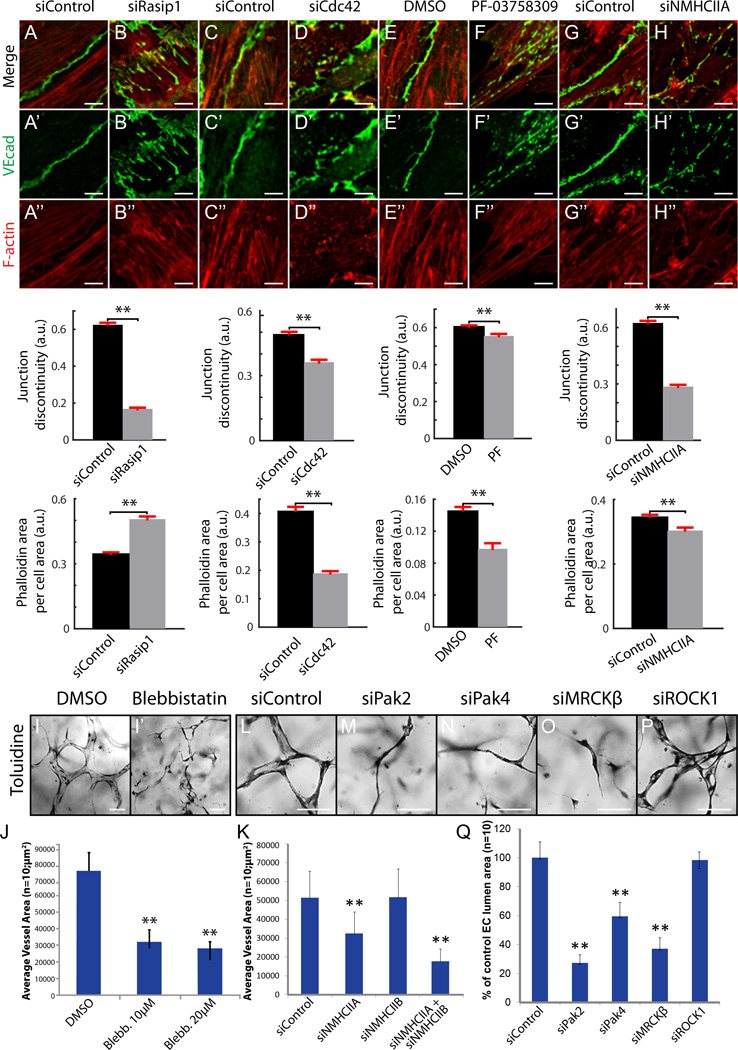
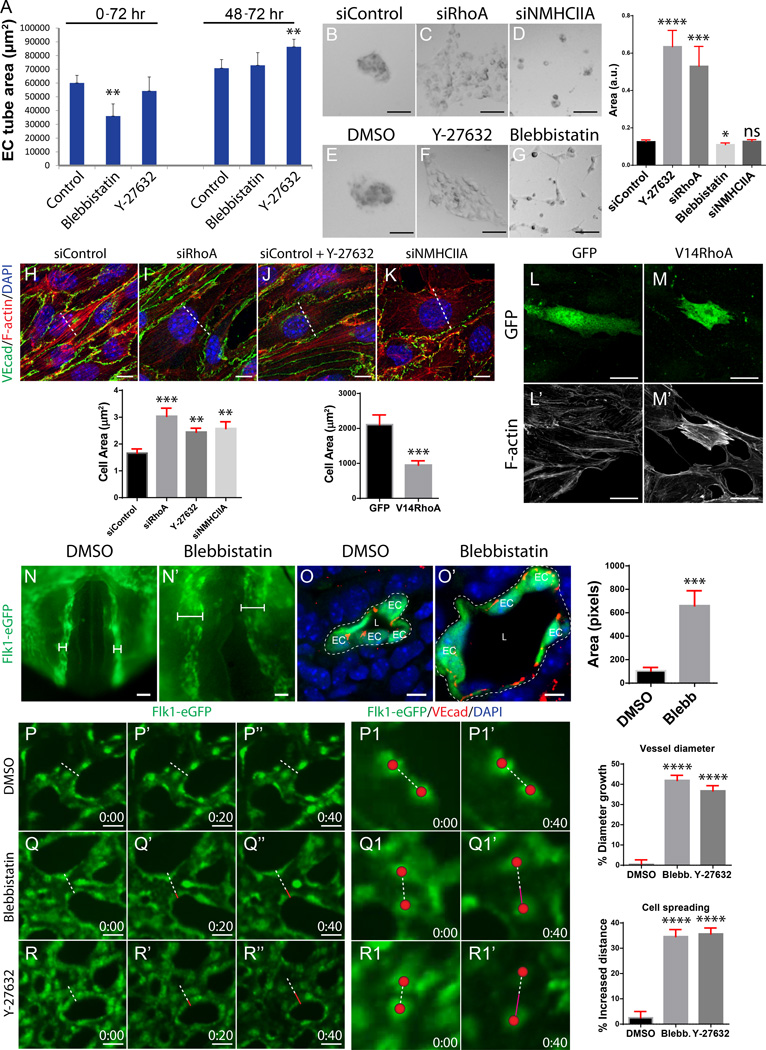
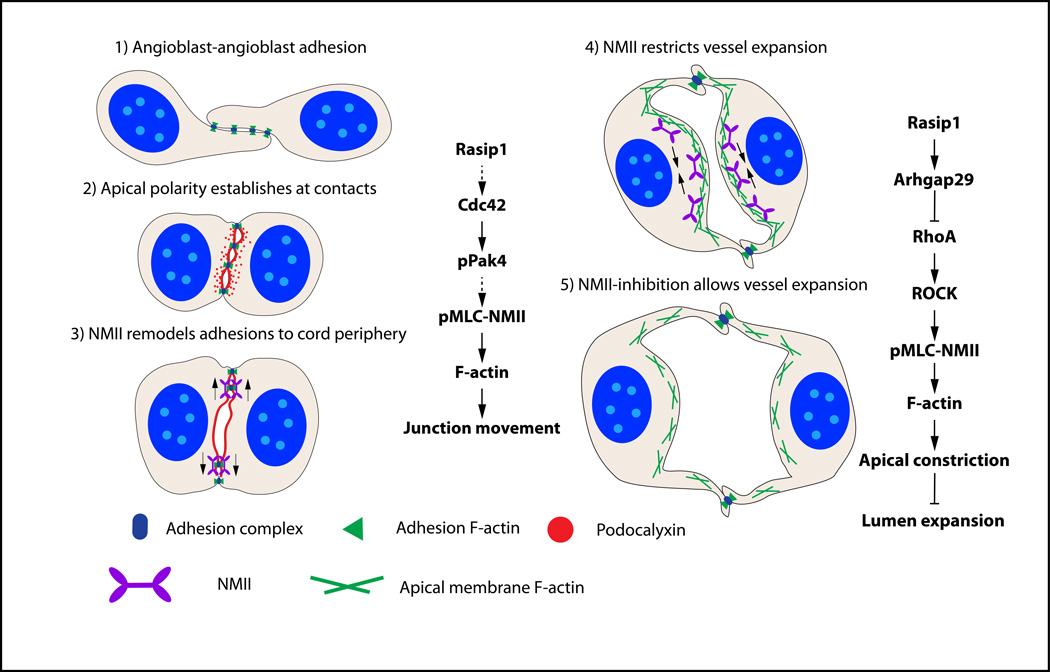
Methods and results: Using conditional mouse mutant models and pharmacological approaches, we dissect GTPase pathways downstream of Rasip1. We show that clearance of endothelial cell apical junctions during vascular tubulogenesis depends on Rasip1, as well as the GTPase Cdc42 (cell division control protein 42 homolog) and the kinase Pak4 (serine/threonine-protein kinase 4). Genetic deletion of Rasip1 or Cdc42, or inhibition of Pak4, all blocks endothelial cell tubulogenesis. By contrast, inactivation of RhoA (Ras homologue gene family member A) signaling leads to vessel overexpansion, implicating actomyosin contractility in control of lumen diameter. Interestingly, blocking activity of NMII (nonmuscle myosin II) either before, or after, lumen morphogenesis results in dramatically different tubulogenesis phenotypes, suggesting time-dependent roles.

Conclusions: Rasip1 controls different pools of GTPases, which in turn regulate different pools of NMII to coordinate junction clearance (remodeling) and actomyosin contractility during vascular tubulogenesis. Rasip1 promotes activity of Cdc42 to activate Pak4, which in turn activates NMII, clearing apical junctions. Once lumens open, Rasip1 suppresses actomyosin contractility via inhibition of RhoA by Arhgap29, allowing controlled expansion of vessel lumens during embryonic growth. These findings elucidate the stepwise processes regulated by Rasip1 through downstream Rho GTPases and NMII.

Keywords: Ras homologue gene family member A GTP-binding protein; Ras interacting protein 1; actin cytoskeleton; endothelial cells; morphogenesis; myosin type II; tubulogenesis.


Figures

Figure 1
Figure 1. Blood vessel lumens arise between ECs following clearance of pre-apical adhesions
(A–A’’) Flk1-eGFP embryos, whole-mount GFP stain (n=3). (B–B’’) Cross sections show progression of dorsal aorta cord and lumen formation. (C–C’’) Live imaging of Flk1-eGFP yolk sac vasculature. Time in hr:min. (D–F’’) Progression of TJs remodeling away from the apical membrane during lumen formation. Tight junctions, ZO-1; apical membrane, PODXL (n>10). EC, endothelial cell; arrowhead, adhesions at periphery; arrow, opening lumen. (G–I) TEM of aorta cord and opening lumen. Red arrowheads, EC-EC adhesion complex; green asterisk, luminal spaces between adhesions; dotted line, direction of adhesion movement. EC, endothelial cell; End, endoderm. (J–L) Cross sections of EC cords show adhesion remodeling (clearance from pre-apical membrane). VEcad, white; Flk1-eGFP, green; open arrowheads, clearing junctions at pre-apical membrane; closed arrowheads, sustained peripheral junctions. (J’–L’) En face Z-stack confocal image showing apical membrane surface junction ribbons, which are cleared as lumen opens. (M) Schematic model of lumen formation: adhesions are rearranged to the cord periphery to form a central lumen. Scale bars: A–A’’ 20µm, B–B’’ 7µm, C–C’’ 25µm, D–F’’ 3.5µm, G–I 2µm, J–L 3.5µm.
Figure 2
Figure 2. Clearance of EC pre-apical junctions requires Rasip1 and actomyosin contractility
(A–A’) Rasip1 null embryos expressing Flk1-eGFP fail to open lumens in the dorsal aorta (n=3 controls, n=3 mutants). (B–C’) Cross sections stained with PECAM and Endomucin costain (PE) and F-actin show that Rasip1 mutants fail to remodel adhesions to the periphery of the vascular cord (quantified in graph, n=3 controls, n=3 mutants; 15 Fields of view (FOV)). ****P<0.0001. EC, endothelial cell; arrowhead, adhesion. (D–D’) Live imaging of Rasip1−/−;Flk1-eGFP embryo yolk sacs (lumen diameter quantified in graph, n=41 control and n=39 mutant). ****P<0.0001. Red bracket, vessel diameter. Time in hr:min. (E–F’’) Staining of Rasip1 and TJ marker ZO-1 shows that Rasip1 enriches to adhesions during cord and lumen formation. Arrowheads, adhesions; EC, endothelial cell; L, lumen. (G–G’’) Staining of Rasip1 localizes at apical membrane after lumen formation. Inset shows endosomal structures. (H–H’) WECs treated with Cytochalasin D (10µM) fail to open aortic lumens (n=3 controls, n=3 treated). (I–J’) Cross sections stained for GFP and ZO-1 show that Cytochalasin D-treated embryos fail to remodel adhesions to cord periphery (quantified in graph, n=3 controls, n=3 treated; 15 FOV). *P<0.05. (K–K’) Live imaging of Cytochalasin D-treated Flk1-eGFP embryos (lumen diameter quantified in graph, n=45 control and n=66 treated). ****P<0.0001. (L–L’) WECs treated with blebbistatin (10µM) fail to open aortic lumens (n=3 controls, n=3 treated). (M–N’) Cross sections stained with PE and F-actin show that blebbistatin-treated embryos fail to remodel adhesions to cord periphery (quantified in graph, n=3 controls, n=3 treated; 15 FOV). **P<0.01. (O–O’) Live imaging of blebbistatin-treated Flk1-eGFP embryo yolk sacs (lumen diameter quantified in graph, n=41 control and n=20 treated). ****P<0.0001. Scale bars: A–A’ 100µm, B–C’ 3.5µm, E–E’ 25µm, G–G’ 3µm, I–I’’ 7µm, J–J’ 100µm, K–L’ 5µm, N–N’ 25µm, P–P’ 100µm, Q–R’ 5µm, T–T’ 25µm.
Figure 3
Figure 3. Cdc42, but not RhoA, signaling downstream of Rasip1 is required for lumen formation
(A–A’) Cdc42CAGKO embryos expressing Flk1-eGFP fail to open lumens in the dorsal aorta (n>22 controls, n=22 mutants). (B–C’) Cross sections stained for GFP and VEcad show that Cdc42CAGKO embryos fail to remodel adhesions to the periphery of the vascular cord (quantified in graph, n=3 control, mutant; 15 FOV). ****P<0.0001. EC, endothelial cell; L, lumen; arrowhead, adhesion. (D–D’) Live imaging of Cdc42CAGKO Flk1-eGFP embryo yolk sacs (lumen diameter quantified in graph, n=45 control and n=38 mutants). ****P<0.0001. Red bracket, vessel diameter. (E–E’) WECs treated with the Pak4 inhibitor PF-03758309 (10µM) fail to open aortic lumens (n=3 controls, n=3 treated). (F–G’) Cross sections stained for PE and F-actin show that Pak4-inhibited embryos fail to remodel adhesions to the cord periphery (quantified in graph, n=3 controls, n=3 treated; 15 FOV). ****P<0.0001. (H–H’) Live imaging of Pak4-inhibited Flk1-eGFP embryo yolk sacs (lumen diameter quantified in L, n=40 control and n=33 treated). ****P<0.0001. (I–I’) RhoACAGKO embryos possess expanded dorsal aortae (n=4 controls, n=4 mutants). (J–K’) Cross sections stained for PE and F-actin show that RhoACAGKO embryos fail to maintain proper vessel diameter and possess expanded vessels (quantified in graph, n=8 controls, n=8 mutants, 15 FOV). ****P<0.0001. (L–L’) Live imaging of RhoACAGKO Flk1-eGFP embryo yolk sacs (lumen diameter quantified in graph, n=40 control and n=36 mutant). **P<0.01. (M–M’) WECs treated with Y-27632 (10µM) have expanded vessels (n=3 controls, n=3 treated). (N–O’) Cross sections stained for PE and F-actin show that ROCK-inhibited embryos fail to maintain proper vessel diameter and possess expanded vessels (quantified in graph, n=3 controls, n=3 treated, 15 FOV). **P<.01. (P–P’) Live imaging of ROCK-inhibited Flk1-eGFP embryo yolk sacs (lumen diameter quantified in graph, n=41 control and n=49 treated). **P<0.01. Scale bars: A–A’ 100µm, B–C’ 7µm, E–E’ 25µm, G–G’ 100µm, H–I’ 5µm, K–K’ 25µm, M–M’ 50µm, Q–Q’25µm, S–S’ 50µm, T–U’ 7µm, W–W’ 25µm.
Figure 4
Figure 4. Arhgap29 and Rasip1 cooperate to suppress RhoA-mediated EC contractility and lumen expansion
(A–A’) Arhgap29Sox2KO embryos stained with PECAM show constricted dorsal aortae (n=3 control and mutant). Red bracket, diameter of vessel. (B–C’) Cross sections of E8.75 Arhgap29Sox2het and Arhgap29Sox2KO embryos shows vessel constriction after Arhgap29 deletion with smaller vessel lumens and closer adjacent EC nuclei (zoomed-in in B’ and C’, n=3 control and mutant, 15 FOV, quantified in D and E). ****P<0.0001. Yellow dotted line, adjacent nuclei distance; EC, endothelial cell; L, lumen. (F–F’) Whole mount images of Flk1-eGFP;Rasip1Tie2Het and Flk1-eGFP;Rasip1Tie2KO embryos show constricted aortae after Rasip1 deletion. White bracket, diameter of vessel. (G–H’) Cross sections of E8.75 Rasip1Tie2Het and Rasip1Tie2KO embryos shows vessel constriction after Rasip1 deletion with smaller vessel lumens and closer adjacent EC nuclei (zoomed-in in G’ and H’, n= 3 control and mutant, 15 FOV, quantified in I and J). ****P<0.0001. (K–O’) Deletion of Rasip1 and RhoA partially rescues lumen expansion but does not rescue adhesion remodeling from the center of vascular cords (n=4 control and mutants, 20 FOV, quantified in P and Q). Arrowheads, adhesion complexes. *P<0.05, **P<0.01, ****P<0.0001, ns =not significant. Scale bars: A–A’ 25µm, B–C’ 10µm, G–H’ 10µm, K–O’ 7µm.
Figure 5
Figure 5. NMII acts downstream of Cdc42-Pak4 to remodel apical adhesions, while serving as a RhoA-ROCK effector to regulate apical membrane tension
(A–B’) Staining for VEcad and pMLC on Rasip1+/− and Rasip1−/− embryos shows that Rasip1 is necessary for NMII activity during vascular cord adhesion remodeling (n= 3 control and mutants/WECs, 15 FOV, quantified in graph). ****P<0.0001. Arrowheads, adhesion complex pMLC; EC, endothelial cell. (C–D’) Staining of Flk1-eGFP and pMLC on Cdc42CAGHet and Cdc42CAGKO embryos shows that Cdc42 is necessary for NMII activity during cord adhesion remodeling (n= 3 control and mutant, 15 FOV, quantified in graph). ****P<0.0001. (E–F’) Staining of Flk1-eGFP and pMLC on DMSO and PF-03758309-treated WECs shows that Pak4 is necessary for pMLC activity during cord adhesion remodeling (n= 3 control and treated, 15 FOV, quantified in graph). ****P<0.0001. (G–H’’’) Staining for NMHCIIA and pMLC on RhoACAGHet and RhoACAGKO embryos shows that RhoA is necessary for NMII activity at the apical membrane during lumen formation (n= 3 control and mutant, 15 FOV, quantified in graph). **P<0.01. EC, endothelial cell; L, lumen; M, mesoderm; End, endoderm. (I–J’’) Staining of NMHCIIA and pMLC on Rasip1+/− and Rasip1−/− embryos shows that Rasip1 is necessary to suppress NMII activity at the apical membrane during lumen formation (n= 3 control and mutant, 15 FOV, quantified in graph). *P<0.05. (K–L’’) Staining of NMHCIIA and pMLC on Arhgap29Sox2Het and Arhgap29Sox2KO embryos shows that Arhgap29 is necessary to suppress NMII activity at the apical membrane during lumen formation (n= 3 control and mutant, 15 FOV, quantified in graph). *P<0.05. (M-O) Quantification of EC circularity after deletion of RhoA, Rasip1, or Arhgap29, respectively (n= 3 control and mutants, 15 FOV). ***P<0.001. ****P<0.0001. Scale bars: A–B’ 5µm, D–E’ 5µm, G–H’ 5µm, J–K’’ 7µm, M–N’’ 7µm, P–Q’’ 10µm.
Figure 6
Figure 6. Cdc42, Pak4 and NMII pathway downstream of Rasip1 supports EC-EC junctions and vascular lumenogenesis
(A–H’’) Staining and quantification of VEcad continuity and F-actin area at MS1 EC cell-cell junctions after siRNA reduction of Rasip1, Cdc42, or NMHCIIA, or pharmacological inhibition of Pak4 (n=3 control and treated, 15 FOV). **P<0.01. (I–J) Inhibition of NMII via 10µM or 20µM blebbistatin treatment prevents EC lumen formation in 3D collagen matrices (quantified in J). **P<0.01. (K) Graph showing that reduction of NMHCIIA or NMHCIIA and NMHCIIB combined, but not NMHCIIB alone, prevents EC lumen formation in 3D collagen matrices. **P<0.01. (L–XQ) siRNA reduction of Cdc42 effectors Pak2, Pak4, or MRCKβ but not RhoA effector ROCK prevents EC lumen formation in 3D collagen matrices (quantified in Q). **P<0.01. Scale bars: A–N’’ 5µm, Q–X 100µm.
Figure 7
Figure 7. NMII temporally stimulates lumen formation then suppresses cell spreading and lumen expansion via RhoA-ROCK signaling
(A) Graph depicting vessel area in a 3D EC lumen formation assay after treatment with blebbistatin or Y-27632 before lumen formation (0–72 hours) or after lumen formation (48–72 hours). **P<0.01. (B–G) Matrigel cell aggregation assay after siRNA reduction of RhoA or NMHCIIA or treatment with Y-27632 or blebbistatin (n>50 control and treated, 9 FOV, quantified in graph). *P<0.05, ***P<0.001, ****P<0.0001, ns = not significant. (H–K) MS1 cells stained for VEcad and F-actin to assess stress fiber development and cell spreading after siRNA reduction of RhoA or NMHCIIA or pharmacological inhibition of ROCK (n= 3 control and treated, 15 FOV, cell spreading quantified in graph). **P<0.01, ***P<0.001. Dotted line, lowest central diameter. (L–M’) GFP and F-actin staining after adenoviral infection of GFP or V14RhoA + GFP in MS1 cells to assess cell spreading and actin contractility (n>15 control and treated, 15 FOV, cell spreading quantified in graph). (N–N’) 2 hour WECs of Flk1-eGFP embryos treated with blebbistatin after initial lumen formation of the dorsal aorta (n=3 control and treated). Brackets, vessel diameter. (O–O’) Cross sections show that NMII inhibition after initial lumen formation causes vessels to expand (n=3 control and treated, 15 FOV, quantified in graph). ***P<0.001. EC, endothelial cell; L, lumen. (P–R’’) Live imaging of Flk1-eGFP yolk sac vessels treated with either blebbistatin or Y-27632 after lumen formation (n= 20 control and treated, change in vessel diameter size quantified in graph). Images are snap shots at 0, 20, and 40 minutes. ****P<0.0001. Dotted line, starting vessel diameter; red line, increased length of vessel diameter. (P1–R1’) Tracking of EC spreading after blebbistatin or Y-27632 treatment for 40 minutes (quantified in graph). ****P<0.0001. Red sphere, EC center; dotted line, starting distance between cells; magenta line, increased distance between cells. Scale bars: b–g 50µm, i–l 10µm, n–o’ 25µm, q–q’ 20µm, R–R’ 5µm, T–V’’ 25µm.
Figure 8
Figure 8. Model of tubulogenesis and vessel expansion during vasculogenesis
1) Angioblasts develop from mesodermal tissue and form punctae of adhesions with adjacent angioblasts. 2) At the angioblast cell-cell contact, PODXL is polarized between the cells, overlapping with the cell adhesion complexes. 3) After activation by Rasip1 and Cdc42-Pak4 signaling, NMII uses its contractile abilities on F-actin to redistribute adhesion complexes away from the pre-apical membrane to the cord periphery, exposing a single luminal space. 4) After lumen formation is complete, the lumen opens in a controlled manner. RhoA-ROCK-activated NMII suppresses excessive expansion of the lumen by constricting F-actin within ECs and at the apical membrane. 5) As the lumen expands, NMII activity is relaxed by inhibiting RhoA-ROCK-NMII signaling through Rasip1 and Arhgap29.

References

    1. Iruela-Arispe ML, Davis GE. Cellular and molecular mechanisms of vascular lumen formation. Dev Cell. 2009;16:222–231. - PMC - PubMed
    1. Davis GE, Stratman AN, Sacharidou A, Koh W. Molecular basis for endothelial lumen formation and tubulogenesis during vasculogenesis and angiogenic sprouting. Int Rev Cell Mol Biol. 2011;288:101–165. - PMC - PubMed
    1. Etienne-Manneville S, Hall A. Rho GTPases in cell biology. Nature. 2002;420:629–635. - PubMed
    1. Bayless KJ, Davis GE. The Cdc42 and Rac1 GTPases are required for capillary lumen formation in three-dimensional extracellular matrices. J Cell Sci. 2002;115:1123–1136. - PubMed
    1. Xu K, Sacharidou A, Fu S, Chong DC, Skaug B, Chen ZF, Davis GE, Cleaver O. Blood vessel tubulogenesis requires Rasip1 regulation of GTPase signaling. Developmental Cell. 2011;20 - PMC - PubMed