

Heteroresistance to Fluconazole Is a Continuously Distributed Phenotype among Candida glabrata Clinical Strains Associated with In Vivo Persistence
- PMID: 27486188
- PMCID: PMC4981708
- DOI: 10.1128/mBio.00655-16
Heteroresistance to Fluconazole Is a Continuously Distributed Phenotype among Candida glabrata Clinical Strains Associated with In Vivo Persistence
Abstract
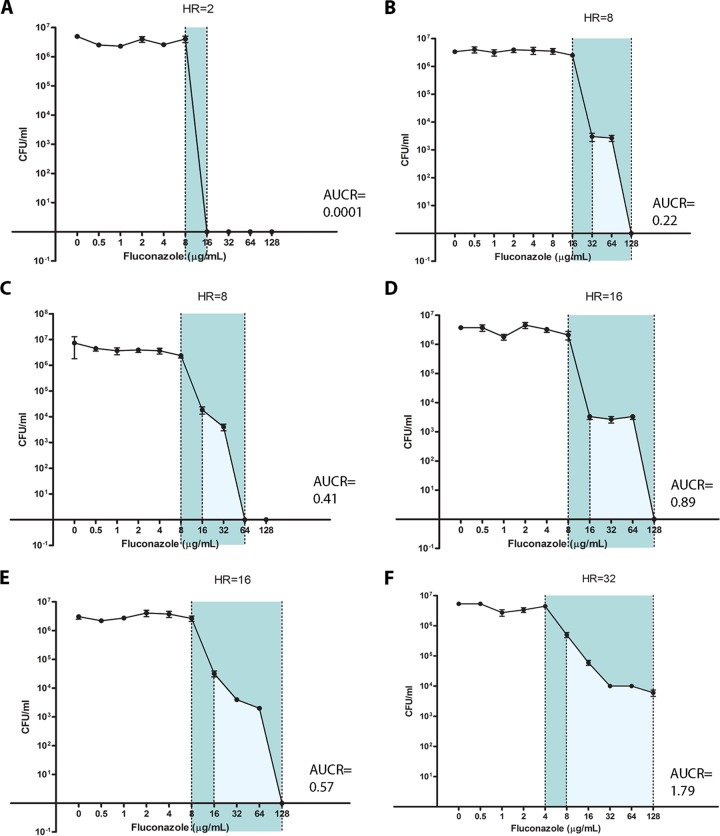
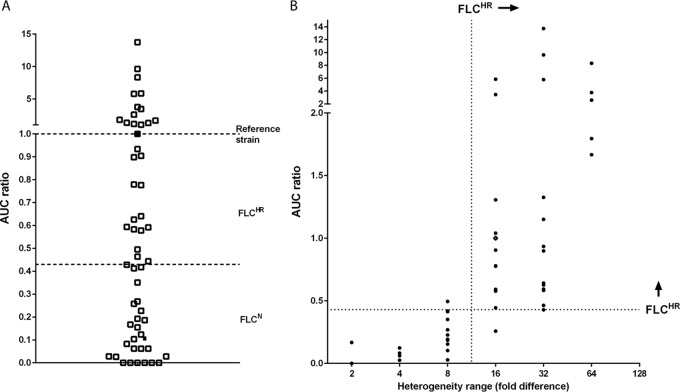
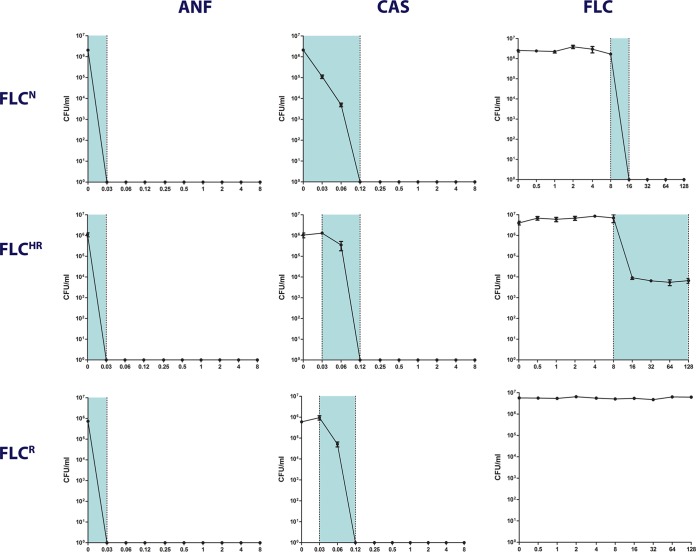
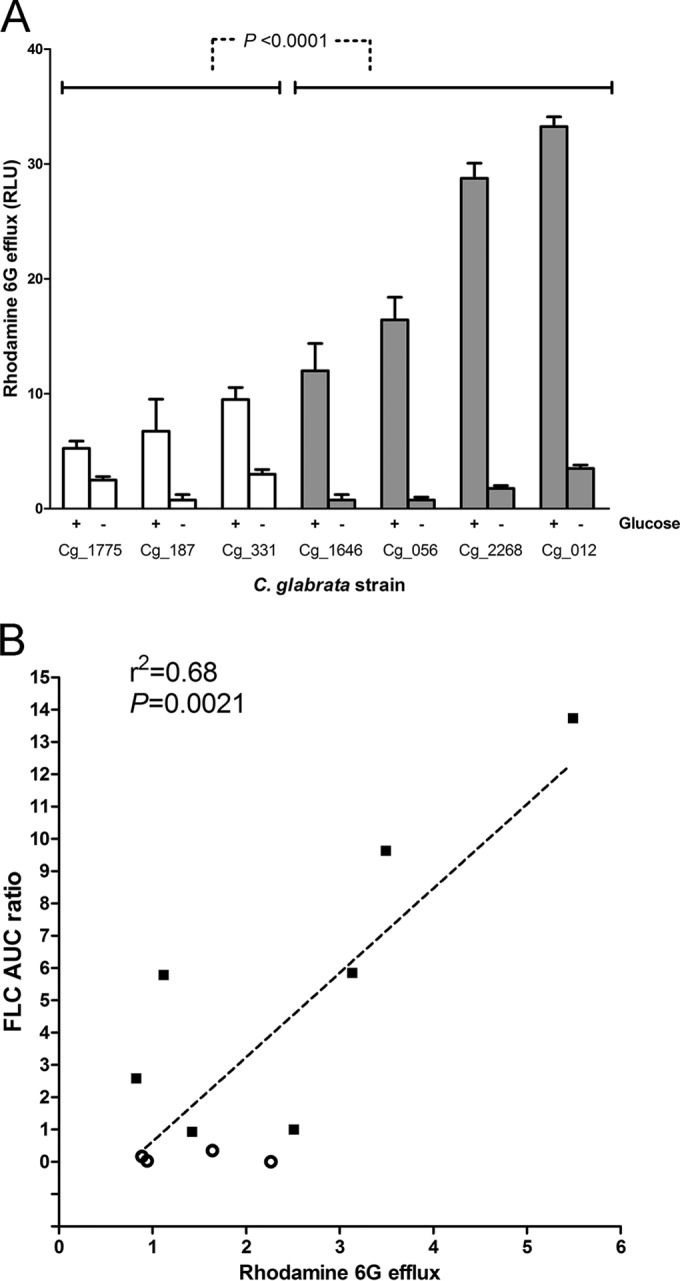
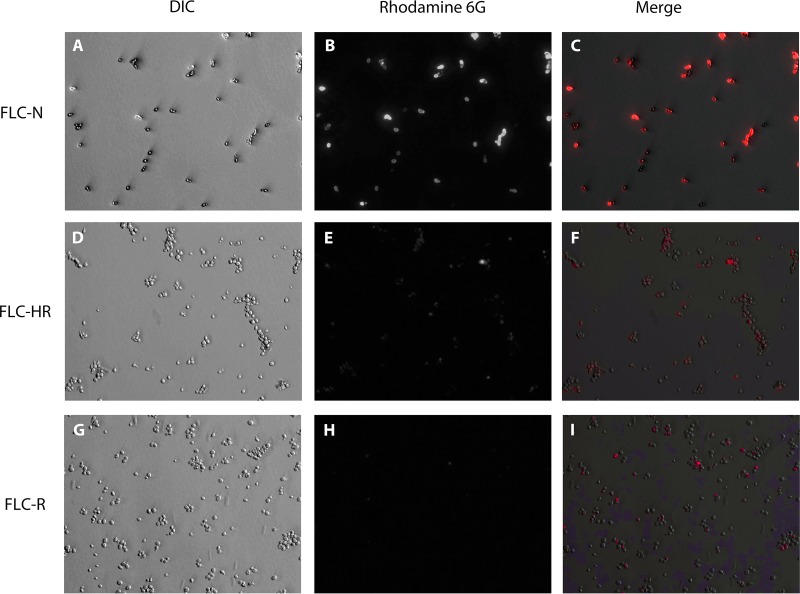
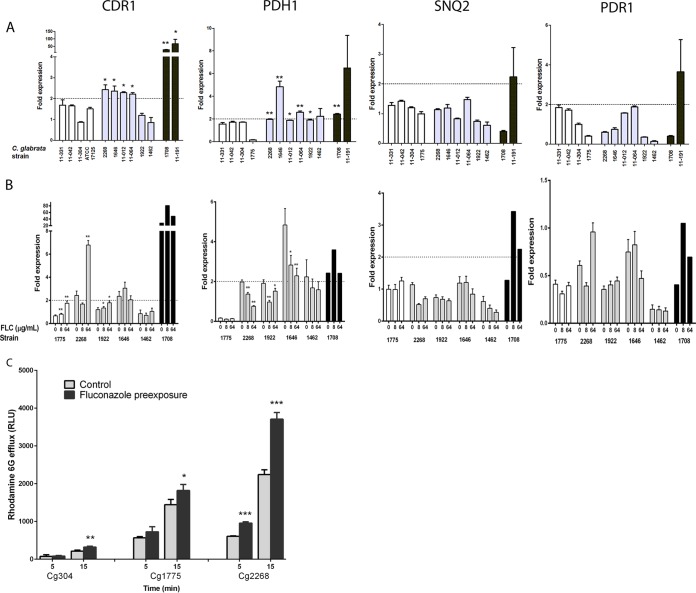
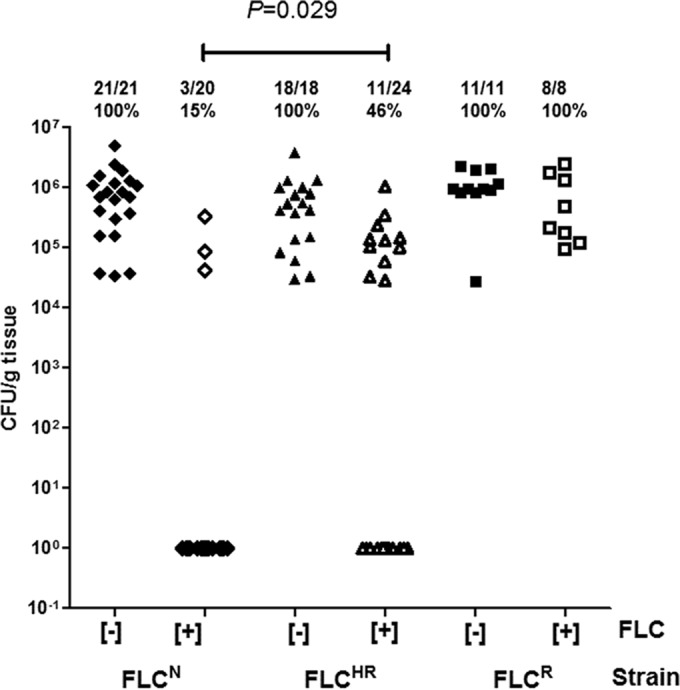
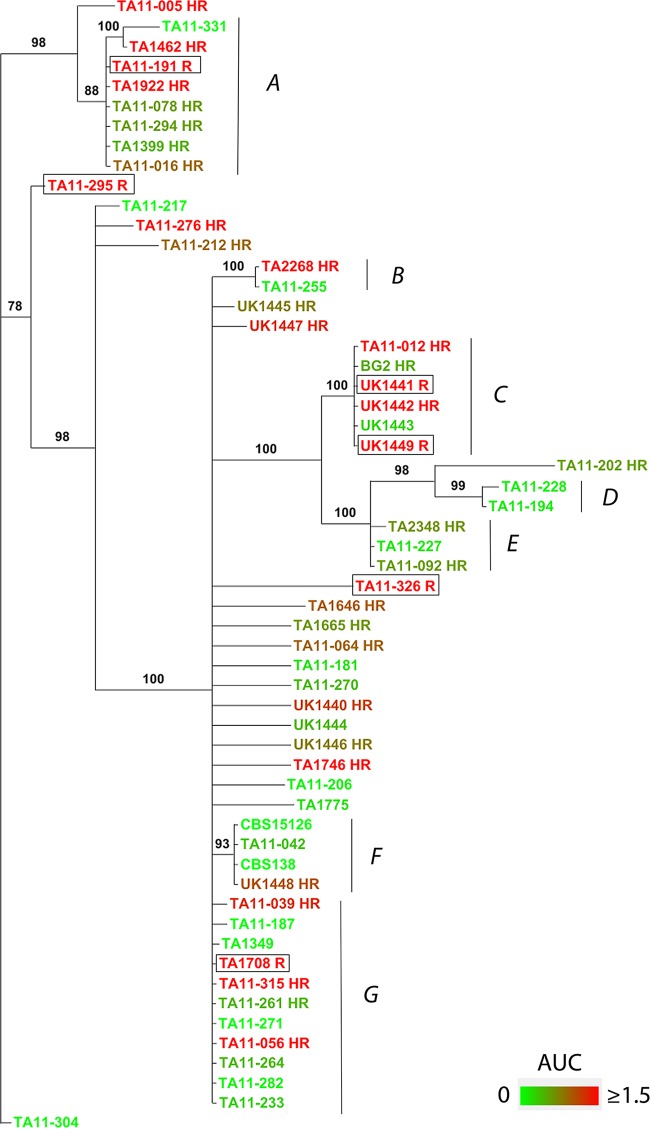
Candida glabrata causes persistent infections in patients treated with fluconazole and often acquires resistance following exposure to the drug. Here we found that clinical strains of C. glabrata exhibit cell-to-cell variation in drug response (heteroresistance). We used population analysis profiling (PAP) to assess fluconazole heteroresistance (FLC(HR)) and to ask if it is a binary trait or a continuous phenotype. Thirty (57.6%) of 52 fluconazole-sensitive clinical C. glabrata isolates met accepted dichotomous criteria for FLC(HR) However, quantitative grading of FLC(HR) by using the area under the PAP curve (AUC) revealed a continuous distribution across a wide range of values, suggesting that all isolates exhibit some degree of heteroresistance. The AUC correlated with rhodamine 6G efflux and was associated with upregulation of the CDR1 and PDH1 genes, encoding ATP-binding cassette (ABC) transmembrane transporters, implying that HetR populations exhibit higher levels of drug efflux. Highly FLC(HR) C. glabrata was recovered more frequently than nonheteroresistant C. glabrata from hematogenously infected immunocompetent mice following treatment with high-dose fluconazole (45.8% versus 15%, P = 0.029). Phylogenetic analysis revealed some phenotypic clustering but also variations in FLC(HR) within clonal groups, suggesting both genetic and epigenetic determinants of heteroresistance. Collectively, these results establish heteroresistance to fluconazole as a graded phenotype associated with ABC transporter upregulation and fluconazole efflux. Heteroresistance may explain the propensity of C. glabrata for persistent infection and the emergence of breakthrough resistance to fluconazole.
Importance: Heteroresistance refers to variability in the response to a drug within a clonal cell population. This phenomenon may have crucial importance for the way we look at antimicrobial resistance, as heteroresistant strains are not detected by standard laboratory susceptibility testing and may be associated with failure of antimicrobial therapy. We describe for the first time heteroresistance to fluconazole in C. glabrata, a finding that may explain the propensity of this pathogen to acquire resistance following exposure to fluconazole and to persist despite treatment. We found that, rather than being a binary all-or-none trait, heteroresistance was a continuously distributed phenotype associated with increased expression of genes that encode energy-dependent drug efflux transporters. Moreover, we show that heteroresistance is associated with failure of fluconazole to clear infection with C. glabrata Together, these findings provide an empirical framework for determining and quantifying heteroresistance in C. glabrata.
Copyright © 2016 Ben-Ami et al.
Figures
Similar articles
-
Mechanisms of azole resistance in clinical isolates of Candida glabrata collected during a hospital survey of antifungal resistance.Antimicrob Agents Chemother. 2005 Feb;49(2):668-79. doi: 10.1128/AAC.49.2.668-679.2005. Antimicrob Agents Chemother. 2005. PMID: 15673750 Free PMC article.
-
Expression Patterns of ABC Transporter Genes in Fluconazole-Resistant Candida glabrata.Mycopathologia. 2017 Apr;182(3-4):273-284. doi: 10.1007/s11046-016-0074-8. Epub 2016 Oct 15. Mycopathologia. 2017. PMID: 27744635
-
The monoamine oxidase A inhibitor clorgyline is a broad-spectrum inhibitor of fungal ABC and MFS transporter efflux pump activities which reverses the azole resistance of Candida albicans and Candida glabrata clinical isolates.Antimicrob Agents Chemother. 2012 Mar;56(3):1508-15. doi: 10.1128/AAC.05706-11. Epub 2011 Dec 27. Antimicrob Agents Chemother. 2012. PMID: 22203607 Free PMC article.
-
Candida and candidaemia. Susceptibility and epidemiology.Dan Med J. 2013 Nov;60(11):B4698. Dan Med J. 2013. PMID: 24192246 Review.
-
Antifungal drug resistance in pathogenic fungi.Med Mycol. 1998;36 Suppl 1:119-28. Med Mycol. 1998. PMID: 9988500 Review.
Cited by
-
The role of Lactobacillus species in the control of Candida via biotrophic interactions.Microb Cell. 2019 Nov 25;7(1):1-14. doi: 10.15698/mic2020.01.702. Microb Cell. 2019. PMID: 31921929 Free PMC article. Review.
-
Aspergillus fumigatus Afssn3-Afssn8 Pair Reverse Regulates Azole Resistance by Conferring Extracellular Polysaccharide, Sphingolipid Pathway Intermediates, and Efflux Pumps to Biofilm.Antimicrob Agents Chemother. 2018 Feb 23;62(3):e01978-17. doi: 10.1128/AAC.01978-17. Print 2018 Mar. Antimicrob Agents Chemother. 2018. PMID: 29311083 Free PMC article.
-
Fluconazole Resistance and Heteroresistance in Cryptococcus spp.: Mechanisms and Implications.Rev Soc Bras Med Trop. 2025 Mar 24;58:e002002025. doi: 10.1590/0037-8682-0328-2024. eCollection 2025. Rev Soc Bras Med Trop. 2025. PMID: 40136153 Free PMC article. Review.
-
Impact of tolerance to fluconazole on treatment response in Candida albicans bloodstream infection.Mycoses. 2021 Jan;64(1):78-85. doi: 10.1111/myc.13191. Epub 2020 Oct 15. Mycoses. 2021. PMID: 33000505 Free PMC article.
-
Expandable and reversible copy number amplification drives rapid adaptation to antifungal drugs.Elife. 2020 Jul 20;9:e58349. doi: 10.7554/eLife.58349. Elife. 2020. PMID: 32687060 Free PMC article.
References
-
- Pfaller MA, Messer SA, Boyken L, Hollis RJ, Rice C, Tendolkar S, Diekema DJ. 2004. In vitro activities of voriconazole, posaconazole, and fluconazole against 4,169 clinical isolates of Candida spp. and Cryptococcus neoformans collected during 2001 and 2002 in the ARTEMIS global antifungal surveillance program. Diagn Microbiol Infect Dis 48:201–205. doi:10.1016/j.diagmicrobio.2003.09.008. - DOI - PubMed
-
- Pfaller MA, Diekema DJ, International Fungal Surveillance Participant Group . 2004. Twelve years of fluconazole in clinical practice: global trends in species distribution and fluconazole susceptibility of bloodstream isolates of Candida. Clin Microbiol Infect 10(Suppl 1):11–23. doi:10.1111/j.1470-9465.2004.t01-1-00844.x. - DOI - PubMed
-
- Pfaller MA, Diekema DJ, Gibbs DL, Newell VA, Barton R, Bijie H, Bille J, Chang SC, da Luz Martins M, Duse A, Dzierzanowska D, Ellis D, Finquelievich J, Gould I, Gur D, Hoosen A, Lee K, Mallatova N, Mallie M, Peng NG, Petrikos G, Santiago A, Trupl J, VanDen Abeele AM, Wadula J, Zaidi M. 2010. Geographic variation in the frequency of isolation and fluconazole and voriconazole susceptibilities of Candida glabrata: an assessment from the Artemis DISK Global Antifungal Surveillance Program. Diagn Microbiol Infect Dis 67:162–171. doi:10.1016/j.diagmicrobio.2010.01.002. - DOI - PubMed
-
- Sanguinetti M, Posteraro B, Fiori B, Ranno S, Torelli R, Fadda G. 2005. Mechanisms of azole resistance in clinical isolates of Candida glabrata collected during a hospital survey of antifungal resistance. Antimicrob Agents Chemother 49:668–679. doi:10.1128/AAC.49.2.668-679.2005. - DOI - PMC - PubMed
MeSH terms
Substances
LinkOut - more resources
Full Text Sources
Other Literature Sources
Medical
Molecular Biology Databases
Research Materials
Miscellaneous
